How to Build GA4 Funnel Exploration Reports (2025)
Have you ever wondered how your website visitors interact with your sales process? The GA4 Funnel Exploration feature offers powerful insights to answer just that.
In this blog, we’ll look at GA4 Funnel exploration, how to make a Google Analytics Funnel Report, and how it may help your business.
In this Article:
What is Funnel Tracking in GA4?
Before diving into the steps of creating a funnel report, it’s crucial to understand what funnel tracking is all about. Funnel tracking is a method to visualize and understand users’ flow through a series of steps on your website. Think of it as a map showing where your users go, where they drop off, and where they complete a desired action.
GA4 Funnel Exploration reports take this a step further. These reports don’t just track predefined funnels; they allow for on-the-fly creation and editing of funnels. This flexibility is convenient when you want to test different funnel hypotheses quickly. Whether for GA4 funnel custom events or a GA4 ecommerce funnel, this tool is invaluable.
How to Create GA4 Funnel Exploration Reports (Step by Step)
Let’s consider an example of Funnel Tracking of the Purchase Journey.
You can construct a Funnel Report for a product purchase path by defining events that represent the steps a user takes to make a purchase. Among these steps are:
- Vist_website
- Session_start
- Product_Page_Visit
- Add_To_Cart
- Purchased
Step 1: Define Events
This funnel exploration can be set up in a simple way. But first, you need to ensure you have made events to track customers’ purchase journey.
If you haven’t set up events before, you must define your Custom Events by navigating to Events in GA4.
Step 2: Create a GA4 Funnel Exploration Report
Select Explore from the left side panel.
Then select Funnel exploration from the Template gallery.
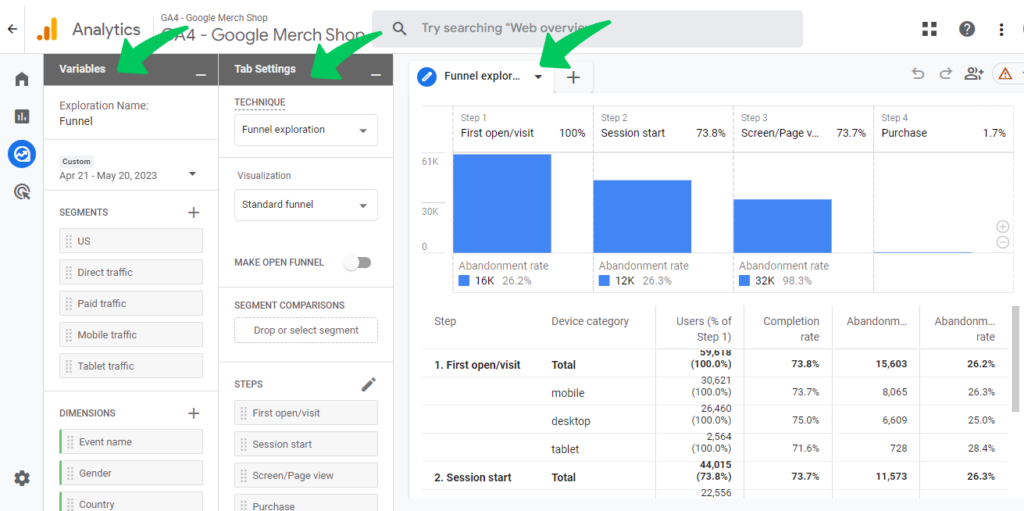
You will see a wide interface of GA4 Funnel exploration.
Funnel Exploration’s interface has three columns:
- Variables
- Tab Settings
- Funnel exploration report
Look at the screenshot below.
Let’s start exploring all its features step by step.
Variables
First, we’ll start with the Variables column.
Step 3: Exploration Name and Date Range
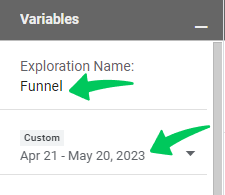
In the top left part of the screen, you can change the name of the exploration.
Write a suitable and descriptive name under the Exploration Name.
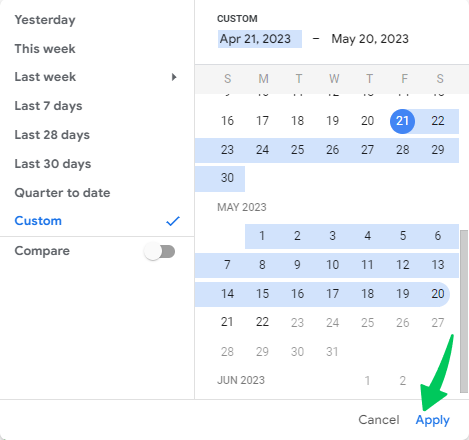
Under the exploration name, you can also choose a custom date range according to your choice, like the last 7 days or the last 28 days.
You can also explore the Compare feature of custom dates to compare the data between different dates.
Step 4: Segments and Custom Segments
Segments are an important component of Funnel exploration. There are subsets of your Analytics data. For example, you can set up a segment of people who have completed some activity, like purchasing an item.
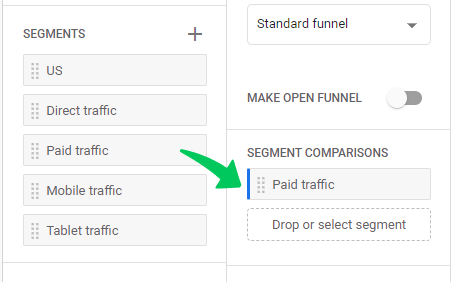
You can choose segments to compare from the already decided 5 segments.
For this, just drag segments from Variables to Tab Settings.
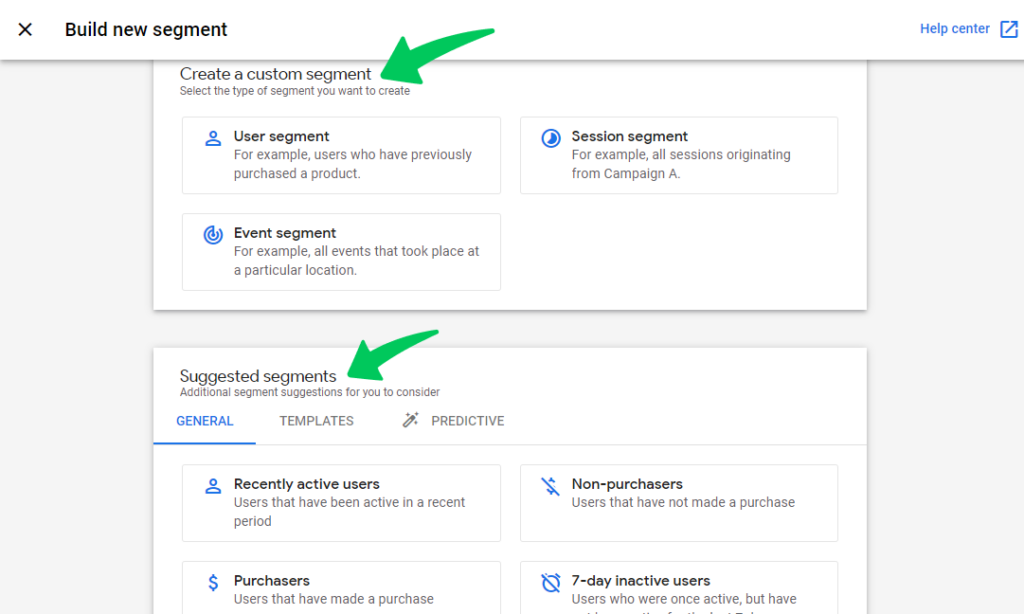
However, by clicking on the plus sign + next to Segments, you can create your custom segments or also use a suggested one, as shown in the screenshot below.
Understanding Custom Segments
There are 3 types of custom segments, i.e., User, Session, and Event.
User Segment: This lets you include information about all users who meet certain standards.
For instance, if a business wants to focus on its US users, it can make a segment that shows all of the events of its US users. It could be anything from how much they looked at a certain product page to whether or not they made a buy. It can help you figure out how US users act in particular. It lets you focus on a certain group of people.
Session Segment: This type of segment lets you add information about events that meet certain criteria. For example, if you run an online education site and just released an ebook, you can make a segment showing all sessions where visitors downloaded the ebook. This information can tell you a lot about how well the ebook launch went, how well your marketing plans are working, and so on.
Event Segment: It lets you include only events that meet specific criteria. Let’s say you’re a marketer at a B2B company, and you want to figure out how well your plan for getting leads is working. You could make an event section that shows all ‘lead_generated’ marked events. This could include a person filling out a contact form, signing up for a webinar, or downloading a whitepaper. This information can give a more detailed picture of what specific actions lead to new leads and help marketing tactics be more effective.
Step 5: Dimensions
These are attributes of your data. For example, the city from where the website was accessed can be a dimension.
You must first put the dimension in the Variables column if you want to use a dimension in Funnel exploration.
You can also add custom dimensions by clicking on the plus button +.
Let’s move toward Tab Settings.
Tab Settings
In this section, you can change the visual appearance of the report.
Let’s move towards our next steps in the Tab settings column.
Step 6: Exploration Technique and Visualization
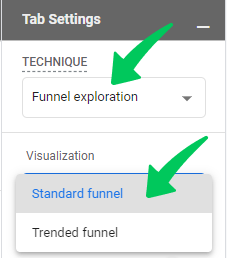
Select Funnel Exploration under the Technique heading because we are doing Funnel Exploration.
Next, you’ll see the Visualization box. You’ll choose the funnel visualization appearance, i.e., Standard Funnel or Trended Funnel.
1. Standard Funnel
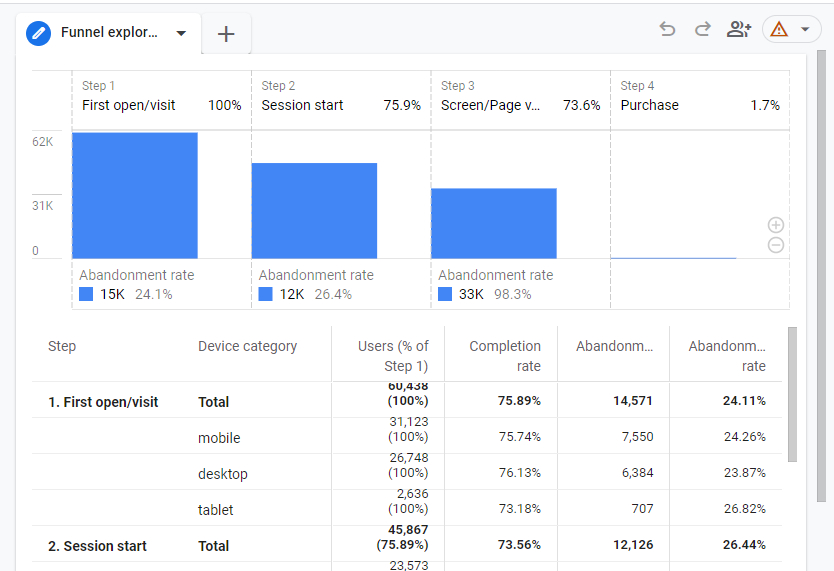
It’s a classic visualization that shows users’ movement through a sequence of events in the form of bar charts, as shown in the screenshot below.
The funnel shows the number (or percentage) of users who move from one step to the next, helping you find the biggest drop-offs.
2. Trended Funnel
A Trended Funnel, on the other hand, shows the same funnel data over time. It shows how user behavior and funnel performance have changed over a certain period of time. This view can help you find trends and patterns and see how changes to your site or marketing efforts have affected them.
It shows results as line graphs, as shown in the screenshot below.
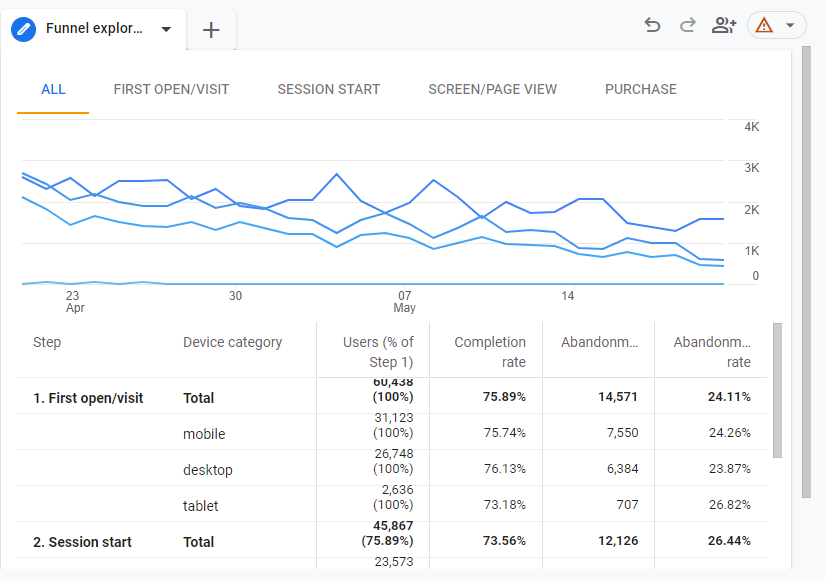
If comparing both funnels, a Standard Funnel is helpful when you want to see the general progression and drop-off points in your conversion path, while a Trended Funnel shows you how this progression changes over time. Both are important if you want to track and improve how people use your site.
Step 7: Open Funnel
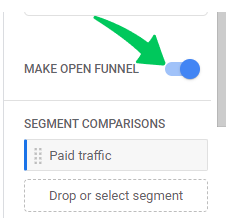
Funnels are closed by default. It means a visitor who joins the funnel at the second step or later won’t be counted.
Making an Open Funnel is a good idea because it will track all visitors regardless of whether they join the funnel at any step.
Step 8: Add the Steps
You need to add events to your website’s user journey in these steps.
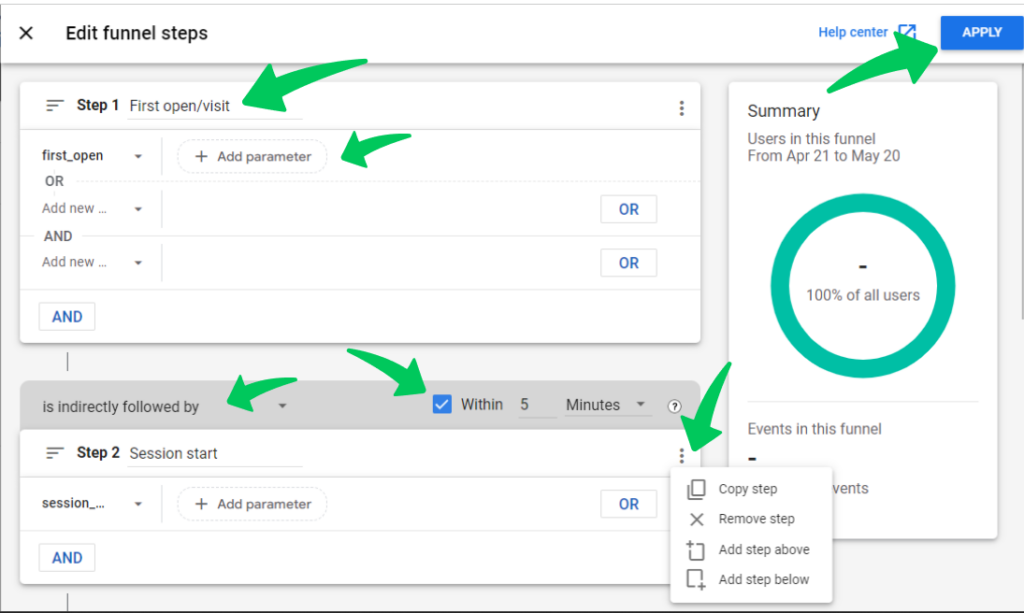
Click Add steps. You’ll probably see predefined steps, as shown in the screenshot below. You can edit these steps by clicking the edit icon next to STEPS.

- You can add the Events parameters by clicking Add parameter into each step according to your product and web design.
- You can choose whether you want this step to follow the last step directly or indirectly.
- You can also choose how much time can pass between the two steps. For instance, Within 5 minutes, as shown in the screenshot below.
- There are also a few more options for your convenience in the top-right part of each step. So that you can Copy any step, Remove any step, and even Add any step without disturbing the other steps.
- Define all steps one by one, adding Event parameters. Then click on the Apply button at the top right corner.
Look at the screenshot below to follow these changes.
Step 9: Apply Breakdown and Dimension Rows
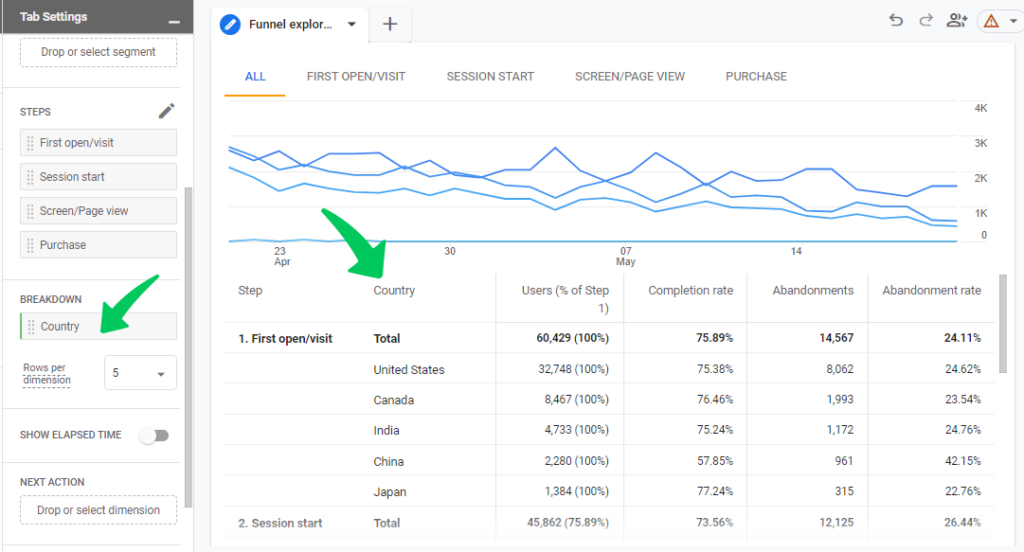
You can select the Dimensions we set in Step 5 to breakdown the report by any dimension, i.e., event, device category, gender, country, etc. You can select or drag and drop the dimensions. Let’s assume you choose Country as a dimension. You’ll see the list of countries from where the user activities originated.
If there are more than a few possible values for a dimension, you can choose how many Rows per dimension to show, i.e., 5, 10, or 15.
Look at the screenshot below to see the countries’ rows from where the use sessions happened.
Step 10: Turn on the Show Elapsed Time Button
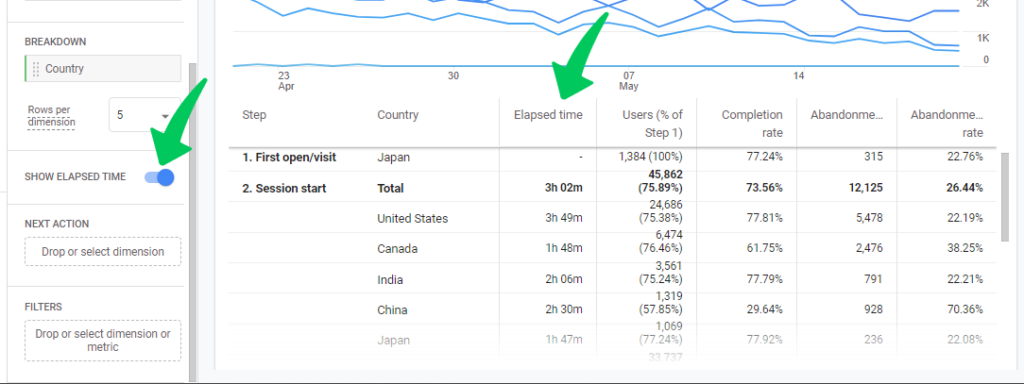
Turn on the Show Elapsed Time to see how long, on average, it takes your users to move from one step to the next.
Look at the screenshot below to see how it will appear in your Funnel report.
Step 11: Apply the Next Action
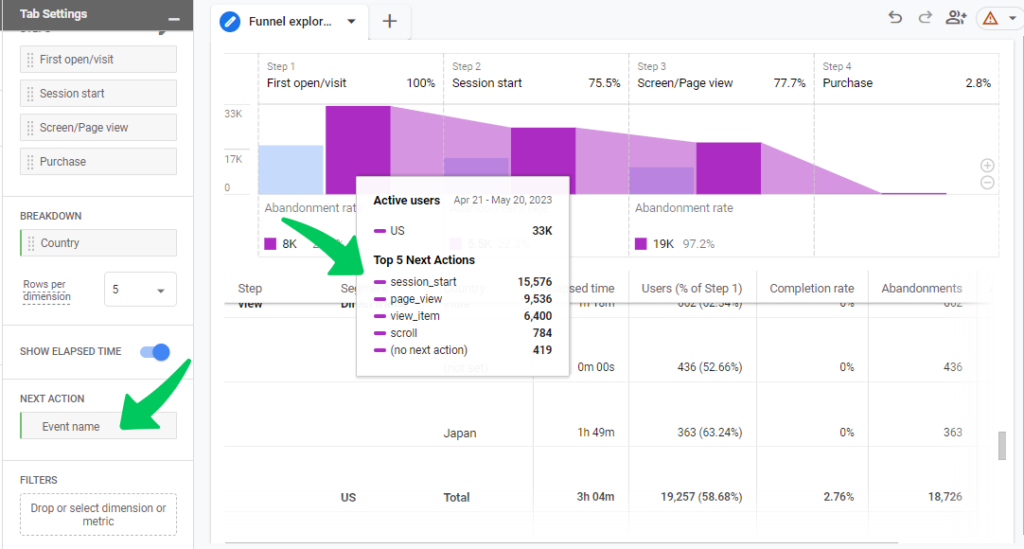
If you want to know what else a person does after taking a particular step? Put the Event name in the section called NEXT ACTION.
Note: Next action filter only takes Event Name or Pages/Screen Dimension.
To see the result, you need to click on the graph bar of any step and see the details of the Top 5 Next Actions.
You’ll have predefined steps, as shown in the screenshot below, but you can edit or delete any step according to your own product and website.
Step 12: Apply Filters
You can also apply filters based on different dimensions and measures. These filters help you get the funnel data to smaller groups that meet your needs.
For example, you can set up filters to only include people from a certain area, block traffic from specific sources, or focus on a particular type of device. Using filters lets you learn more about the actions and behaviors of different people visiting your website.
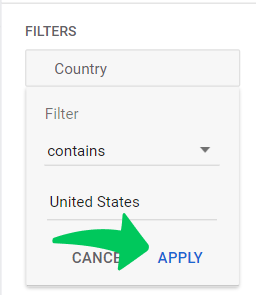
Let’s apply the country as a dimension containing only the United States. It means it’ll show data only coming from the United States. Look at the screenshot below.
You’re all set now to explore your Funnel exploration report.
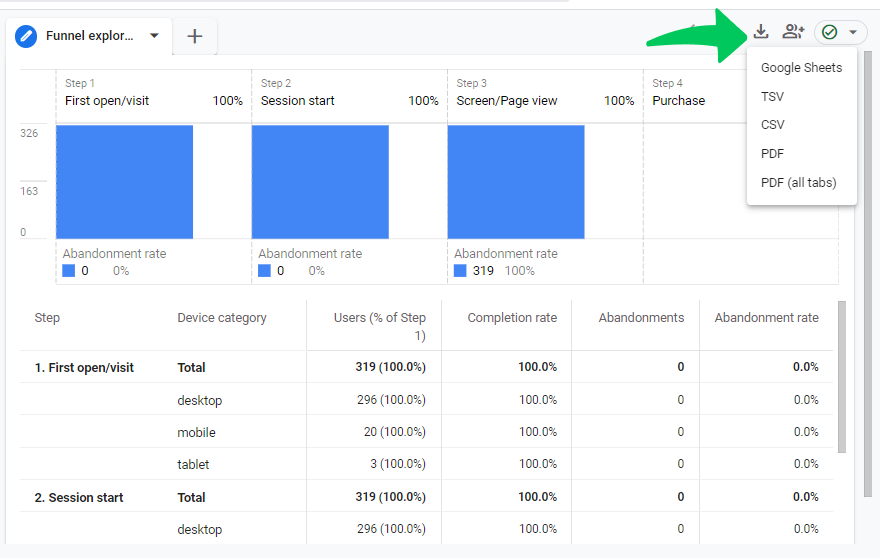
Step 13: Explore and Export the GA4 Funnel Exploration Report
You can study the Google Analytics funnel report in detail, considering the conversion, completion, and abandonment rate. It’ll also help you figure out your marketing campaigns’ impact.
You can download this report into the suitable format by clicking at the top right corner of the Funnel exploration report, as shown in the above screenshot.
That’s all! You’ve successfully explored all the features of GA4 Funnel exploration.
GA4 Funnel Exploration FAQs
What is GA4 Ecommerce Funnel?
A GA4 ecommerce funnel depicts the user journey from visiting your website to purchasing. In an ecommerce setting, it is a critical tool for understanding customer behavior and optimizing conversions.
Why do we need GA4 funnel tracking?
Funnel tracking allows you to visualize and comprehend the steps a user takes on your website to achieve a goal. It assists in identifying areas for improvement in the user journey to improve conversion rates.
Can I change the funnel steps after I’ve created it in GA4?
Yes, GA4 allows you to change your funnel steps. Even after the funnel has been constructed, you can add, remove, or reorder steps.
How can I improve funnel tracking with custom events?
You may track individual user activities with your website using custom events. It provides more depth to your funnel tracking, making it more precise and insightful.
How can I enhance conversions using data from GA4’s funnel report?
The funnel report in GA4 reveals where users are abandoning the conversion process. Increase conversions by identifying these areas and making targeted improvements. For example, if there is a significant drop-off rate during the checkout stage, you may need to simplify the checkout process or provide more clarity around pricing.
Conclusion
Funnel tracking is a cornerstone of effective website analytics. With GA4 Funnel Exploration, you’re equipped with a dynamic tool that offers unparalleled insights into your users’ journey. By understanding where users drop off or engage the most, you can optimize your site to enhance conversions and overall user experience.
You should also learn about the Most Important Google Analytics Metrics.
We love hearing from our readers! If you’ve tried GA4 Funnel Exploration or have any questions, please share your experiences or queries in the comment section below. Your feedback helps us deliver better content tailored to your needs.


