How to View GA4 Hourly Traffic Report

You view the GA4 hourly traffic report in Explorations. Add the Hour dimension to a free-form report or a line chart. Hourly data shows your peak visit times. You can then schedule posts, emails, and promotions when visitors are most active.
For a complete walkthrough, see our guide: How to Set Up Google Analytics 4 and Connect it to Your WordPress Site?.
This guide is helpful for website owners, digital marketers, and anyone looking to learn about their website’s traffic patterns. You can identify peak times, analyze user behavior, and optimize your content by tracking hourly traffic.
The steps below use GA4 Explorations, then show how to monitor hourly traffic automatically.
Celebrate this BFCM season with a special offer! Get 40% OFF on all Analytify premium plans by using the coupon code BFCM40 at checkout.
GA4 Hourly Traffic Report (TOC):
What is Google Analytics 4 Hourly Traffic Report?
The GA4 hourly traffic report lets you monitor and analyze the flow of website visitors by the hour. This report shows when users are most active on a site. It shows traffic patterns across different hours of the day.
Understand these hourly trends. You can then optimize your content, marketing, and resource allocation to match peak traffic times. This will ultimately improve user engagement and conversion rates.
Why is Google Analytics Hourly Traffic Report Necessary?
The hourly traffic report shows when your visitors are most active, so you can time content and campaigns to match. By tracking Google Analytics traffic by hour, you can:
- Hourly Data Overview: See how your website performs hour by hour, so you can adjust marketing strategies quickly.
- Identify Peak Traffic Times: Determine the busiest hours of your website to optimize content scheduling and promotional activities.
- Analyze User Behavior: This helps you understand how users interact with your website at different times of the day. You can then improve user experience.
- Optimize Marketing Campaigns: These hourly reports help tailor your marketing efforts to reach your target audience at optimal times.
- Monitor Website Performance: Track changes in traffic patterns over time to identify trends and potential issues.
- Modify Your Strategy: Utilize hourly traffic data to decide on resource allocation, content creation, and marketing efforts.
When analyzing detailed GA4 reports, you often need to segment your data beyond the primary dimension. GA4 secondary dimensions add a layer of segmentation. You can drill down into specific data points. You also uncover more nuanced insights about user behavior and traffic patterns.
How to View Website Traffic Hourly in GA4?
Now that we understand the importance of tracking traffic by hour in Google Analytics 4, let’s see how to access and analyze this data. Follow the steps outlined in two methods for viewing the GA4 hourly traffic report:
Method 1: Using GA4 Exploration Report
- Open GA4 and click the “Explore” tab below the Reports section.
- Start a new blank report.
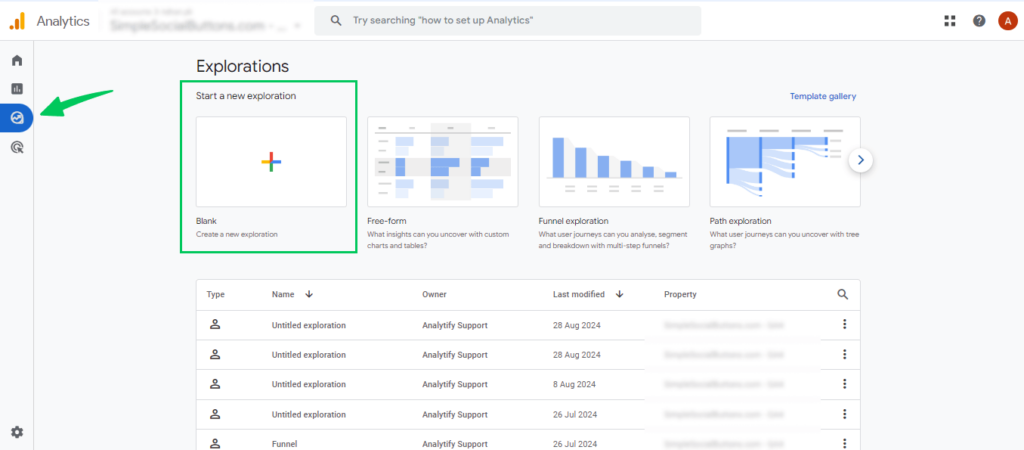
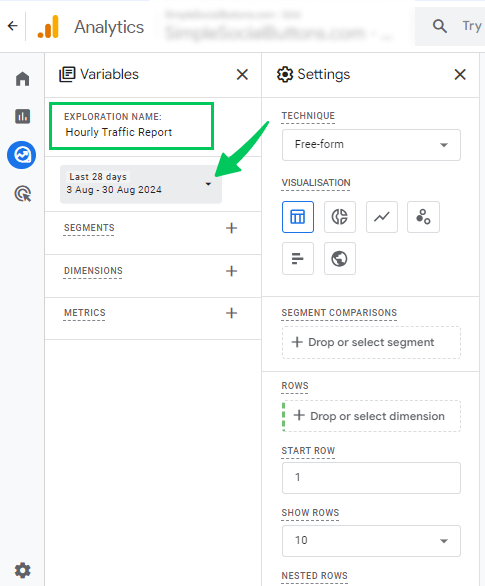
- Name the exploration report.
- Adjust the time period to the desired timeframe.
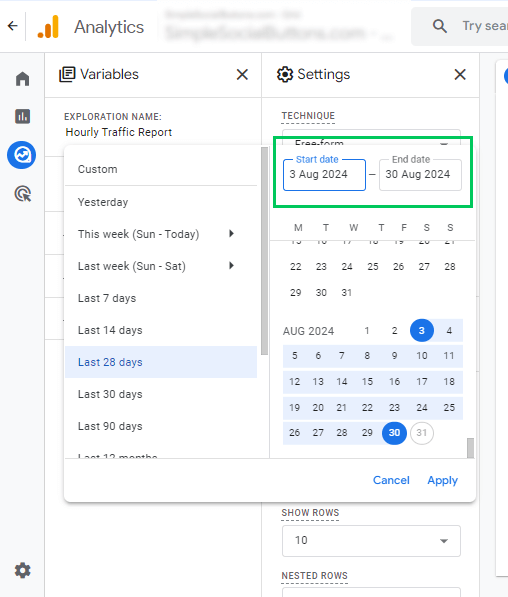
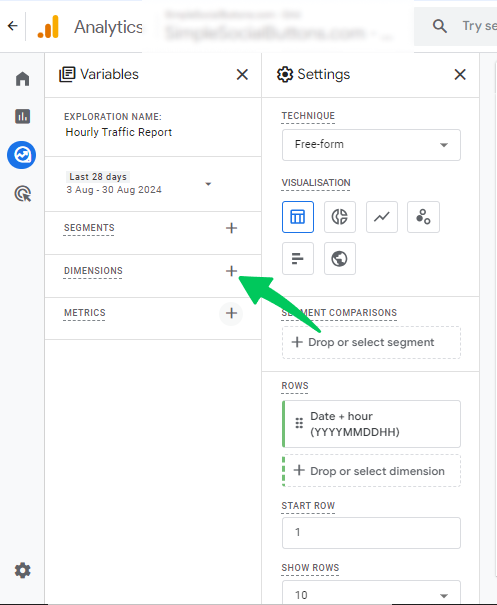
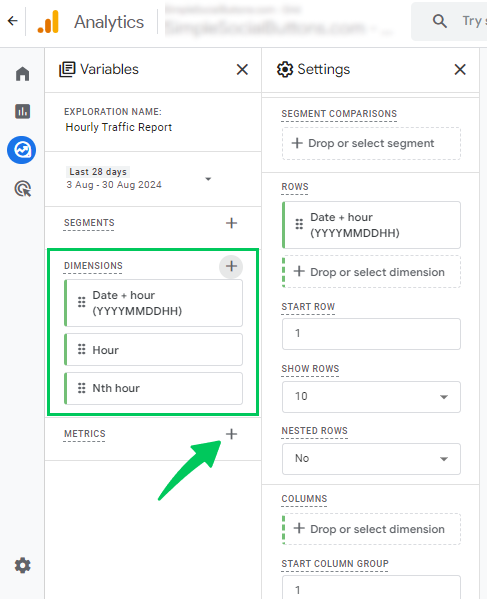
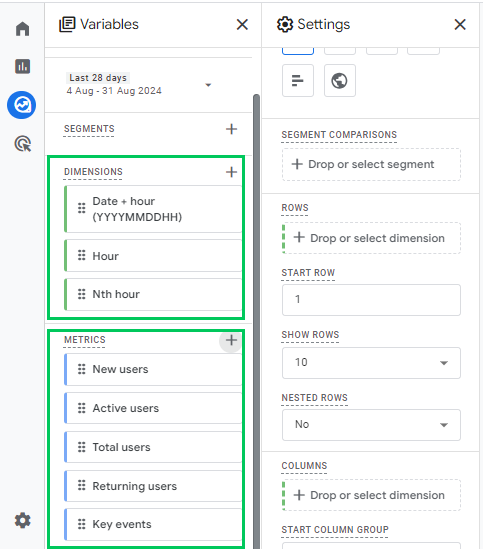
- Click the “+” sign in front of the Dimensions tab. Select Date + Hour, Hour, Date, and Nth hour to import them.
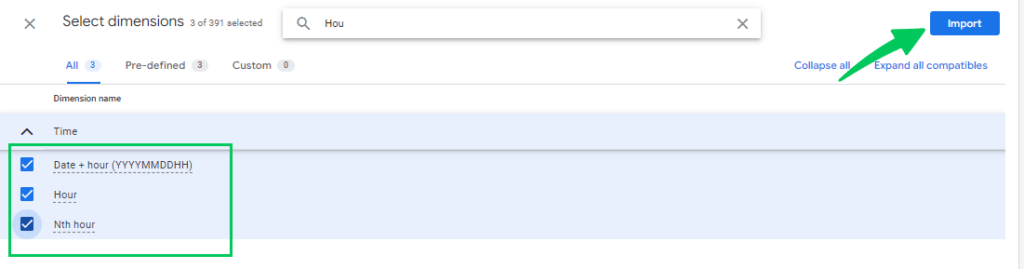
- Click the “+” sign in front of the metrics tab. Select micro-conversion metrics such as New users, Total users, Active users, Returning users, key events, Transactions, and E-commerce purchases. Import them.
- Add “Date + Hour” to the “Rows.”
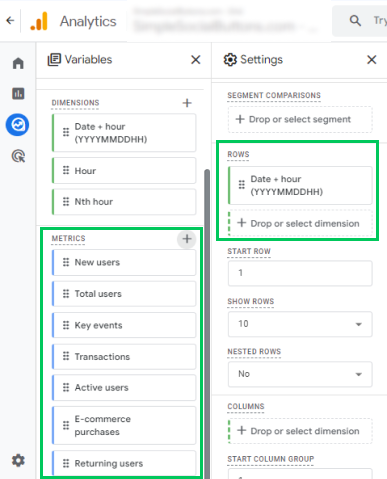
- Add all metrics to the “Values” section.
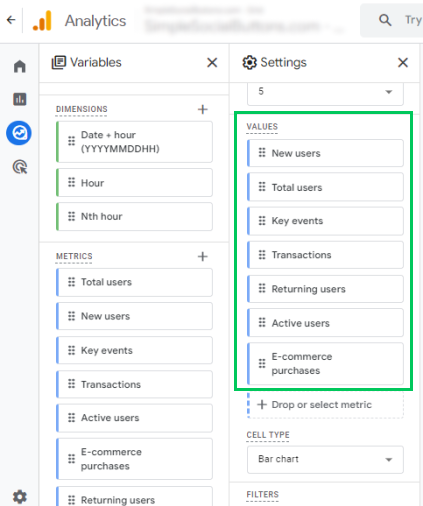
- If you followed all the steps correctly, you should receive a report like the one below.
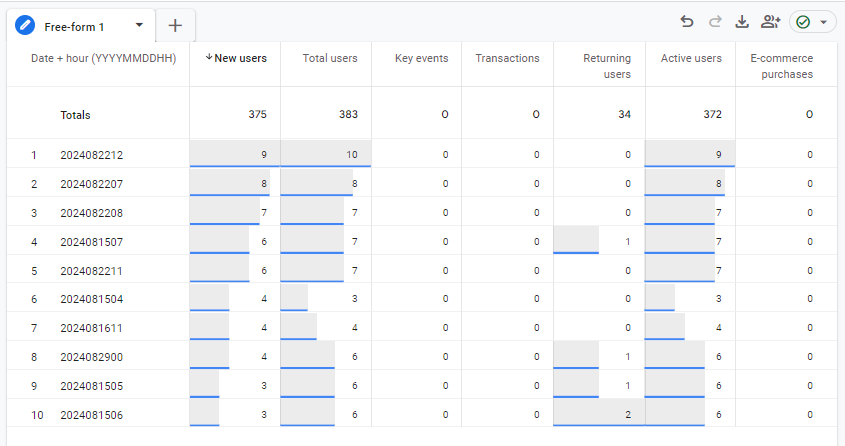
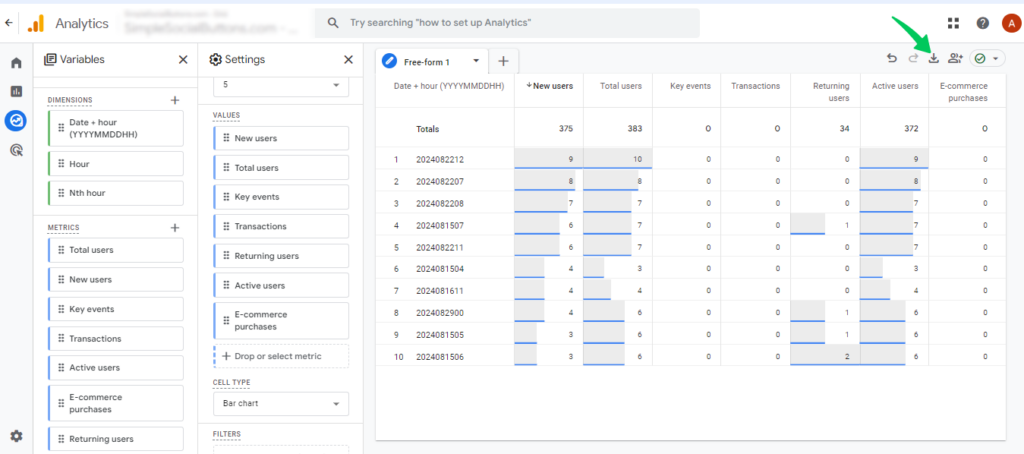
Note: Google Analytics 4 cannot apply an average to your variables; it can only sum your metric statistics. Therefore, we use “Date + Hour,” not “Hour” dimensions. If you want the average traffic amount, click the “Export” data button at the top right corner. Export the data into Google Sheets, where you can aggregate it appropriately.
Method 2: Using Line Chart Visualization in Explorations
- Open GA4 and go to the GA4 Explore section.
- Click on the blank canvas to start a new report.
- Add a name for this exploration report.
- Adjust the time period to the desired timeframe.
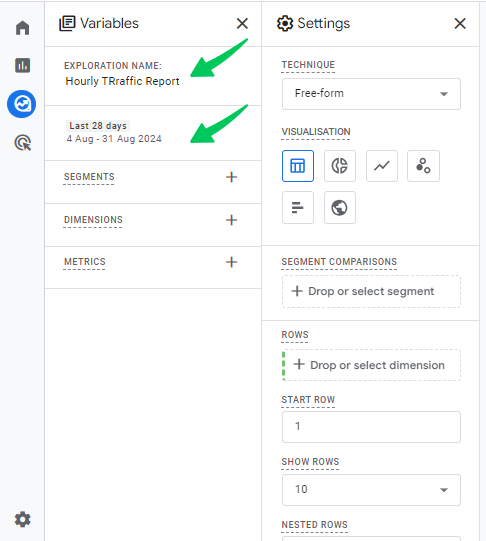
- Add dimensions like date + hour, hour, date, and nth hour.
- Select the metric you want to see (e.g., New users, Total users, Active users, Returning users, key events).
- Select the “Line chart” visualization.
- Choose “Hour” granularity.
- Select the value you want to add, like new users added here.
- You should receive a report similar to the one in the screenshot below.
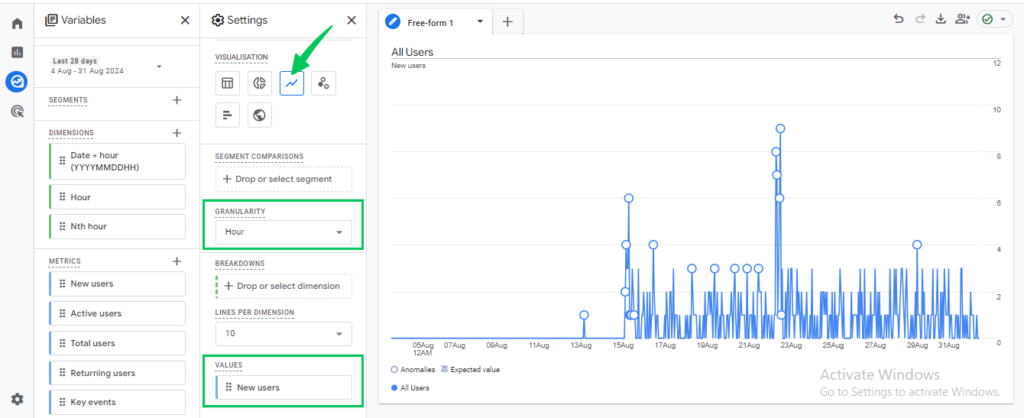
Note: This method can only show one metric at a time.
Your GA4 hourly traffic report gives you a real-time pulse on your website. For deeper dives, custom reporting, or merging data with other tools, you’ll want to export Google Analytics data. This skill lets you run advanced analysis and uncover richer insights. You can also build custom dashboards that the standard GA4 interface can’t provide. Make your data work harder for you!
How to Monitor Hourly Website Traffic Automatically in Google Analytics 4?
You can create a custom alert to monitor hourly website traffic automatically in Google Analytics 4. During alert configuration, you must set the evaluation frequency hourly. This is a highly efficient solution. You’ll receive real-time updates every hour on traffic fluctuations. You can react quickly to any significant change in user activity.
Here’s a simplified guide to creating an alert for hourly traffic reports:
- Log in to your Google Analytics 4 account.
- Click on the “Home“ tab.
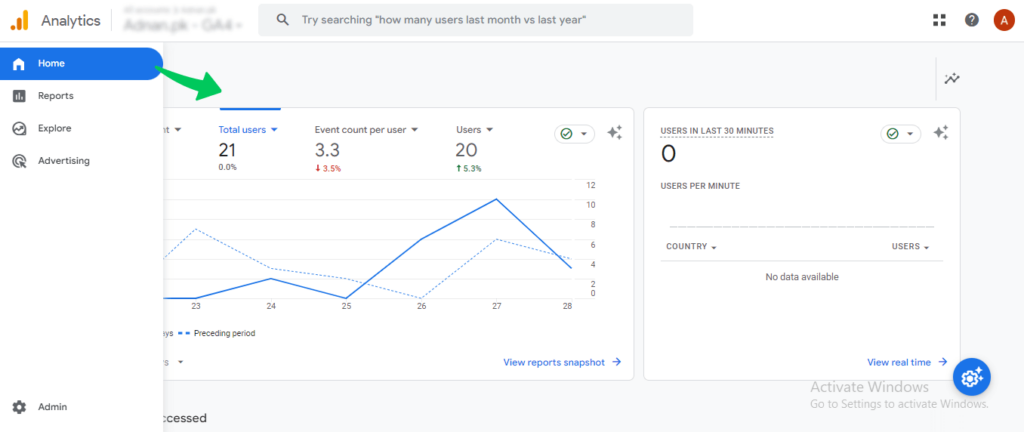
- Scroll down the home page and Click on View all insights.
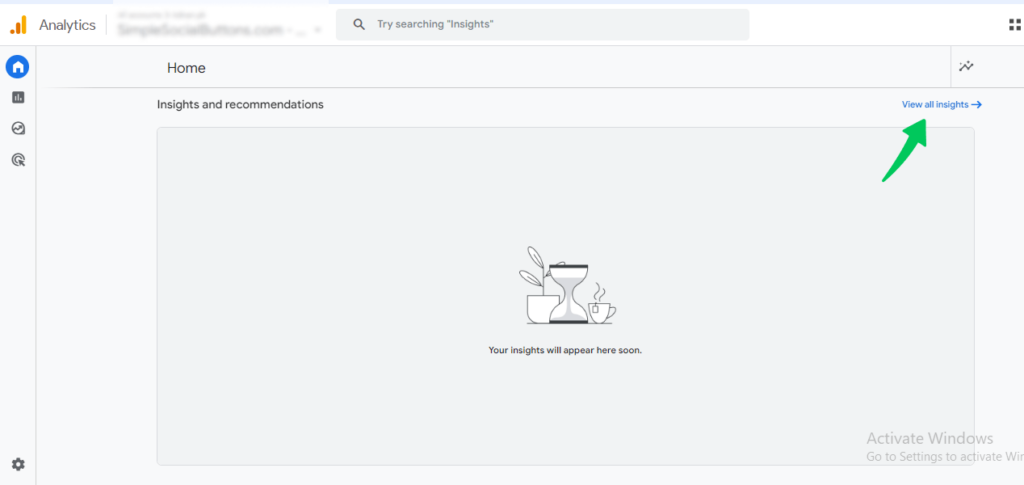
- Choose the “Create” tab.
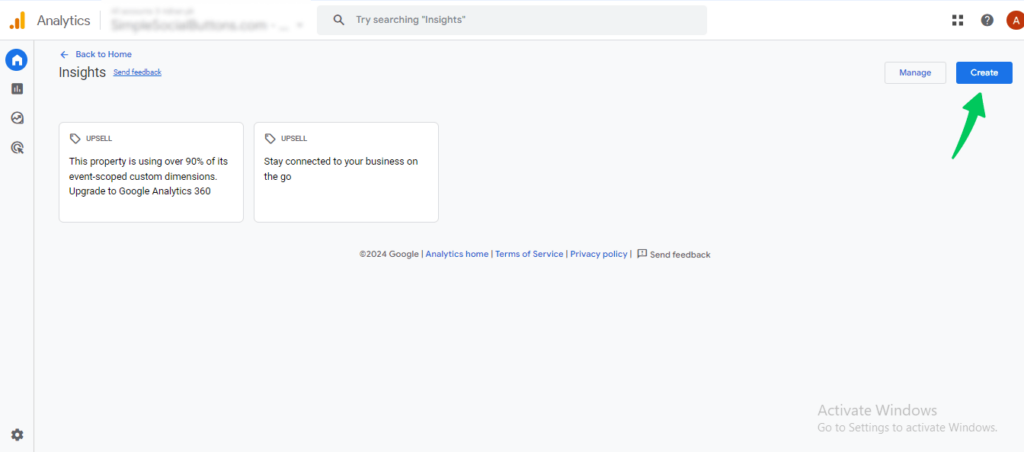
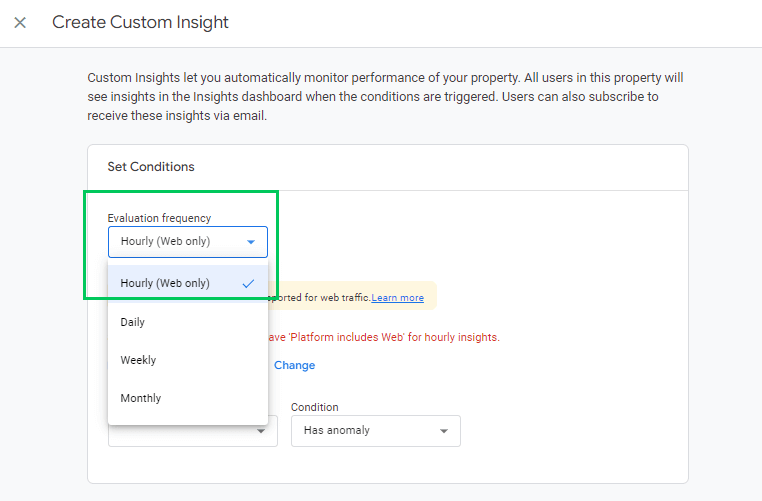
- Evaluation frequency: Choose the evaluation frequency of “Hourly.”
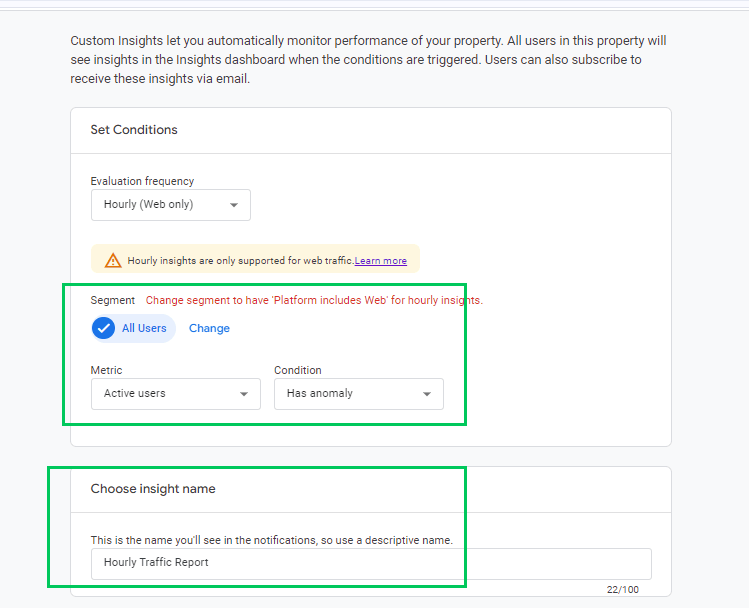
- Segment: Choose a segment according to your requirements.
- Metric: Select the metric you want to track (e.g., Users, Sessions, Bounce rate).
- Condition: Choose how you want the metric to change (e.g., has an anomaly).
- Alert Name: Choose a descriptive name that reflects what the alert is monitoring (e.g., “Hourly website Traffic”).
PRO Tip: “Keep clear, standardized naming conventions in GA4 and Google Tag Manager. They can significantly improve your data analytics.“
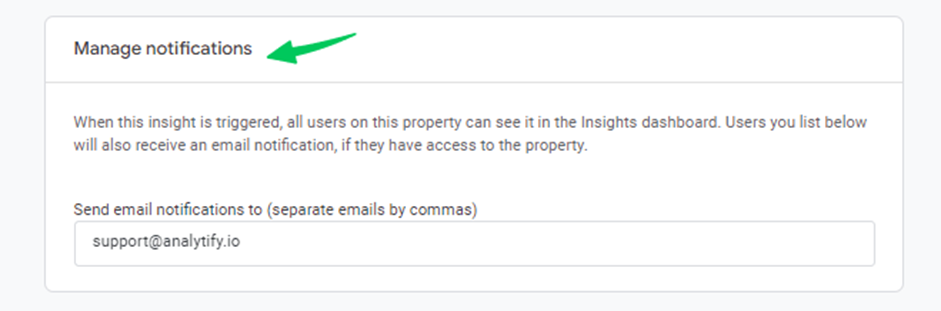
- Manage notifications: By default, all users on the property see triggered custom insights on the Insights dashboard. To also receive email alerts, enter the email addresses that should be notified.
- Once you’ve configured everything, click the Create button to save your new custom alert.

Congratulations! You’ve successfully created a GA4 Custom Alert to check hourly traffic in Google Analytics.
You will get regular website traffic updates without manual checks. This helps you track campaign performance, identify traffic spikes, and detect sudden drops in visits. For detailed guidance on creating, editing, and deleting custom alerts, visit this guide: How to create GA4 Custom Alerts.
Analyzing hourly traffic reports in GA4 provides valuable insights into user behavior. For even more granular control over your data, you can create custom metrics. They let you track specific business metrics.
Enhance GA4 Hourly Traffic Reports with Analytify
Analytify is a WordPress analytics plugin that integrates with Google Analytics 4 (GA4). It simplifies tracking your website’s data. GA4 provides in-depth analytics, including traffic by hour. Analytify enhances this with an intuitive dashboard directly within your WordPress site.
Join 50,000+ beginners & professionals who use Analytify to simplify their Google Analytics!
Analytify, a Google Analytics plugin for WordPress, lets you generate easy-to-read reports without heavy customization. It shows hourly traffic details at a glance.
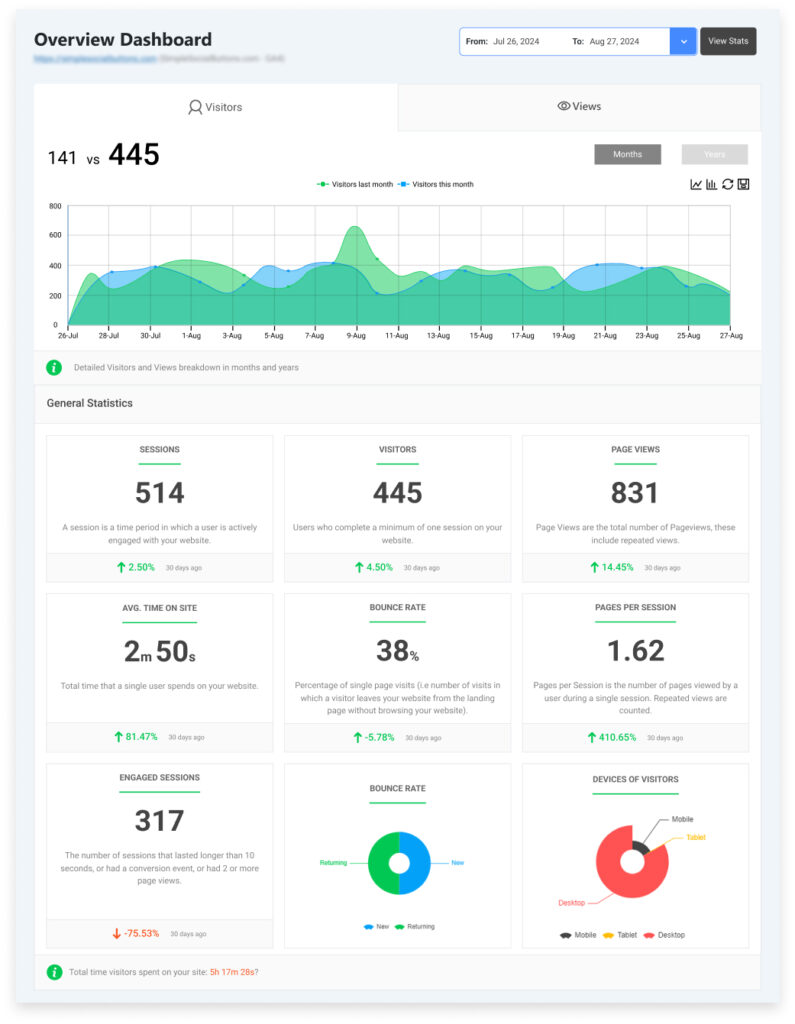
Here are the features of Analytify associated with hourly traffic reports:
- Real-Time Traffic Overview: Analytify provides real-time analytics that show hourly website traffic directly on your WordPress dashboard. You get quick details without navigating GA4.
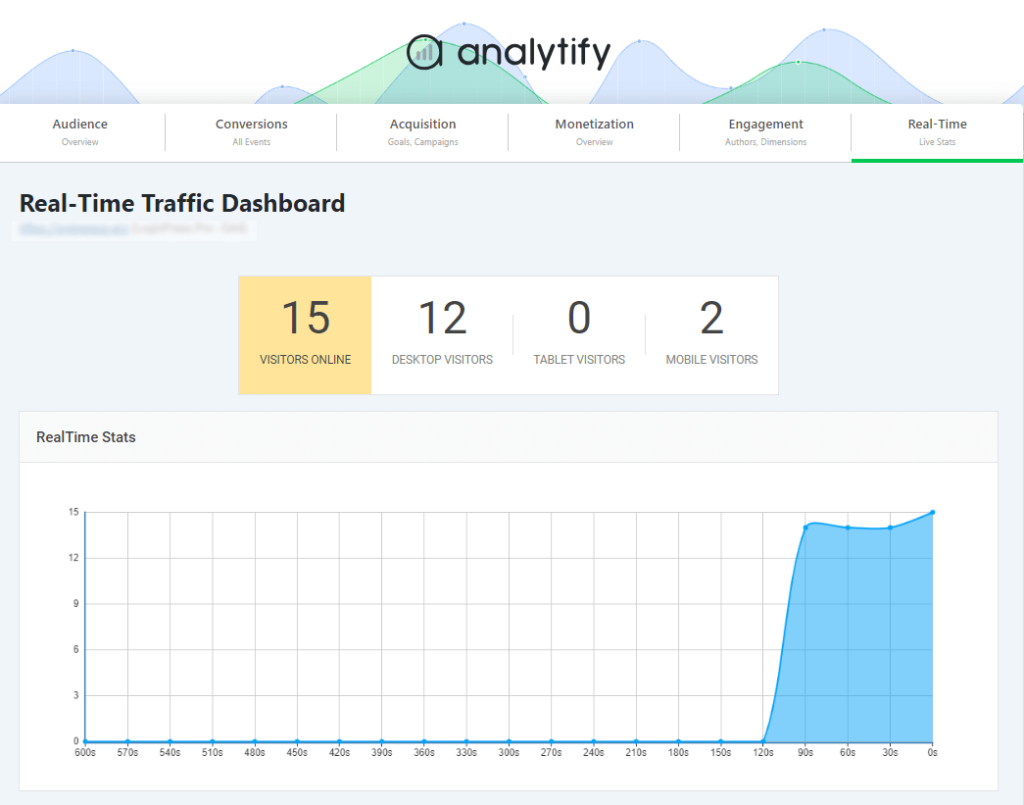
- Simplified Data Presentation: You skip multiple steps in GA4. Analytify provides a more straightforward view of important metrics. This includes traffic trends by various timeframes, all from your WordPress dashboard.
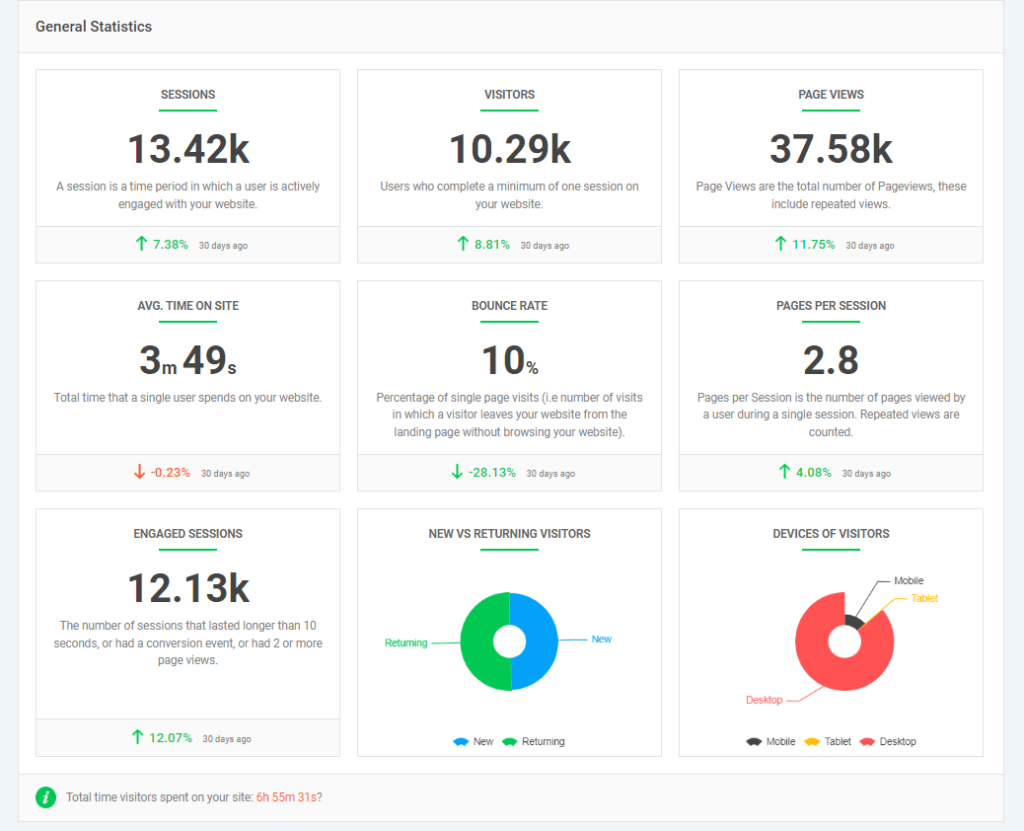
- User Engagement: Track user interactions on your website, such as page views and session duration. This data helps optimize engagement.
- Customizable Reports: Analytify lets you generate and customize traffic reports. Track key metrics like bounce rates, session counts, and conversions at specific times.
- Notification and Alerts: You can set up alerts within Analytify. They notify you when traffic patterns change significantly, especially during critical hours. Analytify offers a compelling alternative to GA4 Custom Alerts. With Email Notifications Addon (available in Analytify PRO), you can set up automated reports delivered straight to your inbox.
These features streamline monitoring hourly traffic directly from WordPress. You track trends without navigating GA4’s detailed interface.
GA4 Hourly Traffic Report FAQs
1. Can I see traffic by hour in Google Analytics 4?
Customizing reports in the Explore section lets you view traffic by hour in Google Analytics 4 (GA4).
2. How can I customize the hourly traffic report in GA4?
In Google Analytics 4, you can customize your hourly traffic report by creating an Explore report and selecting Hour as a dimension. This allows you to filter and compare traffic across different time periods, giving you greater control over how you view and analyze your data.
3. How is hourly traffic data useful in Google Analytics 4?
Viewing hourly traffic data is useful for identifying peak activity times, optimizing your content schedule, and analyzing user behavior throughout the day. It can also help you adjust marketing campaigns or server loads during high-traffic periods.
4. Can I set up alerts for hourly traffic in GA4?
Yes. Create a custom insight and set the evaluation frequency to Hourly. Hourly evaluation is available only for web data. GA4 then notifies you when a metric changes sharply within the hour.
5. How can I analyze traffic by an hour in the GA4 real-time report?
The GA4 Realtime report shows activity from the last 30 minutes. It does not store past hourly data. For hourly history, use an Exploration with the Hour dimension.
Final Thoughts: Google Analytics Traffic by Hour
Understanding the GA4 hourly traffic report is essential for optimizing your website’s performance and user engagement. Analyzing Google Analytics traffic by hour can pinpoint when visitors are most active. That allows better content scheduling and marketing strategies. This report helps to track Google Analytics hourly traffic accurately, revealing peak and low-traffic periods. This information lets you adjust your approach to meet user needs and refine your strategy.
To view website traffic hourly in GA4, use the Exploration reports or line chart visualizations to analyze patterns. Analytify further simplifies this process. It provides a straightforward interface within WordPress, so you can manage and review hourly traffic data. Compare every Google Analytics plugin for WordPress if you want hourly reports without opening GA4.
For further insights, check out our dedicated articles on How to Use Google Analytics Email Reports and Traffic Acquisition Report GA4. These resources provide additional guidance on managing and using your Google Analytics data.
We’d love to hear your thoughts! Please comment below if you have any questions or need further clarification on using GA4 for tracking hourly traffic.