10+ Crucial Ecommerce Metrics to Track in GA4 (2025)
Have you ever wondered how to ensure your online store meets its full potential?
It’s no secret that the key to unlocking the success of any ecommerce business lies in understanding and monitoring the right metrics. Ecommerce metrics play a vital role in gauging your online business’s growth and identifying improvement areas.
Google Analytics 4 offers a lot of metrics. With GA4 ecommerce metrics, it has become even more feasible to keep an eye on key ecommerce metrics and optimize your ecommerce performance.
So, which are the top ecommerce metrics to track in GA4 this year? Let’s discuss this in detail.
In this article:
What are Ecommerce metrics and KPIs?
Ecommerce analytics metrics and KPIs (Key Performance Indicators) are quantifiable measures used by ecommerce businesses to evaluate and track their performance over time. These metrics provide a numerical report of various aspects of an online store’s operations.
Understanding eCommerce metrics is very important. Running an ecommerce store without monitoring its ecommerce analytics metrics is like driving a car with your eyes closed. You wouldn’t know if you’re heading in the right direction or about to crash. In the ecommerce world, this could mean lost sales, decreased customer satisfaction, or even business failure.
By understanding GA4 ecommerce metrics, you can make informed decisions. These metrics shed light on consumer behavior, sales performance, marketing effectiveness, and much more. Keeping an eye on top ecommerce metrics will highlight areas of improvement and offer insights into strategies that are working best, ensuring you sustained growth and profitability.
So, understanding ecommerce metrics and KPIs is like having a roadmap. It guides your ecommerce journey, ensuring you’re on the right path to success. And with the rise of powerful Google analytics tools like Analytify, tracking and optimizing your online store has never been easier.
How to Enable GA4 Enhanced Ecommerce Tracking in WordPress
For those with a WordPress website, there’s a seamless way to integrate GA4 into your website. Meet Analytify, your one-stop solution for connecting GA4 to WordPress with ease.
To enable enhanced ecommerce tracking, follow these steps:
- Install and Activate Analytify:
Start by installing the Analytify plugin from the WordPress repository or the Analytify official website.
- Connect with GA4:
Once you’ve installed Analytify, navigate to the Analytify dashboard on your WordPress backend. Here, you’ll find an option to connect Analytify with GA4.
3. Enable Ecommerce Tracking:
Enabling eCommerce tracking will allow you to gather all those essential ecommerce performance metrics from your WordPress dashboard.
Read our complete guide on How to Enable eCommerce Tracking.
By integrating GA4 with your WordPress through Analytify, you don’t just enable ecommerce tracking; you open the doors to a plethora of data that can revolutionize your online store’s performance. Everything from visitor insights to sales trends will be at your fingertips, ensuring that concrete data always backs your business decisions.
10 Key Ecommerce Metrics You Must Track
Whether you’re using Google Analytics or a dedicated WordPress plugin like Analytify, there are certain key ecommerce metrics you need to pay attention to. Let’s go deep into these crucial metrics and understand why they’re important, how to track them with GA4, and the added advantages you’ll experience with Analytify.
1. Conversion Rate
The Conversion Rate is the percentage of website visitors who take a desired action, such as making a purchase or completing a specific goal, out of the total number of visitors. In ecommerce, it’s typically associated with the percentage of visitors who turn into paying customers.
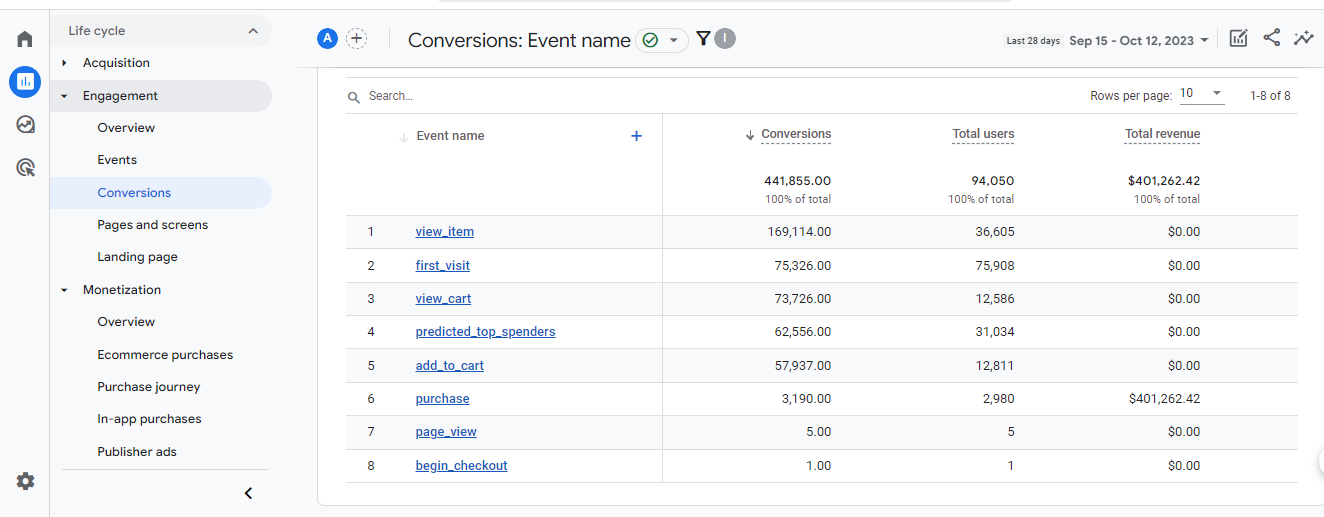
In GA4, you can see Conversions by navigating to Reports>>Engagement>>Conversions.
ConversionRate = (Number of Conversions/Total Number of Visitors) x 100
You can see the Conversions and Total users columns to calculate the User conversion rate.
Why is it important to Track Conversion Rate?
This metric indicates your site’s efficacy in turning visitors into customers. A low conversion rate could hint at issues with user experience or product pricing.
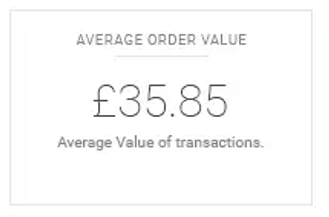
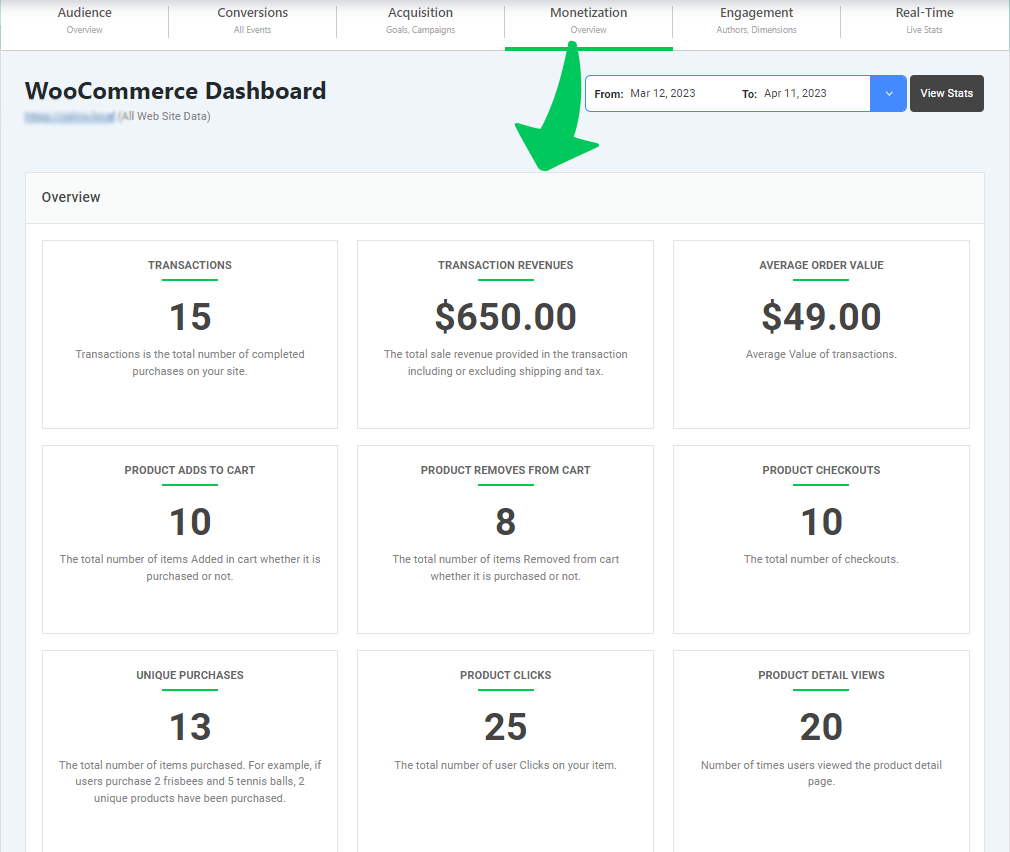
2. Average Order Value (AOV)
Average Order Value reflects the average amount spent when a customer buys your products.
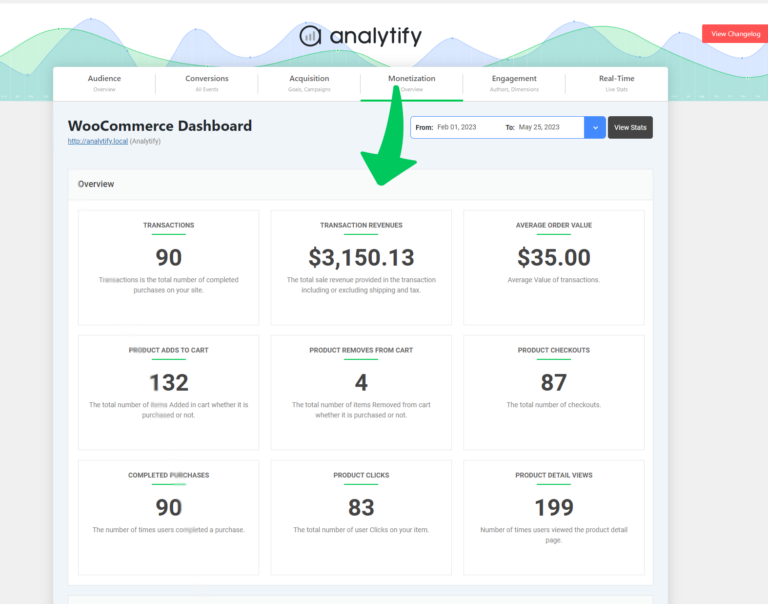
In GA4, navigate to Reports>>Monetization>>Overview, and you will see Average purchase revenue per user, as shown in the screenshot below:

Analytify’s seamless integration with WordPress makes this data instantly accessible from your WP backend.
Why is it important to track AOV?
AOV provides insights into customer spending habits, helping tailor product promotions and pricing factors effectively.
3. Cart Abandonment Rate
Cart abandonment rate is the percentage of visitors who added items to their cart but did not complete the purchase. This metric provides insights into potential obstacles or issues in the checkout process.
You can spot this in GA4 by customizing your Explore reports through Funnel Exploration.

With Analytify, tracking this becomes more straightforward, you can check the number of products removed from the cart.
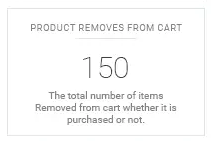
Why is it Important to track Abandonment Rate?
Pinpointing where customers drop off can help improve the checkout experience.
4. Ecommerce Revenue
Ecommerce revenue refers to the total amount of money your online store brings in before any expenses are deducted. It’s the gross income from transactions, not the net profit. This revenue is generated every time a customer completes a purchase on your website.
In GA4, navigate to the Reports>>Monetization>>Overview and look for Total Revenue to see a comprehensive breakdown of your sales over a specified period.

In Analytify, go to the Ecommerce section, and your Total Revenue is displayed front and center. With its user-friendly interface, Analytify makes it easy to understand your revenue streams at a glance.
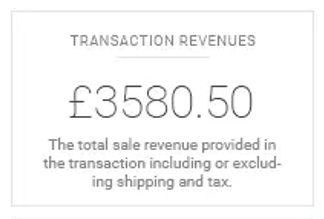
Why is it important to track Ecommerce Revenue?
It’s a direct indicator of your store’s success. A growing revenue is often a sign that your business strategies are working, and knowing your revenue can guide where and how much to reinvest in your business.
Moreover, it helps you benchmark your store’s performance against past periods or competitors.
5. Traffic Sources
Tracking traffic sources is important to discover where your visitors are coming from. A traffic source refers to the origin or place from where visitors arrive at a website. By identifying and analyzing traffic sources, you can understand where your audience is coming from, which in turn can provide valuable insights into the effectiveness of marketing strategies, audience behavior, and areas of potential opportunity or improvement.
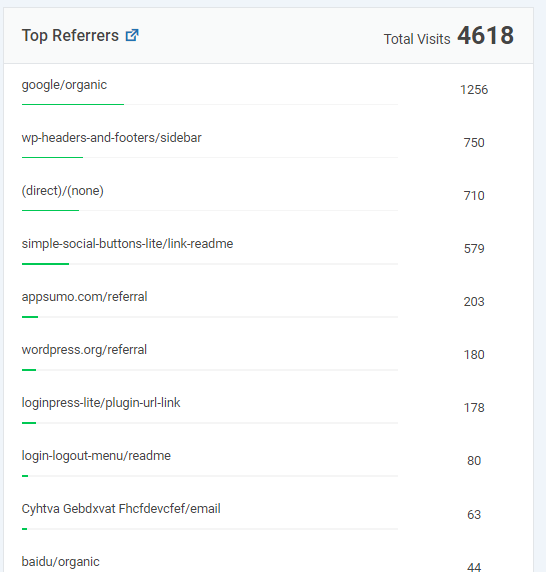
GA4 lists this under Reports>>Acquisition>>Source/Medium.

With Analytify, you can easily track your traffic sources. This way, you can quickly find out which marketing channels are most effective and deserve more investment.
Analytfiy’s geo insights are tailored to WordPress structures, making regional content targeting a breeze.
Why is it important to track traffic sources?
Knowing where your users are coming from allows you to understand their intent, preferences, and behavior on your website. For instance, users coming from a blog might be looking for information, while those coming from a paid ad might have more transactional intent.
Moreover, by tracking the sources of your traffic, you can assess which of your marketing channels are the most effective. If a particular campaign is driving a lot of high-quality traffic, you might consider allocating more resources to it.
6. Customer Retention Rate
While attracting new customers is essential, retaining them is where the real profitability lies. By understanding and optimizing your Customer Retention Rate, especially with tools like GA4 and Analytify, you can position your ecommerce store for sustained growth and long-term success.
Customer Retention Rate refers to the percentage of customers that continue to do business with you over a specific time frame compared to the number you had at the beginning of that period. It’s a metric that showcases your ability to keep your customers returning for more.
In GA4, select Reports Reports>>Life cycle collection>>Retention, and you will see Returning users, as shown in the screenshot below:

Why is it important to track Customer Retention Rate?
Retained customers often have a higher lifetime value than new customers. By understanding your retention rate, you can estimate the long-term value of your customers, which informs budgeting, marketing, and business strategies.
Moreover, the retention rate also tells you about user experience. A high retention rate suggests that customers are satisfied with your product or service. Similary, a declining retention rate may indicate issues with user experience, product quality, or customer service, signaling areas that might need attention.
7. User Purchase Journey
The User Purchase Journey, often referred to as the Customer Journey, is the series of steps a potential customer takes from their initial interaction with your brand to the final purchase. It’s like a roadmap that helps you understand how and why people buy from your online store.
Navigate to Reports >> Monetization>>User purchase journey. You will see an automatically generated funnel of all the steps of the purchase journey from session start to purchase, as shown in the screenshot below.

Why is the User Purchase Journey Important?
Tracking the journey provides insights into how customers interact with your brand, products, and marketing efforts. It allows you to identify bottlenecks or drop-off points in the journey, helping you optimize the conversion process. By knowing where customers are in their journey, you can tailor marketing content and offers for better engagement.
Moreover, it helps allocate marketing budgets more effectively by focusing on the most effective touchpoints.
8. Customer Lifetime Value (CLV)
Customer Lifetime Value is the average amount of money a customer is predicted to spend over their lifetime. CLV is available under User Lifetime in GA4.
Navigate to Explore>>User Lifetime:

You’ll see an automated generated report to check CLV as shown in the screenshot below:

Why is it Important to Track It?
Lifetime value helps in determining marketing spend and understanding customer loyalty.
9. Bounce Rate
Bounce rate is the percentage of visitors who navigate away after viewing only one page.
The bounce rate in Google Analytics 4 is the percentage of sessions that are less than 10 seconds long and have no conversion events.
In GA4, you can analyze the Bounce rate by checking the average session rate:

High bounce rates can indicate content, speed, or design issues.
Why is it important to track bounce rate?
Both bounce rate and Engaged Sessions provide insights into user engagement. By monitoring these metrics, you can assess whether users find your content relevant and engaging upon landing on your site.
A high bounce rate or low Engaged Sessions might indicate that your landing page isn’t capturing the attention of users. This could be due to poor content quality, irrelevance, or misleading marketing campaigns that don’t align with the landing page content.
Moreover, high bounce rates could also be a sign of technical issues, such as slow page load times, broken elements, or poor mobile responsiveness, leading users to leave before interacting further.
10. Items Added to Cart vs. Items Purchased
In ecommerce analytics, “Items Added to Cart” and “Items Purchased” are two essential ecommerce metrics that provide insights into your online store’s performance and customer behavior.
In GA4, you can track these metrics by navigating to Reports>>Monetization>>Ecommerce Purchases:
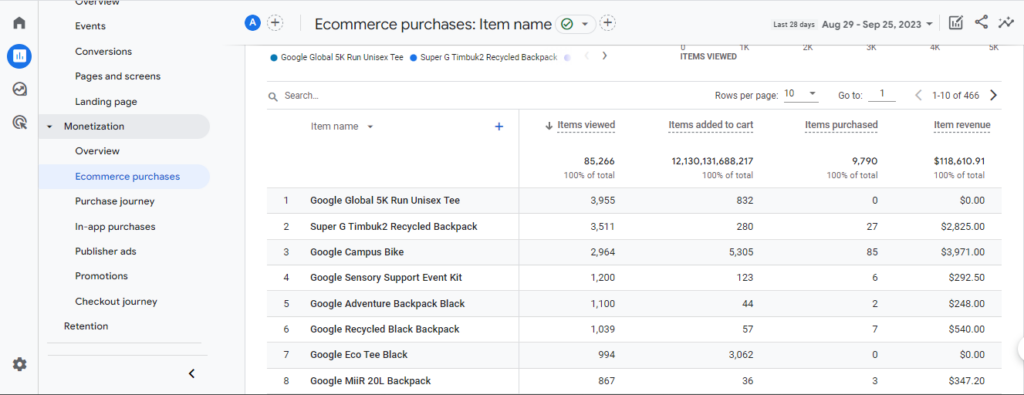
Why is it important to track these ecommerce metrics?
By tracking “Items Added to Cart” and “Items Purchased,” you can assess how efficiently your ecommerce website converts user interest into actual sales. A higher ratio of items purchased to items added to the cart indicates a more effective conversion process.
These metrics help you identify cart abandonment rates, which can be a significant challenge in ecommerce. Knowing how many users add items to their carts but do not complete the purchase allows you to address issues in your checkout process, such as complex forms, unexpected costs, or payment problems.
Moreover, tracking these metrics allows you to assess the impact of marketing campaigns. You can determine which campaigns or channels lead to more items being added to the cart and, more importantly, which ones result in actual purchases. It also helps allocate marketing budgets more effectively.
11. Customer Acquisition Cost (CAC)
Customer acquisition cost (CAC) is a crucial metric for any e-commerce business. It refers to the total cost associated with acquiring a new customer and can be calculated by dividing the total sales and marketing expenses by the number of new customers acquired during a specific time period. For instance, if a business spent $10,000 on marketing and sales in one quarter and gained 50 new customers, the CAC would be $200 per customer.
Why It is Important to Track Customer Acquisition Cost (CAC)
Tracking CAC is important for several reasons.
Firstly, it helps businesses understand the effectiveness of their marketing and sales efforts. By measuring the cost of acquiring a new customer, businesses can assess the ROI of their marketing campaigns and make necessary adjustments.
Secondly, it allows businesses to make informed decisions about how to allocate their resources. Businesses can identify channels that generate the most cost-effective leads by analyzing CAC and focusing their resources accordingly.
Finally, it helps businesses maintain profitability. By keeping CAC low, businesses can maximize their profits and ensure long-term success.
12. Net promoter score (NPS)
Have you heard about NPS before? The answer is no, so do not worry. I will tell you what NPS is and why it is important to track it in GA4:
Net Promoter Score (NPS) is a metric used to gauge customer loyalty towards a company. It is a single-question survey, with scores ranging from -100 to +100. A higher score is preferred and indicates greater customer loyalty. This metric is widely accepted as the gold standard for measuring customer experience and is used by millions of businesses to track how their customers perceive them. Net Promoter Score NPS scores help businesses differentiate between positive and negative feedback.
Why It is Important to Track Net Promoter Score (NPS)
Tracking Net Promoter Score (NPS) is important because it helps ecommerce businesses understand how their customers perceive them and gauge customer loyalty. By measuring NPS, businesses can identify areas for improvement and take necessary actions to improve customer satisfaction.
Moreover, a higher NPS score is usually associated with higher customer retention rates and increased revenue growth. Therefore, tracking NPS can help businesses to improve customer loyalty, gain a competitive advantage, and ultimately achieve business success.
Why Ecommerce Metrics Are Crucial to Your Business
Navigating the intricate lanes of eCommerce is no simple task. Ecommerce metrics act as guiding stars in this vast universe. These ecommerce analytics metrics dive deep, shedding light on user behaviors, sales trends, and potential bottlenecks. Ignoring these key ecommerce metrics is like sailing a ship without a compass.
Let’s discuss the significance of e-commerce metrics:
Understanding Performance: Metrics give you quantifiable data about how your business is performing. Whether it’s sales volume, conversion rates, or average order value, these numbers provide insight into the health of your business.
Identifying Areas for Improvement: You need to be aware of where your e-commerce site is underperforming to take the necessary steps to improve. Metrics can help pinpoint weak areas or processes that need optimization.
Customer Behavior Analysis: Metrics such as bounce rate, session duration, and pages per visit can give insight into how visitors interact with your website. It can aid in improving user experience, which can subsequently increase conversion rates.
Optimizing Marketing Campaigns: E-commerce metrics can provide insights into the effectiveness of various marketing campaigns. By understanding which campaigns drive the most conversions, businesses can refine their strategies to maximize results.
Use Analytify to Track Your Ecommerce Metrics on WordPress
Specifically designed for WordPress users, Analytify presents a transformative approach to accessing and interpreting ecommerce metrics. Every crucial GA4 ecommerce metric can now be at your fingertips. You can elevate your analytics game with Analytify and ensure you’re always a step ahead in the ecommerce race.
Read: How to use Analytify to track your Ecommerce Metrics on WordPress.
FAQs about Ecommerce Metrics
What distinguishes ecommerce metrics from KPIs?
Ecommerce metrics are general quantifiable values offering insights, while KPIs (Key Performance Indicators) are specifically aligned with your business objectives.
How often should I monitor my key ecommerce metrics?
While daily checks provide a pulse on real-time activities, a weekly or monthly review is vital for strategic planning.
How seamlessly does Analytify work with GA4 for tracking ecommerce metrics?
Analytify and GA4 integrate effortlessly, ensuring you receive the latest and most vital ecommerce data directly on your WordPress dashboard.
Is setting up ecommerce metrics tracking in Analytify a complex process?
Not at all. Analytify emphasizes user experience, ensuring a hassle-free setup process for all users.
Conclusion
In wrapping up our journey through the essentials of ecommerce metrics, it’s clear that data remains the backbone of any thriving online company. These metrics aren’t just numbers; they’re insights, strategies, and stories waiting to be uncovered. If WordPress is your platform of choice, let Analytify translate these analytics for you, providing a more transparent and actionable perspective on your GA4 ecommerce metrics.
Hungry for more insights? Dive into other articles on our website for more knowledge, tips, and tools. Read 13 Most Important Google Analytics Metrics
As we conclude, we’d love to hear from you: Which of the ecommerce metrics we discussed today strikes a chord with your business needs? Drop your thoughts in the comments below.