Analytify vs Looker Studio (Detailed Comparsion 2025)
Imagine you’re trying to grow your business, but the data you need to make decisions is buried in complex reports that are hard to understand. Sounds frustrating, right? That’s where the right analytics tool can make all the difference. But with so many options out there, how do you choose?
When it comes to tracking website performance, marketing campaigns, and customer behavior, Analytify vs Looker Studio are two tools that often come up. Both are powerful, but each serves a different purpose, especially when it comes to report visualization. So, how do you know which one is right for you?
In this article, I’ll explain the features of Analytify compared with Looker Studio, focusing on their key differences and similarities in terms of reporting as the primary focus.
This Analytify vs Looker Studio comparison will help you make an informed choice.
Analytify vs Looker Studio (TOC):
Overview of Analytify and Looker Studio
Let’s take a quick look at what Analytify and Looker Studio actually are and how they work.
What is Analytify?
Analytify is the best WordPress plugin designed to make Google Analytics data more accessible and easier to understand. It’s a great choice for small to large-sized businesses and marketers who want to streamline their reporting without needing a deep understanding of analytics.
With Analytify, you can easily track your website’s performance, sales data, and marketing efforts. It integrates seamlessly with Google Analytics and WooCommerce, making it especially useful for e-commerce stores looking to track key metrics like conversions, traffic, and user behavior.
Analytify is a quick and easy way to get your main stats right from your dashboard.
Key Features of Analytify:
- Simple, easy-to-read reports directly pulled from Google Analytics.
- Integration with WooCommerce and Easy Digital Downloads. It is perfect for e-commerce businesses.
- Customizable dashboards for easy tracking of your most important metrics.
- Automatic Google Analytics integration, so you don’t have to manually pull data.
What is Looker Studio?
Looker Studio (formerly known as Google Data Studio) is Google’s free platform for creating detailed and interactive reports from a variety of data sources.
Looker Studio is aimed at users who need more customization and advanced features in their reports. It’s a great tool for agencies, large teams, or anyone who needs to build reports that can pull data from multiple sources and display it in interactive formats.
One of Looker Studio’s strengths is its flexibility. You can integrate data from Google Analytics, Google Ads, and even third-party sources like SQL databases or marketing platforms, which makes it ideal for businesses that need a comprehensive view of their performance.
Key Features of Looker Studio:
- Highly customizable, with advanced reporting and visualization options.
- Real-time data updates from multiple sources.
- Interactive dashboards that allow users to drill down into specific data points.
- Free tool with the option to integrate with paid services for added functionality.
So, we can say that Analytify is a plugin that simplifies integrations and setups, offering an easy-to-use analytics dashboard for quick access to your key stats. On the other hand, Looker Studio is a more customizable tool designed to help you tailor your data visualizations for larger, more complex purposes.
Comparison Table: Analytify vs Looker Studio
I decided to present you with a comprehensive table between Analytify and Looker Studio, so that you can better understand both. Along with differences, you’ll also find some Analytify and Looker key similarities. For example, both collect data from Google Analytics.
| Feature/Aspect | Analytify | Looker Studio |
| Target Audience | Small to large businesses, marketers, e-commerce | Agencies, enterprises, data analysts, large teams |
| Ease of Use | Extremely user-friendly, quick setup with minimal configuration | Steep learning curve, requires technical expertise |
| Setup Time | Quick setup for GA4, Google Ads, Search Console without GTM | Requires manual setup of GA4 and other platforms, often using GTM |
| Customization | Basic, intuitive customization options for reports | Highly customizable, flexible reports and visualizations |
| Data Sources Supported | Google Analytics, WooCommerce, WordPress | Google Analytics, Google Ads, SQL, BigQuery, third-party APIs |
| Visualizations & Dashboards | Simple charts (line, bar, pie), easy to interpret | Advanced visualizations (heat maps, geo-maps, interactive charts) |
| Report Types | Pre-built reports, real time reports, quick and easy to generate, generate stats and GA4 stats | Custom reports, complex multi-source reports, real-time insights |
| Interactivity | Limited interactivity (static reports) | High interactivity, users can drill down into data |
| Real-Time Data Updates | Real-time updates from Google Analytics | Real-time updates from multiple sources (Google Analytics, Ads, SQL) |
| Integration with Google Analytics | Easy integration with GA4, Google Ads, Search Console without relying on GTM | Requires manual setup of GA4, Google Ads, and other integrations |
| Integration with Other Platforms | WooCommerce, WordPress, and basic integrations | Google Ads, BigQuery, SQL databases, and other third-party platforms |
| Pricing | Affordable paid plans, with a free option for basic features | Free to use, with additional costs for premium features |
| Support & Resources | Email support, simple documentation for setup, and a support ticket system | Extensive tutorials and community forums, but requires technical expertise |
| Customization of Visual Elements | Basic customization of graphs and reports | Full customization of charts, layout, and color schemes |
| Sharing & Collaboration | Basic sharing via email or link, can download the report. Can also set email reports weekly, monthly or as per your need. | Real-time collaboration, sharing via link, exporting in multiple formats |
| Data Blending | Basic data integration from Google Analytics & WooCommerce | Advanced multi-source data blending for complex reports |
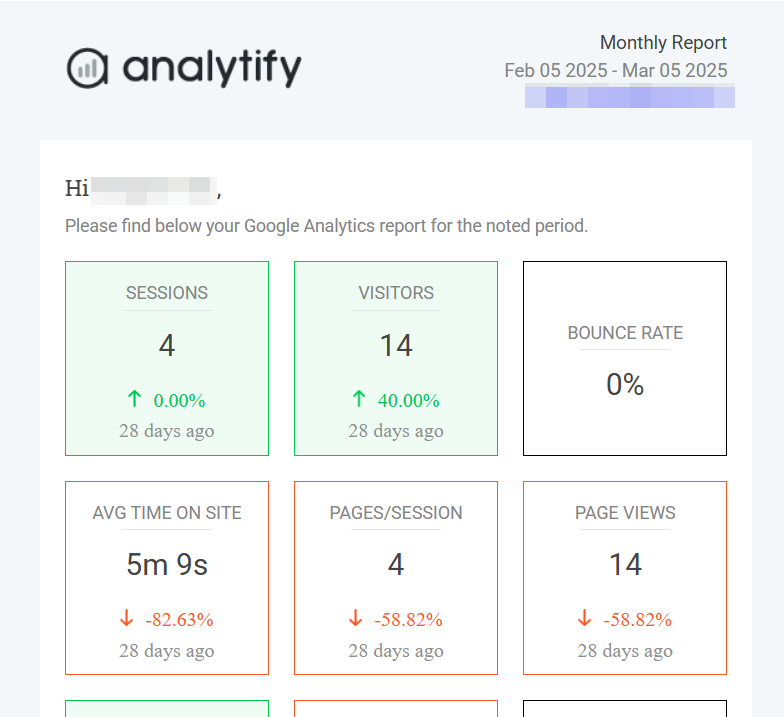
| Automation | Automated reporting and email updates | No built-in automation, but can integrate with third-party tools |
| Mobile-Friendly | Fully mobile-optimized dashboards | Mobile-friendly dashboards with responsive design |
| Best Use Case | Ideal for small businesses and marketers needing quick, actionable insights | Best for large teams and enterprises requiring complex, interactive reporting |
| Compliance & Data Privacy | Compliant with Google Analytics, GDPR compliant | Can be configured for GDPR compliance, complies with Google’s privacy policies |
| Learning Resources | Easy-to-follow guides, no technical knowledge required | Requires technical knowledge, extensive documentation available |
| Integration with WordPress/WooCommerce | Seamless integration with minimal setup for WordPress/WooCommerce | No direct integration, but customizable through APIs |
| Performance & Speed | Fast setup and performance, ideal for small datasets | Excellent for handling large datasets and complex reports |
| Data Filtering | Basic filters for essential metrics | Advanced filtering with complex conditions for precise reports |
| Templates Availability | Pre-built templates for quick reports | Extensive templates with high customization options |
| Multi-Language Support | Primarily English, very user-friendly for non-technical users | Supports multiple languages for global teams |
| Custom Alerts | No custom alerts, but automated email reporting available | Custom alerts based on specific data conditions |
| Visualization Collaboration | No real-time collaboration for visual reports | Real-time collaboration on reports and visualizations |
| Data Export Options | Exports to CSV, PDF with one-click simplicity | Exports to CSV, PDF, Google Sheets, and advanced formats |
| Custom Branding | No branding options for reports | Full custom branding of reports (logos, colors, themes) |
| Security & User Permissions | Basic user roles for report access | Advanced user roles and permissions for enterprise teams |
| Scheduled Reporting | Yes, simple scheduling for automatic email reports | Yes, but requires more advanced configuration for scheduling |
| Cloud-Based Storage | Cloud-based, with data primarily in Google Analytics | Fully cloud-based, integrates with Google Cloud and other storage services |
| User-Friendly Setup | Effortless GA4, Google Ads, and Search Console setup with no GTM | Requires technical setup, particularly for GA4 and Google Ads |
Note: Even if you choose to use Looker Studio for its advanced customization and flexibility in creating detailed reports, setting up GA4, Google Ads, and Google Search Console through Analytify can be a smart move. Analytify simplifies the process, allowing for an easy, hassle-free setup without depending heavily on Google Tag Manager (GTM).
Report Visualization: Analytify vs Looker Studio
When it comes to report visualization, both Analytify and Looker Studio excel in different ways. The right choice depends on your specific needs: do you need quick insights with minimal setup, or do you need highly interactive and customizable reports?
Report Visualization in Analytify
Join 50,000+ beginners & professionals who use Analytify to simplify their Google Analytics!
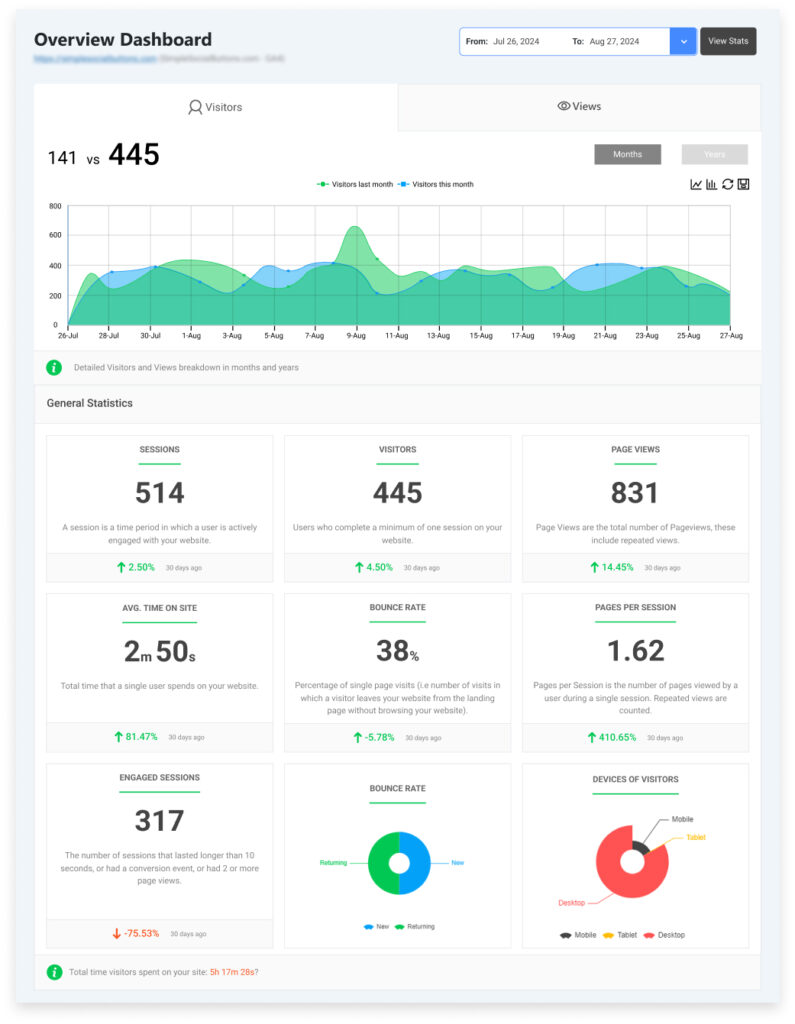
Analytify offers a straightforward approach to visualizing your data. It’s perfect for businesses that want quick, easy-to-understand reports without diving deep into complex configurations. With Analytify, your Google Analytics data is presented in simple charts and graphs (like line, bar, and pie charts) right on your dashboard.
You don’t need to worry about building reports from scratch; everything is automated and set up for you.
Key Features for Report Visualization in Analytify:
1. Overview Dashboard
- Key Metrics at a Glance: Displays essential statistics like Sessions, Users, Bounce Rate, Average Time on Site, and Pageviews.
- Comparative Analysis: Compare current data with previous periods (like last week or last month) to identify trends.
- Visual Representations: Includes line and bar charts for easy-to-read insights.
2. Audience Insights
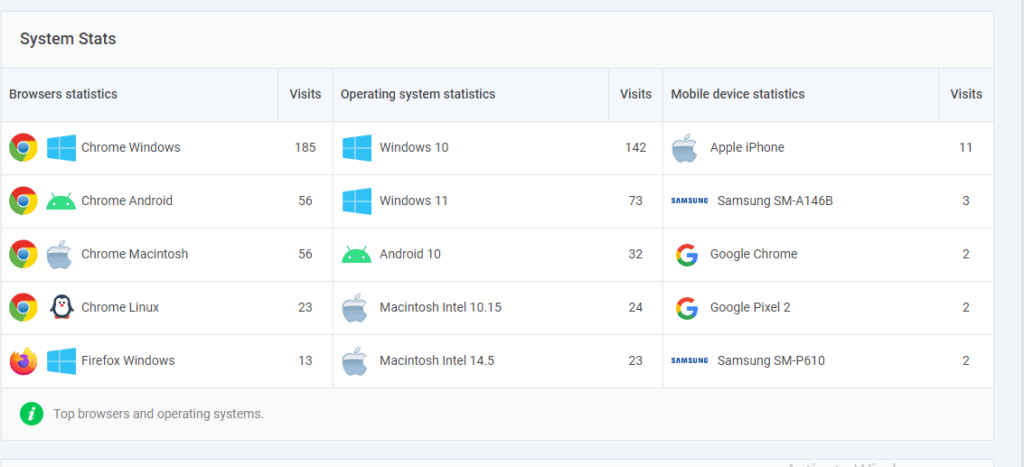
- Device and Browser Usage: Track which devices (mobile, desktop, tablet) and browsers your audience uses most often.
3. Acquisition Reports
- Traffic Sources: Understand where your traffic is coming from, organic search, paid ads, direct traffic, social media, etc.
- Campaign Performance: Evaluate how well your marketing campaigns are performing to drive traffic and conversions.
4. Behavior Reports
- Top Pages: Identify your most visited pages and analyze user engagement.
5. Conversion Tracking
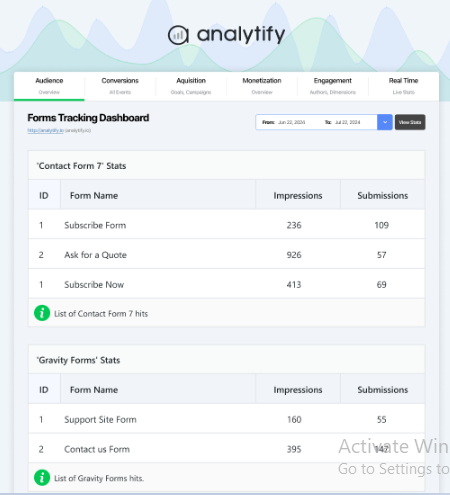
- Goal Completions: Track key actions like form submissions, sign-ups, and purchases.
- E-commerce Metrics: Track important e-commerce stats like Average Order Value, Conversion Rate, Cart Abandonment, and Revenue.
6. Real-Time Reporting
- Live Visitor Data: Monitor visitors on your site in real-time, including their location, the pages they’re viewing, and how long they stay on the site.
- Instant Feedback: See immediate results from recent campaigns, updates, or website changes.
7. Geographic Data
- Traffic Heatmaps: Visualize where visitors are located globally, helping you focus marketing efforts in high-performing regions.
- Regional Performance: You can dive deeper into performance by region to tailor your marketing strategies based on geographic data.
8. Social Media Insights
- Referral Traffic: See which social platforms are driving traffic to your website.
- Engagement Metrics: Track how visitors from social media engage with your content and navigate through your site.
9. Top Referral Sources
- Referral Traffic Breakdown: Identify which external websites and blogs are sending the most visitors to your site.
10. Keyword Report
- Track Organic Keywords: View which keywords are driving organic traffic to your site.
- You can see how people are finding you. What keywords are ranking your site?
11. Customizable Reporting
- Date Range Selection: Choose specific time periods (daily, weekly, or monthly) for customized reporting.
- Export Options: Export reports in CSV, PDF, or Excel formats for easy sharing and further analysis.
12. Email Alerts
- Automated Alerts: Analytify allows you to set up email alerts for key metrics, like sudden spikes in traffic or dips in conversion rates.
- Custom Notifications: Set thresholds for specific metrics (e.g., a traffic increase or goal completion), and get instant notifications.
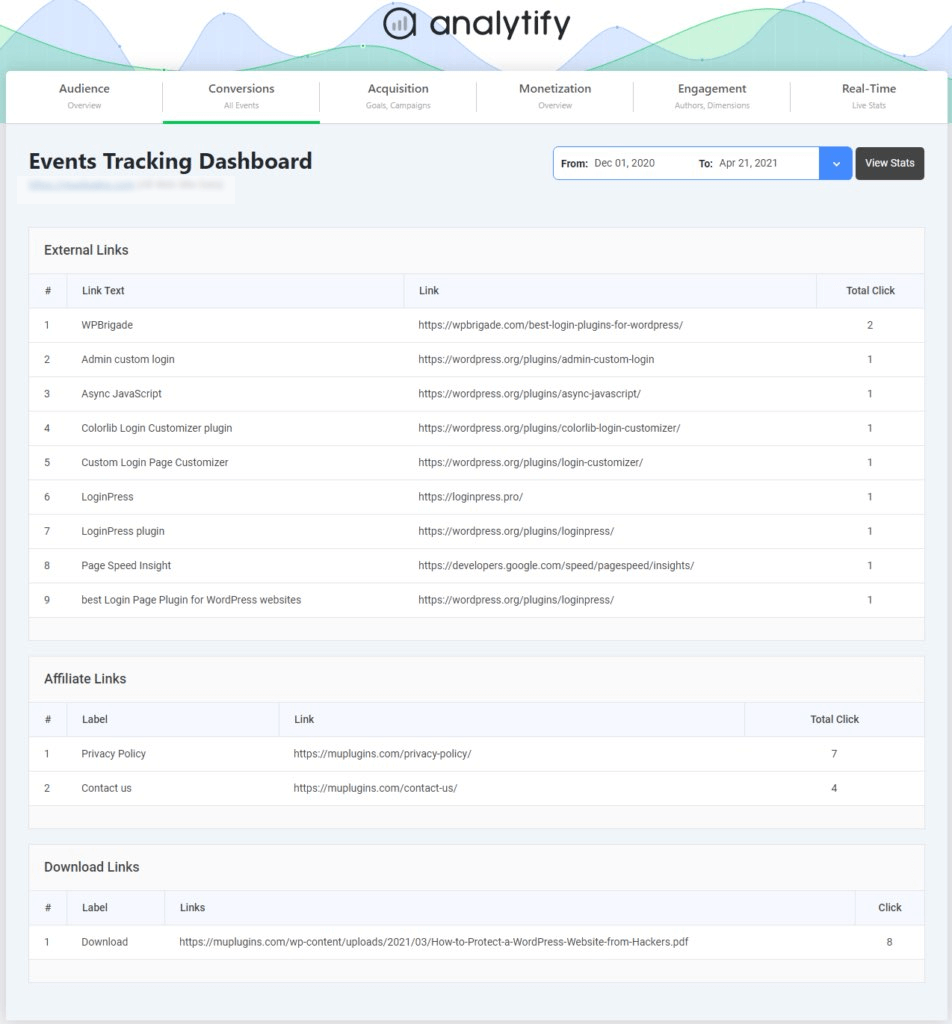
13. Event Tracking Reports
- Track Specific Actions: Monitor custom events like button clicks, form submissions, and other important interactions.
- Event Performance: Track how specific events drive engagement and conversions on your site.
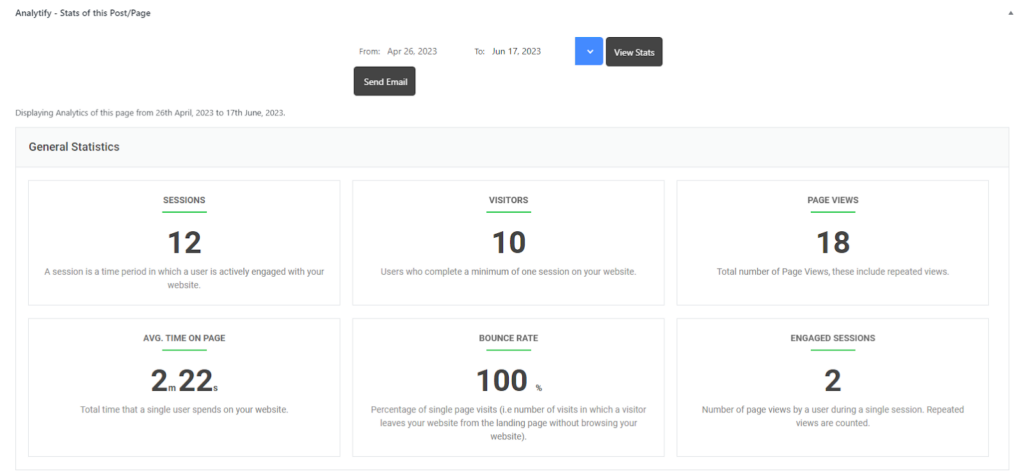
15. Specific Page/Post Reports
- You can even track the content through the specific author.
- Page-Level Data: View detailed performance reports for individual pages or posts on your website.
- Metrics for Pages/Posts: Track metrics like Pageviews, Bounce Rate, Average Time on Page, and Conversions for each specific page or post.
- Content Performance: Understand how each page or post contributes to overall site traffic and engagement, helping you optimize content.
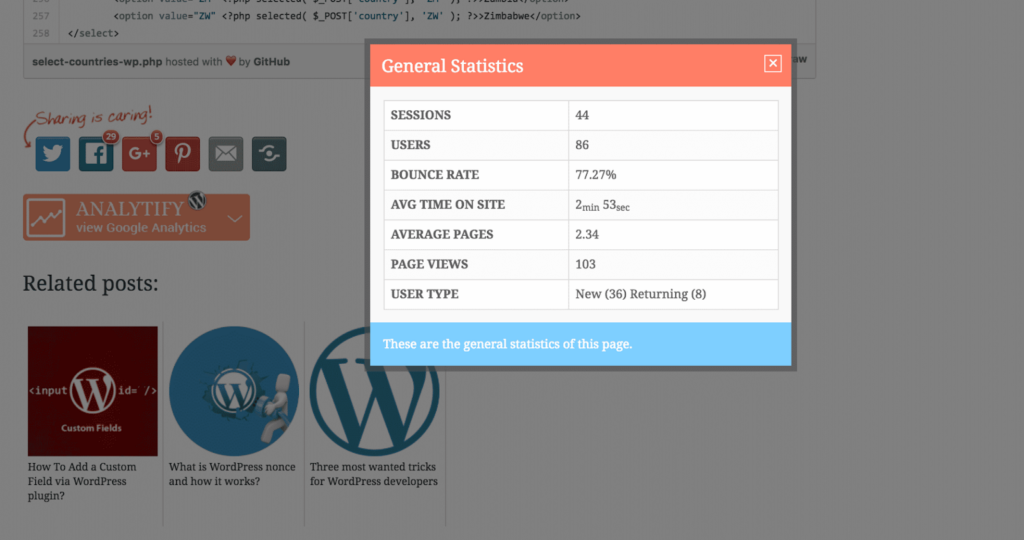
Analytify even gives you the leisure to share some basic analytics at the front end of your site.
- Visual Representation: View these stats in a simple, digestible format, so you can quickly assess how well each page is performing without having to dig through complex data.
Analytify provides users with easy-to-understand reports and a comprehensive view of their website and e-commerce performance. With reports like Top Pages, Keyword Reports, and Specific Page/Post Reports, businesses can gain a clearer understanding of how different content is performing and where improvements can be made.
Report Visualization in Looker Studio:
On the other hand, Looker Studio is designed for those who want to take their data visualization to the next level. If you need interactive reports and advanced customization, Looker Studio is the go-to tool. Looker Studio gives you full control over your reports. You can integrate data from multiple sources (like Google Ads, SQL databases, and more), create interactive dashboards where users can drill down into the data, and fully customize the look and feel of your reports.
1. Customizable Dashboards
- Full Customization: Looker Studio allows for complete control over your report layout and design. Users can choose from a wide variety of visual elements and arrange them to create a unique, tailored dashboard.
- Drag-and-Drop Interface: The intuitive interface allows users to easily drag and drop different data visualizations, charts, and tables into the report.
- Dynamic Filters: Add filter controls to your reports so that users can customize the data they see (e.g., by date range, region, or product type).
2. Interactive Data Visualizations
- Charts and Graphs: Looker Studio offers various types of charts, including:
- Bar and Column Charts
- Pie Charts
- Line Charts
- Area Charts
- Geo-maps (great for visualizing regional data)
- Bar and Column Charts
- Interactive Elements: Users can click, hover, and interact with data to view specific insights in real-time. For example, users can drill down into data points, explore specific metrics, or view additional details by hovering over a chart or map.
3. Multi-Source Data Integration
- Connecting Multiple Data Sources: One of Looker Studio’s key strengths is its ability to pull data from multiple sources. You can integrate data from:
- Google Analytics
- Google Ads
- BigQuery
- Google Sheets
- SQL databases
- Social media platforms
- Third-party data sources via APIs or connectors.
- Google Analytics
- Data Blending: Combine data from different sources (for example, merging Google Analytics data with Google Ads data) to create a comprehensive view of your performance across platforms.
4. Real-Time Reporting
- Live Data Updates: Looker Studio reports are dynamic and can update in real-time as new data is received. This is particularly useful for dashboards that need to reflect live performance metrics.
- Google Analytics Real-Time Data: For example, you can visualize real-time traffic data from Google Analytics or track the performance of live campaigns from Google Ads.
5. Advanced Filtering and Segmentation
- Custom Filters: Add filters for users to segment data by specific metrics like date range, location, or device type. Filters enable users to drill into data and view performance at granular levels.
- Date Range Controls: Users can adjust the date range for reports, making it easy to compare performance over time (daily, weekly, monthly, etc.).
6. Interactive Maps
- Geo-Maps: Visualize your data geographically with geo-maps. This feature is perfect for businesses that need to analyze regional performance or track user behavior across different locations.
- Heatmaps: Highlight regions with high traffic or engagement using heatmaps, helping to identify high-performing areas.
7. Report Sharing and Collaboration
- Real-Time Collaboration: One of the standout features of Looker Studio is its collaboration capabilities. Users can work on reports together in real-time, making it ideal for teams.
- Sharing Options: Reports can be easily shared with stakeholders via a link or exported as PDFs or Google Sheets for offline use.
- Embed Reports: You can embed reports into your website or intranet, providing easy access to critical data for all stakeholders.
9. Data-Driven Alerts
- Email Notifications: Set up email alerts based on specific data conditions. For example, you can receive an email when traffic spikes or when a campaign reaches a certain threshold. This ensures you’re always aware of important changes in performance. But for that, you must have Looker Studio Pro.
Ideal For: Large teams, agencies, and analysts who need interactive and highly customizable reports across multiple data sources.
Looker Studio Vs Analytify: Key Differences in Report Visualization
Let’s sum up Analytify and Looker key differences.
- Analytify: Provides simple, automated reports focused on clarity and ease of use. Perfect for those who want quick insights from Google Analytics and WooCommerce with pre-set dashboards.
- Looker Studio: Offers advanced customization and interactivity, allowing for dynamic dashboards that can be adapted to suit the needs of different teams or projects. It’s the ideal choice for businesses that require detailed, multi-source reporting.
Analytify VS Looker Studio Frequently Asked Questions
1. Can Looker Studio connect to Google Analytics 4 (GA4)?
Yes, Looker Studio can integrate with GA4 using native connectors. This allows users to create reports and dashboards based on GA4 data. However, for more advanced data blending and modeling, Looker Studio may require additional configuration or third-party connectors.
2. Is Looker Studio suitable for small businesses?
Looker Studio is designed to be user-friendly and is often recommended for small businesses due to its free access and ease of use. It allows small businesses to create interactive dashboards and reports without a steep learning curve. However, as businesses scale and require more advanced features, they might need to consider Looker or other BI tools.
3. What are the key features of Looker?
Looker offers several advanced features, including:
LookML: A modeling language that allows for custom data transformations and definitions.
Data Governance: Ensures consistent metrics and access controls across the organization.
Embedded Analytics: Enables embedding analytics into other applications.
Advanced Permissions: Provides row-level and column-level security.
API Integrations: Facilitates integration with other tools and automation of workflows.
4. How does Analytify simplify GA4 setup?
Analytify streamlines the process of integrating GA4 with your website or e-commerce platform. It offers an intuitive interface that reduces the complexity of setting up GA4, making it more accessible for users without technical expertise. This ease of setup is particularly beneficial for small businesses and marketers.
5. Can Looker Studio handle large datasets?
While Looker Studio can manage large datasets, performance may degrade as data volume increases. Users have reported issues with slow loading times and data inconsistencies when dealing with extensive data sources. For handling large datasets efficiently, Looker or other enterprise-level BI tools might be more appropriate.
6. Is Looker Studio free to use?
Yes, Looker Studio is free to use. It provides a range of features suitable for creating reports and dashboards. However, certain advanced functionalities, such as additional data connectors and enhanced collaboration tools, are available through Looker Studio Pro, which is a paid version.
Analytify vs Looker Studio: Recap
Both tools provide valuable insights and serve different purposes. Analytify offers simplicity and quick setup, while Looker Studio provides advanced customization and interactive reporting. The best tool for you ultimately depends on your business needs, whether you prioritize ease of use or the ability to create complex, detailed reports. You can even choose both.
I hope this guide has provided you with a comprehensive understanding of Analytify vs Looker Studio.
Further Readings:
- Analytify Vs GA Google Analytics (Compared 2025)
- Analytify Vs Google Site Kit: A Complete Comparison
- Analytify VS MonsterInsights
Now, I’d love to hear from you. Which tool were you already using: Analytify vs Looker Studio? Or both?


