GA4 Site Speed – (How to Track & Alternatives)
Is your website fast enough to keep visitors engaged and boost search rankings? Site speed is a crucial element impacting user experience, SEO, and conversion rates, making it essential for website owners and marketers to track and optimize it.
This article focuses on GA4 site speed tracking and how to analyze metrics such as page load time in GA4. You’ll learn why speed matters, how to track it using GA4’s custom methods, where to find page load reports, and explore alternative tools for comprehensive analysis.
Keep reading and learn how to monitor and improve Google Analytics page load time!
GA4 Site Speed (TOC):
What is Site Speed?
Site speed refers to how quickly a website’s pages load and display content in a web browser. It is critical in user experience, search engine optimization (SEO), and overall website performance.
Faster websites provide a better user experience, leading to higher engagement, lower bounce rates, and better rankings on search engines like Google.
GA4 Site speed encompasses various metrics, including the time it takes for the first content to appear, how long it takes for a page to load fully, and the responsiveness of a page when users interact with it.
Improving site speed often involves optimizing images, reducing server response times, and leveraging browser caching.
Why Tracking Site Speed in GA4 is Important?
Tracking site speed in GA4 is crucial because it directly impacts user experience, SEO performance, and overall website efficiency.
- Impact on User Experience: Faster site speeds lead to better user experiences, reducing bounce rates and increasing engagement. Visitors are more likely to stay and interact with content on a fast-loading site.
- SEO Ranking Factor: Google uses site speed as a ranking factor, meaning that faster websites are more likely to rank higher in search engine results, improving visibility and organic traffic
- Conversion Rate Improvement: Speed is directly tied to conversion rates; users are more likely to complete desired actions like making purchases or filling out forms on fast websites
- Key Metrics in GA4: While GA4 doesn’t automatically track site speed metrics, you can track performance using custom definitions and tags for metrics such as page load time, Largest Contentful Paint (LCP), and First Input Delay (FID).
- Customizable Tracking: GA4 allows you to create custom dimensions and metrics to track specific site speed parameters, providing flexibility in monitoring performance.
- Google Analytics Page Load Time: Tracking page load time in GA4 helps you monitor the time it takes for a web page to load fully, which is critical for identifying performance.
- Core Web Vitals Integration: GA4 can be set up to track Core Web Vitals like LCP, FID, and Cumulative Layout Shift (CLS), offering real user experiences.
How to Check Page Speed in Google Analytics 4 (GA4)
While GA4 does not include built-in site speed reports like Universal Analytics, there are two primary methods to track page load time in GA4 and performance metrics:
1. Using Custom JavaScript and Google Tag Manager (GTM)
To check Google Analytics 4 site speed, you can set up custom tracking using Google Tag Manager and custom JavaScript code. To effectively measure page load time in Google Analytics 4 (GA4), you must use Google Tag Manager (GTM) to set up custom variables, triggers, and GA4 event tags. Below are all the steps:
Step 1: Create a Custom JavaScript Variable
To create a custom JavaScript variable, follow these steps:
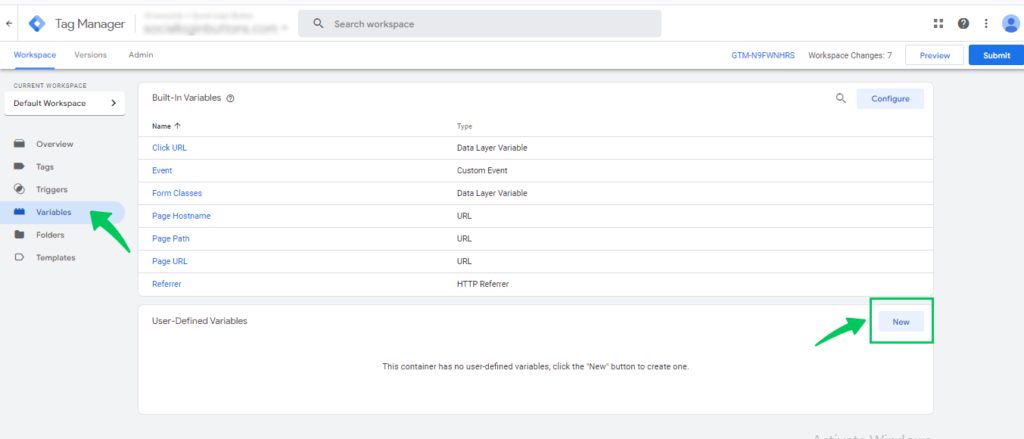
- Go to Variables in your GTM container. Click the New tab.
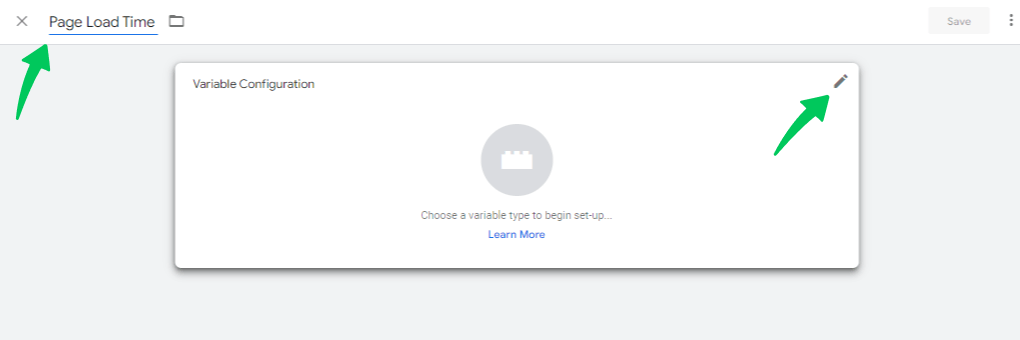
- Select Variable Configuration.
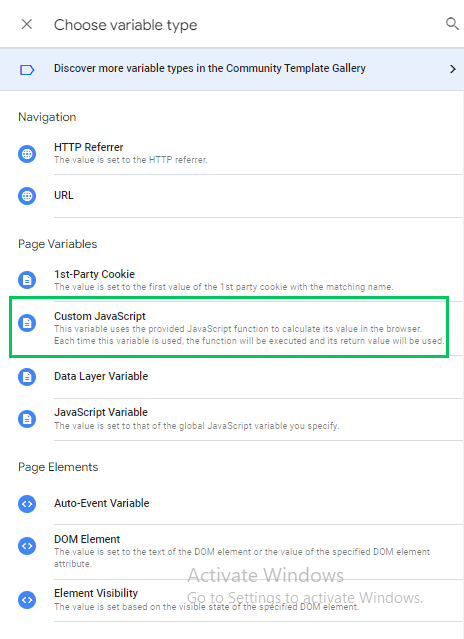
3. Choose Custom JavaScript.
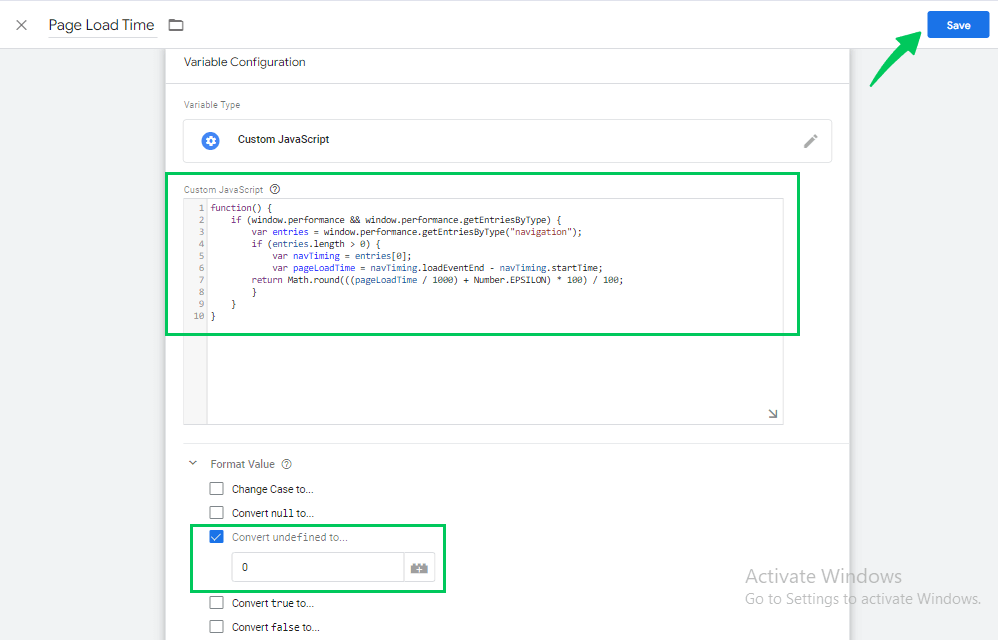
- Paste the JavaScript code, Name this variable (e.g., Page Load Time), and save it.
Step 2: Create a Trigger
Set up two triggers that activate when the page fully loads:
- Go to Triggers and click on the new tab to create a trigger.
- Name the trigger and select Trigger Configuration.
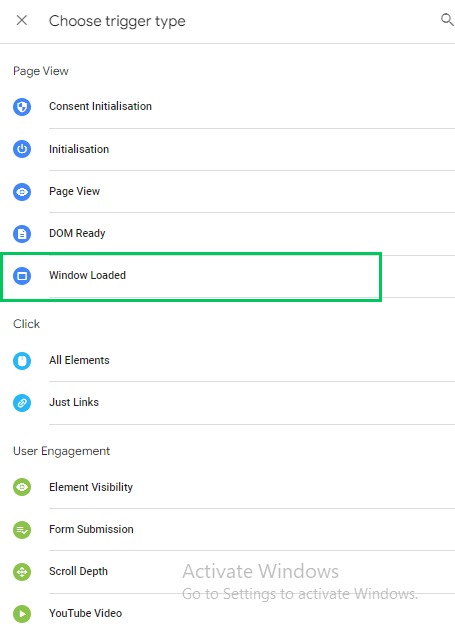
- Choose the trigger type “Window Loaded”.
- Click on the Save tab to save the trigger.
- To create another trigger, Go to the Triggers section again and create a new one.
- Name the trigger and select Trigger Configuration.
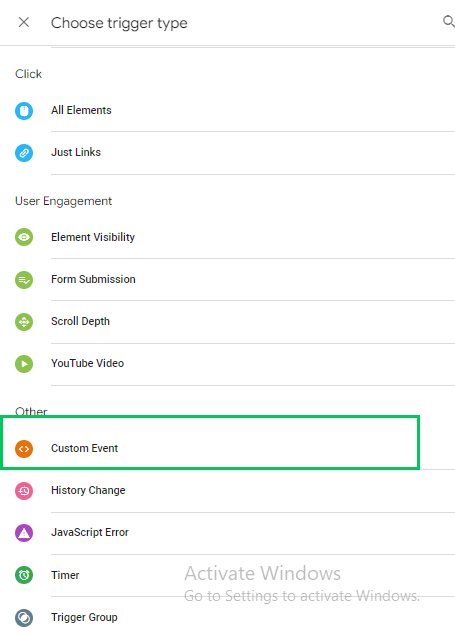
- Choose a custom event as the trigger type.
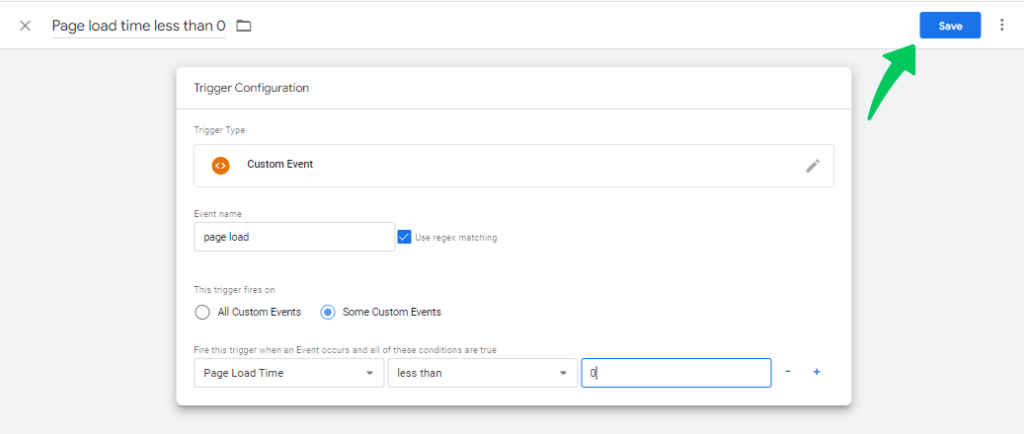
- Add a condition to ensure the trigger fires only when the page load time variable has a value less than 0. Then click on the save tab.
You can see that both the triggers have been created.
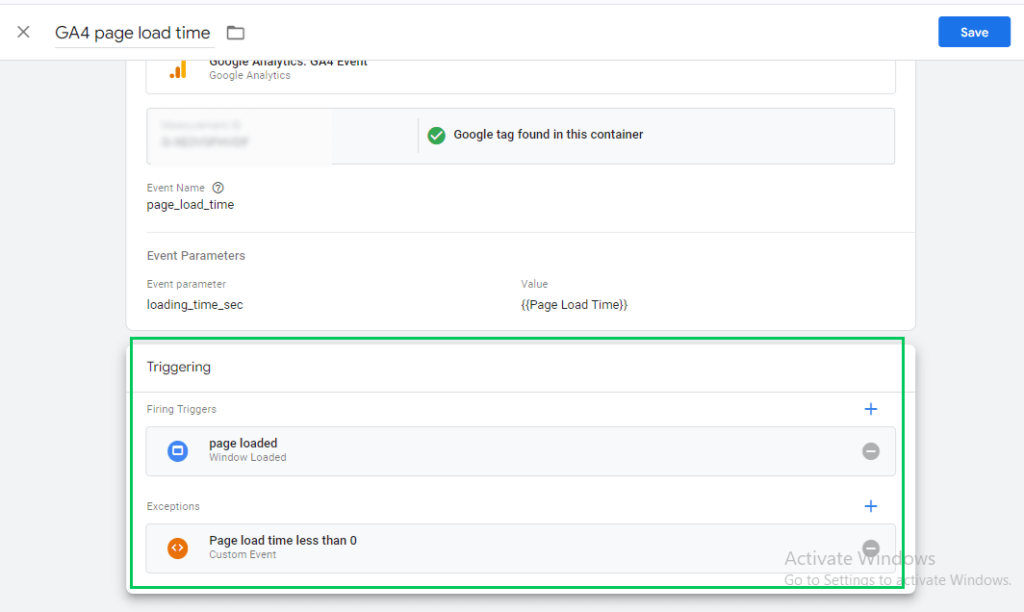
Step 3: Create a GA4 Event Tag
Create a GA4 event tag to send the page load time data to your GA4 property:
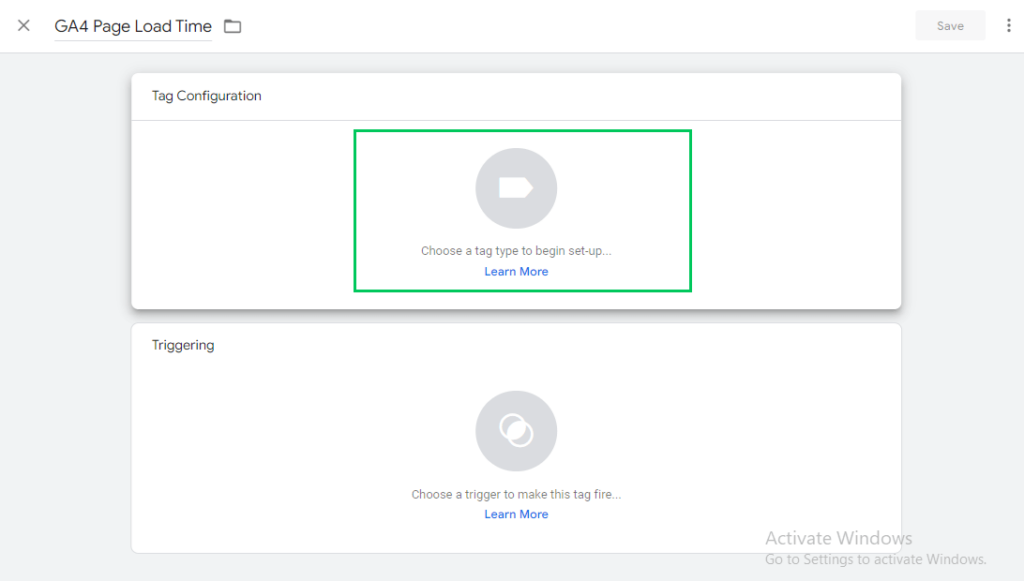
- Go to Tags and create a new tag.
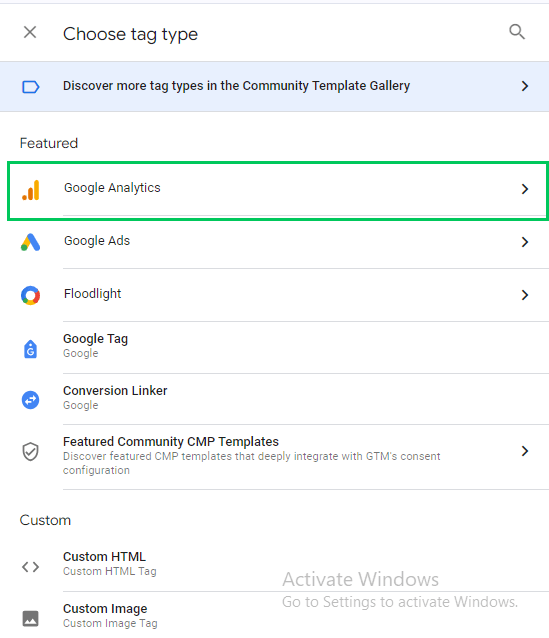
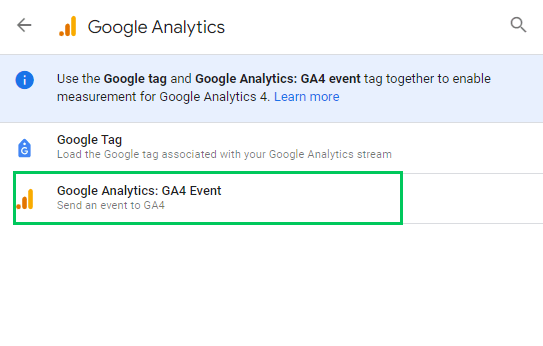
- Select Tag Configuration and choose Google Analytics >>GA4 Event.
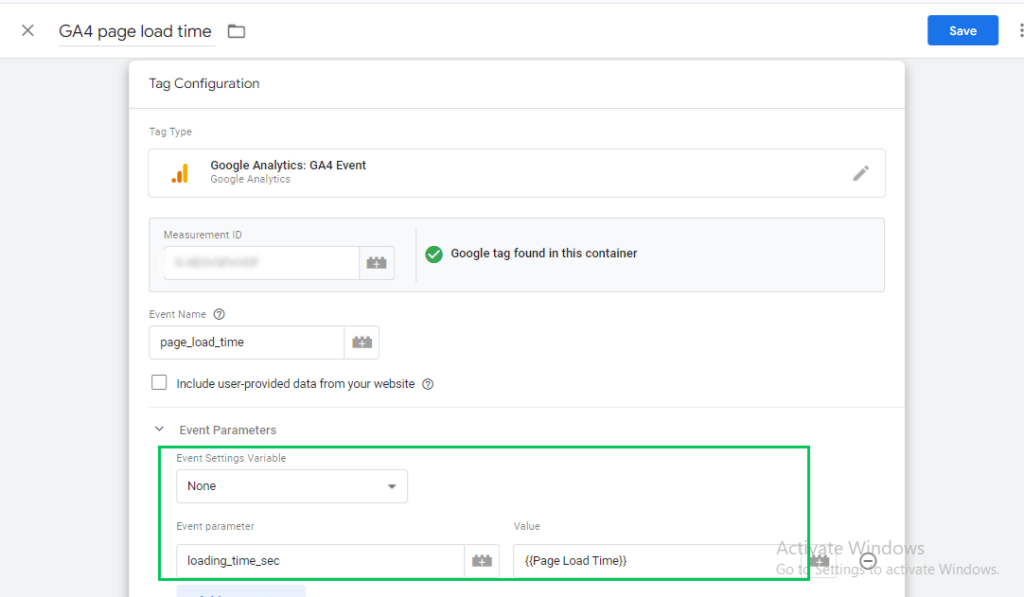
- Set the Event Name to page_load_time (or any custom event name you prefer).
- Under Event Parameters, add:
- Parameter Name: loading_time_sec.
- Value: {{Page Load Time}} (or the equivalent milliseconds variable)
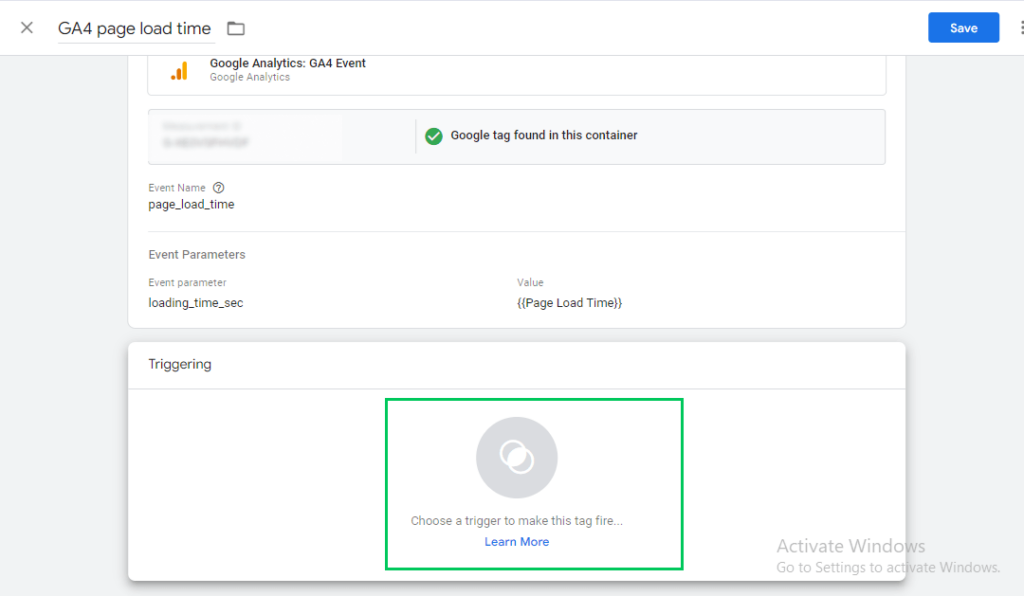
- Set the triggers to the tag, created in Step 2.
6. Name the tag (e.g., GA4 Page Load Time Event) and save it.
Step 4: Register the Parameter in GA4
To view this custom data in GA4, register the custom parameter:
- Log in to your Google Analytics 4 account.
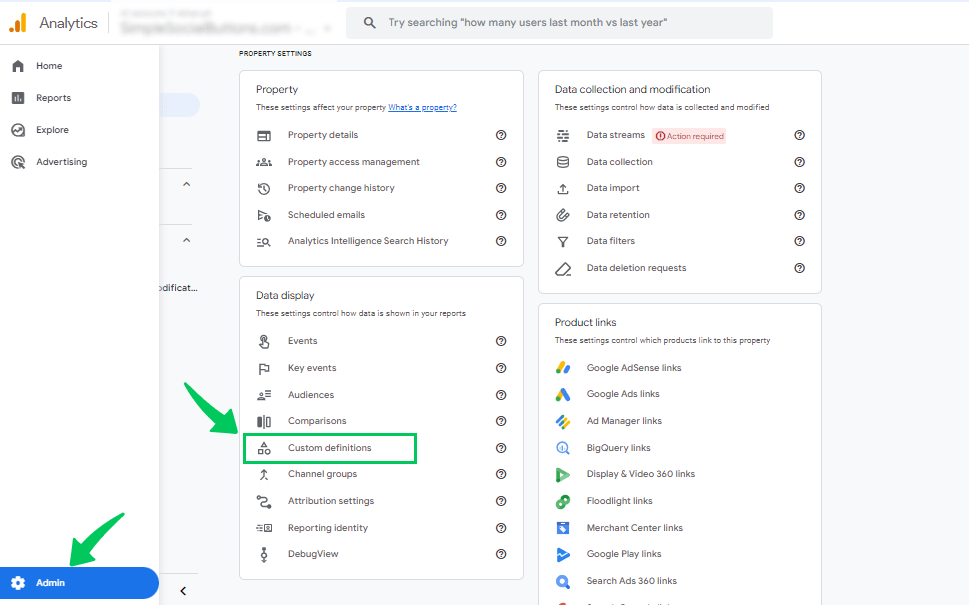
- Click on the Admin tab in the lower-left corner of your GA4 interface.
- Under the Property column, select Custom Definitions.
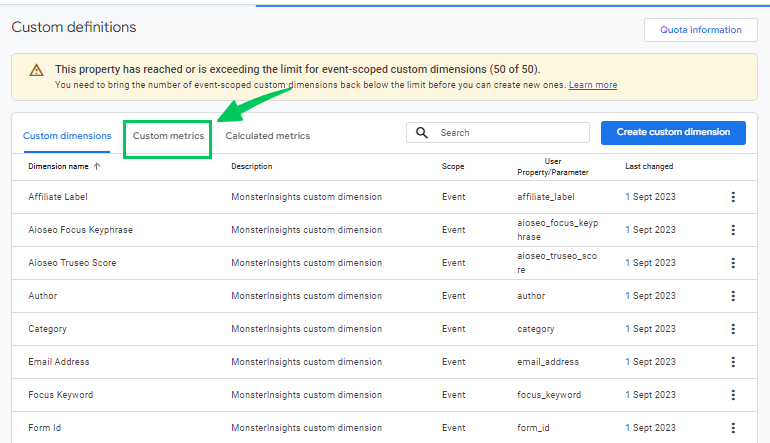
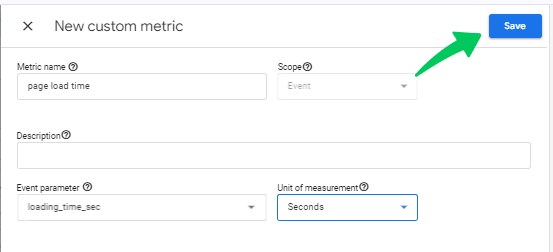
- Choose Custom Metrics to create a new metric.
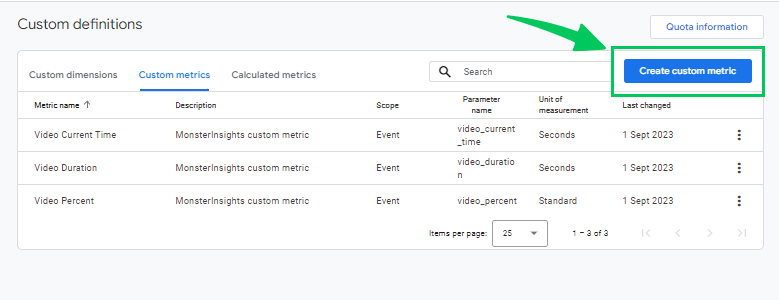
- Click Create Custom Metric tab (usually at the top-right of the custom metrics screen).
- To configure this new metric, follow the settings:
- Name: Give your custom metric a clear, descriptive name (e.g., “Page Load Time”).
- Scope: Choose either Event or User depending on the type of metric you are tracking. For example, for site speed, you would likely choose Event.
- Unit of Measurement: Select the appropriate measurement unit (e.g., milliseconds for page load time).
- Event Parameter: Add the parameter you wish to track, such as the event set up via Google Tag Manager (e.g., loading_time_sec for page load time).
- After defining the custom metric, click Save.
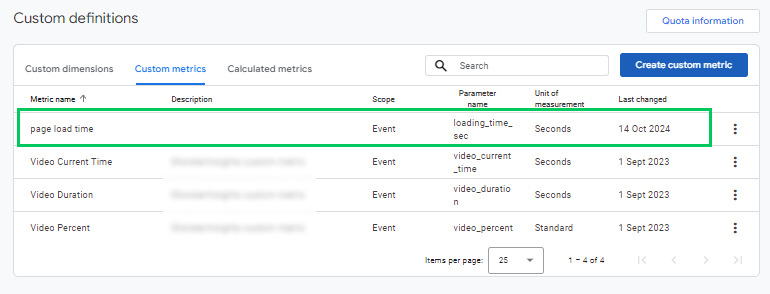
- GA4 will now begin tracking and collecting data for this custom metric moving forward.
Once the metric is set up, you can access it in Explorations or any custom reports by selecting it as a metric under your report’s configuration.
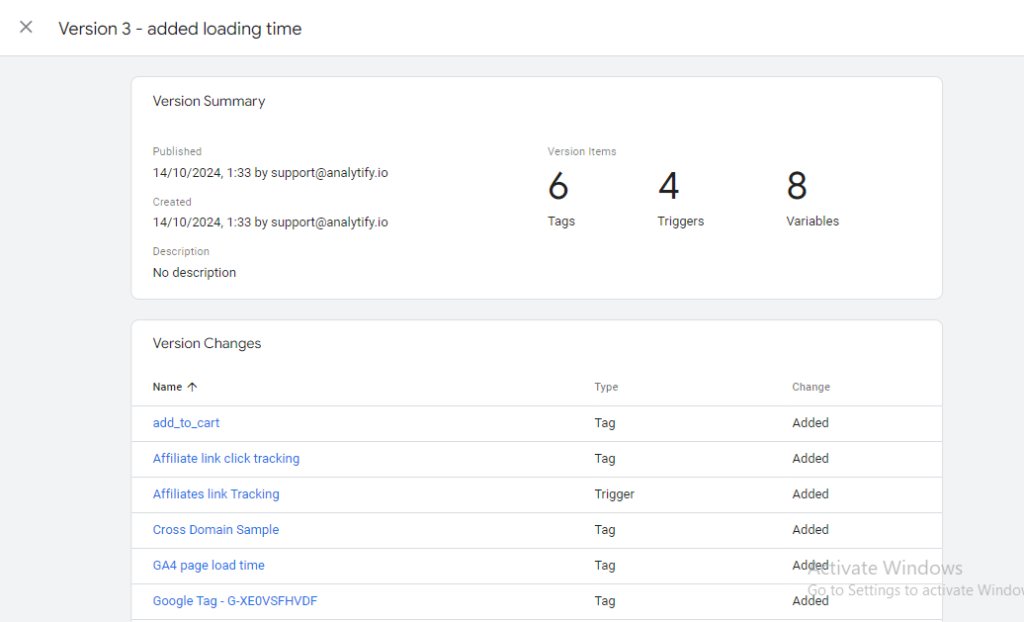
Step 5: Publish the GTM Container
Ensure your changes go live:
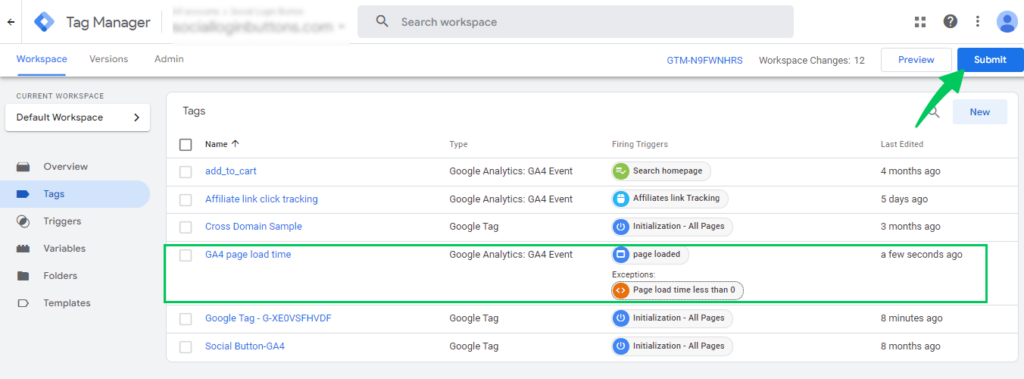
- Select the GA4 page load time tag, and Click the Submit tab in GTM.
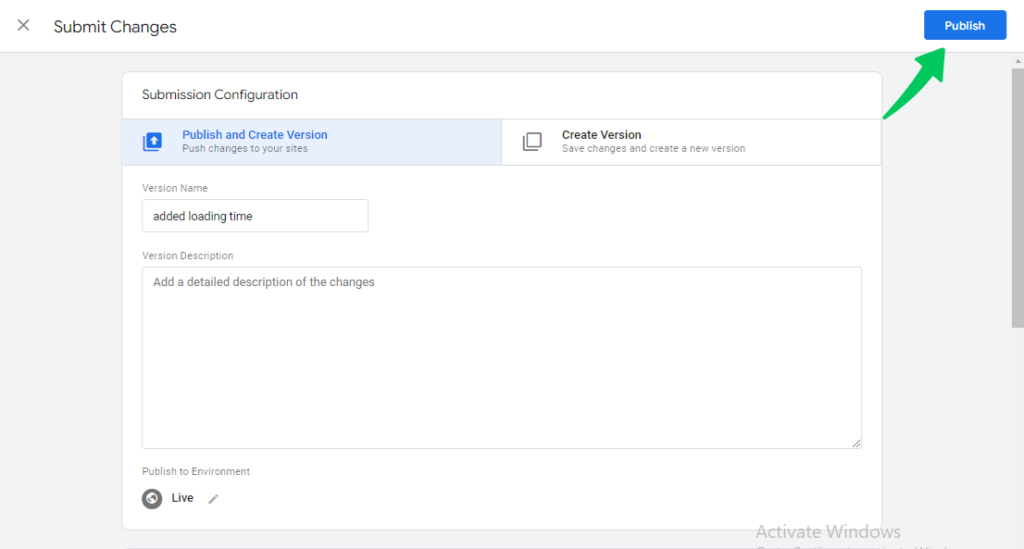
- Add a version name (e.g., Page Load Time Tracking Setup).
- Publish the container.
After setting up the tags and custom definitions, you can view these metrics in GA4’s custom reports or explorations.
2. Using Universal Analytics (UA) Speed Reports (Not Recommended)
Although Universal Analytics (UA) offers built-in site speed reports, this method is not recommended for GA4 users due to the transition to the new GA4 data model and the eventual deprecation of UA in 2024. However, here’s a quick look at how speed reports were accessed in UA:
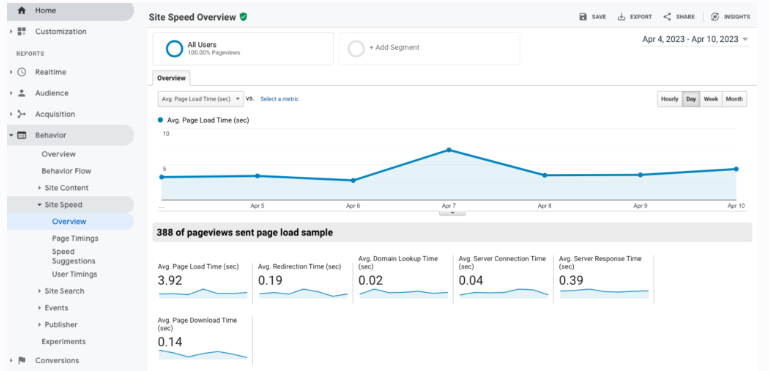
Navigate to Behavior Reports in UA
In UA, go to Behavior > Site Speed > Overview to view detailed reports on page load time, server response time, and more.
UA also offered a “Speed Suggestions” report, which provided recommendations on improving page speed based on data from Google PageSpeed Insights.
Since GA4 does not have these built-in speed reports, it’s better to use the custom JavaScript and GTM methods instead.
Where to View Page Load Time Reports in GA4?
To view reports of page load time in GA4, you can use the Explorations section to set up custom reports that analyze load times and other performance metrics.
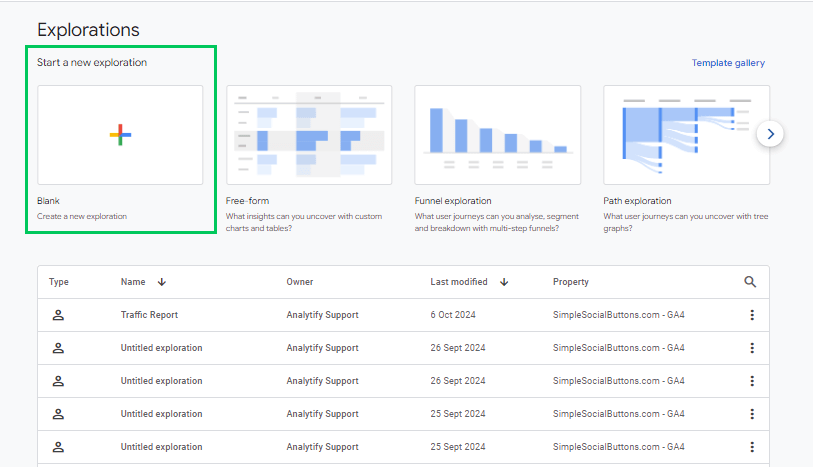
- Create a New Exploration:
- Go to the “Explore” tab in GA4.
- Select the “Blank” canvas to create a new report.
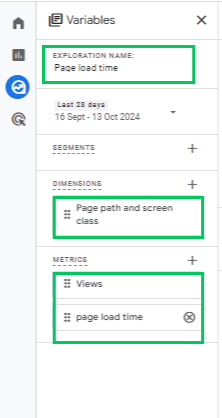
- Name the Exploration report:
- Add a descriptive name to the exploration report, such as “page load time.”
- Set up dimensions and Metrics for Page Load Time:
- Add ‘Page Path and Screen Class’ as the dimension for your report, but you can choose other relevant page-based dimensions, like Page Location, Page Title, and page URL, based on your reporting goals. These options allow flexibility in analyzing various aspects of page performance.
- For Metrics, include views, page load time, or other relevant metrics related to load performance.
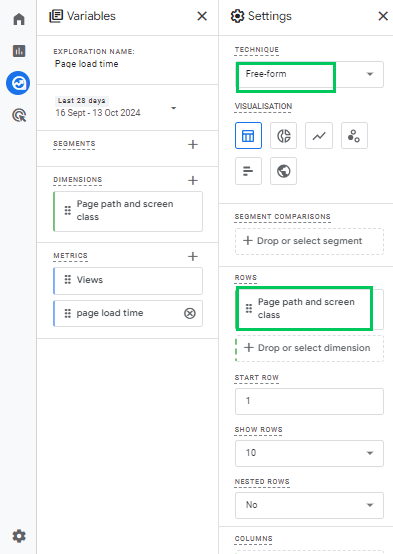
- Choose a technique and Drag the dimension into the report’s rows to break download times for different pages. This can help you pinpoint slow-loading pages and optimize accordingly.
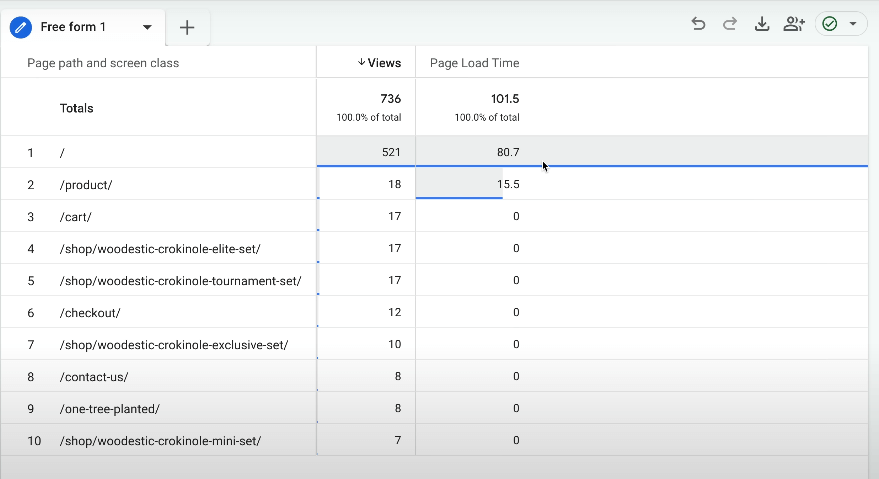
- Visualize the Data:
- The report will display page load times for each page or dimension you selected, helping you to pinpoint which pages are performing well and which may require optimization based on their load times.
Focusing on the Exploration tool allows you to generate highly customizable GA4 site speed report investigating page load times and related user behavior for different segments and periods.
GA4 Site Speed Analysis with Analytify
Join 50,000+ beginners & professionals who use Analytify to simplify their Google Analytics!
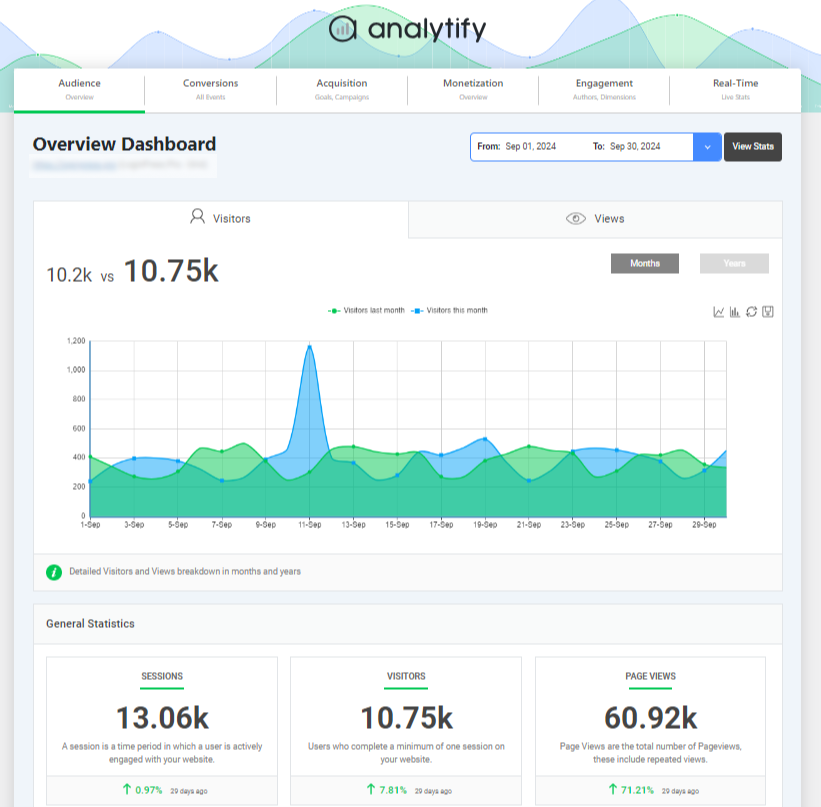
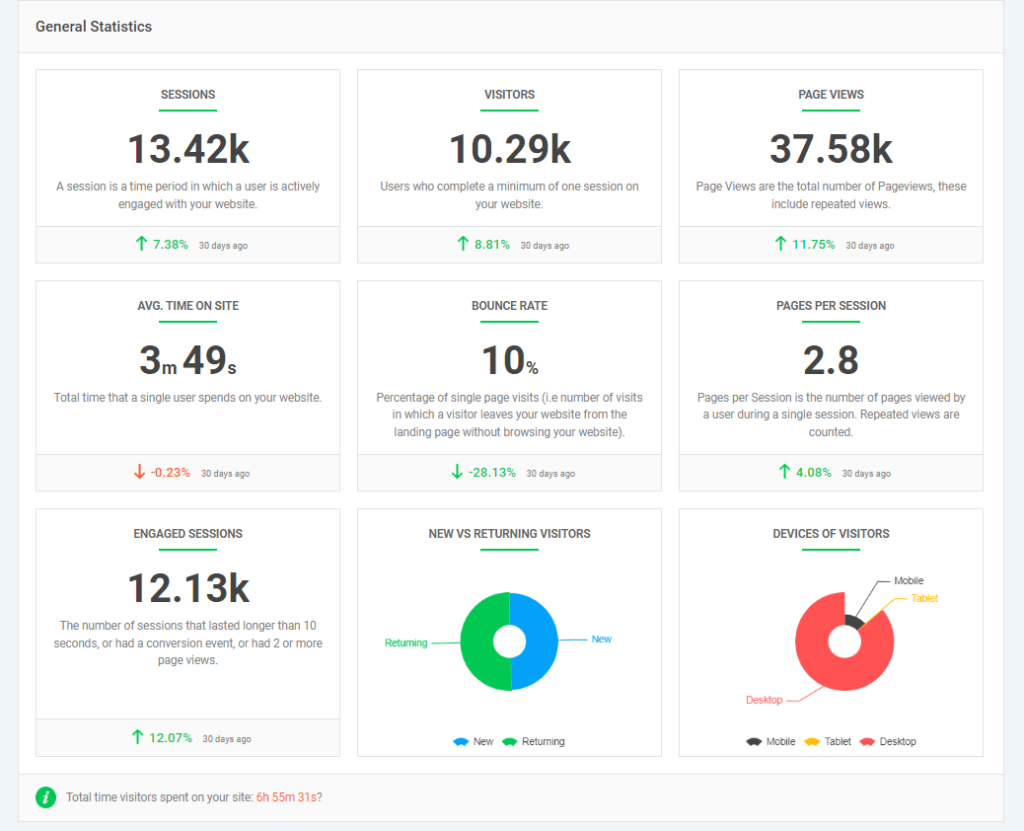
For WordPress users, Analytify stands out as one of the best plugins to simplify and enhance Google Analytics data tracking directly on your website. Analytify not only makes Google Analytics data accessible within WordPress, but it also offers easy-to-read understanding on metrics closely linked to site speed and page load performance.
By tracking metrics such as user engagement, bounce rate, average time on site and real-time performance directly from your WordPress dashboard, Analytify helps site owners monitor the overall experience and address areas impacting load time.
Analytify’s intuitive interface and its tailored approach for WordPress users make it an excellent alternative for tracking metrics relevant to site speed and beyond, empowering you with the tools needed to optimize your website effectively.
3 Alternative Google Tools to Analyze Page Speed
Google offers valuable products to help users learn about web page performance besides GA. These tools can help to analyze and improve your web page speed. Let us discuss one by one.
1. View Core Web Vitals Data in Google Search Console
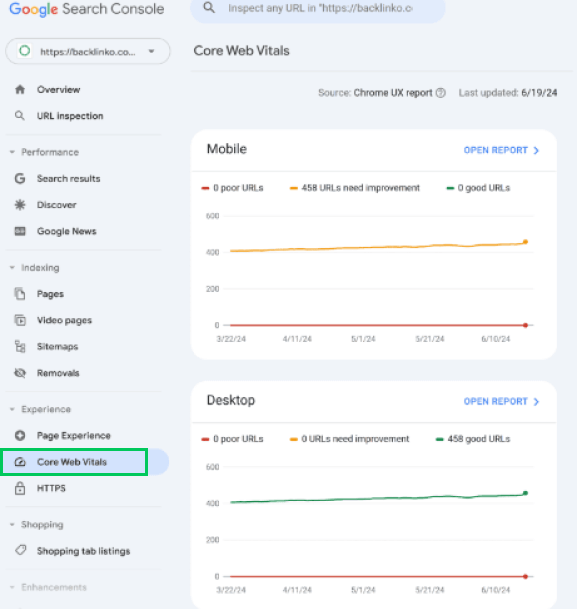
The verified website owners can access a range of information from the Google search console, such as the number of clicks, impressions, ranking keywords, etc. The Google Search Console lets users get detailed information about core web vitals.
A dedicated section, “Core web vitals,” is on the sidebar of the Google search console account. Once you click on this, Google shows you how many of your URLs are “good,” “need improvement,” and “poor” for mobile and desktop devices. You can get more details about the website’s core web vitals through the “Open Report” button.
Advantages
- It is a free tool that gives real user data.
- You can quickly get on-page performance metrics from your Google search console account.
- It provides separate reports for web page performance on mobile and desktop, allowing you to adopt a customized optimization approach for each device type.
Disadvantages
- The Google search console provides core web vitals data for the last 28 days. If you want to look further back, you’ll have to export the data, which can feel clunky, especially if you are trying to track long-term changes.
- The speed and performance data in GSC come only from Chrome users. So, if your visitors use other web browsers, like Safari or Firefox, their experience isn’t captured here, and you can miss potential issues unique to those users.
- Google search console report shows sampled data, so not every speed issue is shown. Some slower experiences might not appear in the data significantly if they only affect a few visitors or specific scenarios.
2. Page Speed Insights
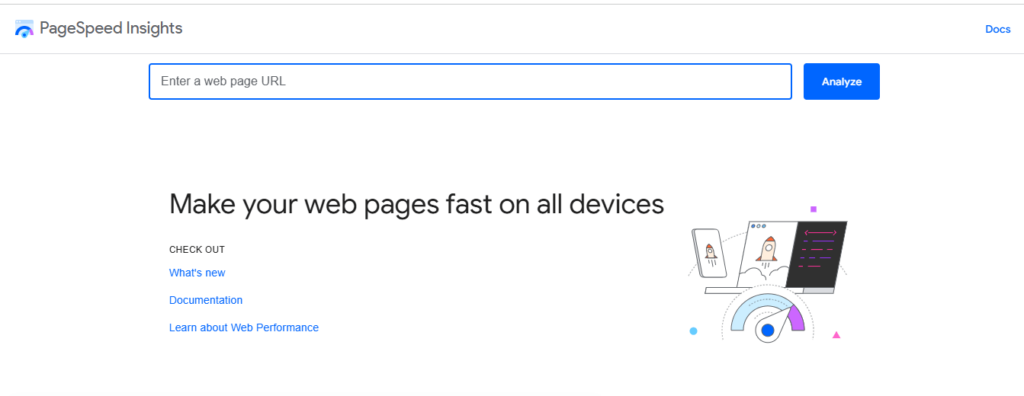
It is one of the best Google products for analyzing webpage speed performance. Its user-friendly interface allows users to perform their website speed test seamlessly.
PageSpeed Insights (PSI) offers a detailed report on web pages’ user experience across mobile and desktop devices. It assigns a numerical score from 0 to 100, with higher scores indicating stronger performance.
PSI assesses page performance using key metrics such as loading speed, resource usage, image, and other media optimization. This helps you understand your web page’s performance and identify areas for improvement.
Advantages
- It is a free tool and provides detailed insights about page performance metrics.
- You can use it even if you do not have a GSC account and can get specific suggestions to improve performance, such as image compression, script minification, and using browser cache.
- It provides you insights into mobile and desktop versions of your site.
Disadvantages
- The online version can analyze one URL at a time. It only focuses on speed and performance and does not provide information about content quality.
- It provides helpful suggestions to improve core web vitals, but they are usually broad and are not customized to each unique website.
- It sometimes shows inconsistent scores based on network conditions, server response time, and other factors.
3. Lighthouse
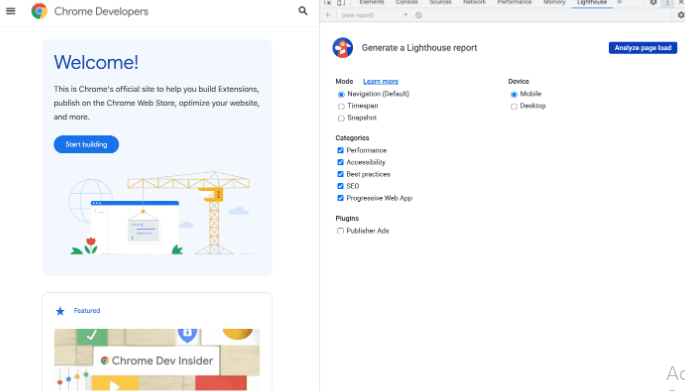
Lighthouse is an open-source tool built into the Chrome browser. It is valuable for analyzing and improving web page performance, accessibility, SEO, and overall user experience.
You can access Lighthouse from the Chrome developer tools panel. You can choose a type of report (Desktop or Mobile) and get insights on the selected page.
Advantages
- It is free and easily accessible within the Chrome browser without extra installations.
- It provides a detailed report covering many performance, accessibility, SEO, and best practices all in one place.
- You can test a page under different simulated network and device conditions, which is valuable for development.
Disadvantages
- Lighthouse can only analyze one page at a time and relies on simulated lab data. It does not always reflect the experience of real users who may have varied devices, networks, and locations.
- This tool has a developers-oriented interface and can be challenging for non-developers to interpret and act without support.
You might get good results if you test your website on a high-quality desktop. However, this does not show how the website works on other devices like smartphones or tablets, which means you can miss problems that mobile users face.
GA4 Site Speed FAQs
1. What is site speed in Google Analytics?
The Google Analytics 4 site speed shows how quickly users can see and interact with website content. GA4 Site speed reports help you understand areas of improvement to ensure a positive user experience and reduce bounce rates.
2. Does site speed affect Google’s ranking?
Yes, site speed is a direct ranking factor for both desktop and mobile search results. If your site has optimum site speed, it is more likely to rank higher in search engine result pages (SERPs).
3. How to check page speed in Google Analytics?
In GA4, you can check page speed by creating a custom report in the Explore tab. Start a new exploration, select relevant dimensions like “Page Path,” and add metrics for page load time. This setup lets you analyze load times for specific pages, helping to identify areas needing optimization.
4. Does GA4 track site speed?
GA4 can track site speed, but it doesn’t have a dedicated “Site Speed” report like Universal Analytics. Instead, you can use the Explorations tool to set up custom reports that include page load metrics, helping you monitor page performance and identify slower pages.
5. Is Google Analytics site speed accurate?
Google Analytics 4 site speed data may not always be accurate because it relies on a sampling method, which only captures load times for about 1% of user sessions. This approach can lead to skewed results, especially if only a few sessions are sampled, potentially overemphasizing slower load times.
Final Thoughts: Site Speed in GA4
Tracking site speed in GA4 is essential for improving user experience, boosting SEO rankings, and enhancing conversion rates. Although GA4 lacks built-in site speed metrics, you can use custom setups with Google Tag Manager or explore alternative tools like Google Search Console, PageSpeed Insights, and Lighthouse to monitor performance.
By understanding and analyzing key metrics like page load time, GA4 empowers website owners to identify and optimize slower pages for faster load times. With these insights, you can make adjustments to improve site speed, helping your website engage visitors and maintain a competitive edge.
For an even more streamlined approach, you can also consider using tools like Analytify. As a Google Analytics plugin, Analytify simplifies data directly within your WordPress dashboard, including key performance metrics. With these tools, you can improve site speed, helping your website engage visitors. For further guidance on site search tracking visit our blog: Site Search Tracking in GA4.
Let us know in the comments if you have any questions!

