7 Best Website User Engagement Metrics in Google Analytics 4 (GA4)
Are your visitors engaging with your website, or just passing through? Understanding user engagement metrics is key to determining this. These metrics indicate how people interact with your website, revealing whether they’re reading your content, clicking on buttons, scrolling through pages, or watching videos.
In this guide, we’ll explore the 7 best website user engagement metrics in GA4 to help you improve your content and boost retention based on real user activity.
Let us get started!
User Engagement Metrics (TOC)
What is User Engagement & Why Track User Engagement in GA4?
User engagement refers to how visitors interact with your website or app. This includes actions like clicking links, scrolling, watching videos, or completing a form. Understanding these interactions helps you evaluate whether users find your content helpful, intuitive, and relevant to their needs.
Tracking engagement is important for website optimization, user experience, and conversions. For example, if users are quickly leaving a landing page or not scrolling past the header, it may indicate that your design or content isn’t meeting expectations.
Tracking engagement in GA4 helps you see what people actually do on your site. It shows things like clicks, scrolls, and how long someone stays on a page. You’ll know who’s really interested in your content and what’s keeping them around. Plus, it tracks users across devices, so you get the full picture. This information can help you improve your site and keep visitors coming back.
7 Best Website User Engagement Metrics in GA4
To optimize your website, improve user experience, and boost conversions, here are seven of the best engagement metrics in Google Analytics you should focus on:
1. Engaged Sessions
Engaged sessions are visits where users show meaningful interaction on your site. GA4 defines an engaged session as one that lasts at least 10 seconds, has two or more pageviews, or includes a conversion event such as submitting a form or completing a purchase.
To track engaged sessions in GA4, navigate to the Engagement report under Reports >>Engagement >> Overview or Pages and Screens report.
Here, you’ll see the total number of engaged sessions along with metrics like average engagement time and engagement rate. You can also create custom reports or set up segments to analyze engaged sessions in more detail.
Counting all sessions doesn’t always tell the full story. Some visitors might land on a page and leave immediately. Engaged sessions highlight users who truly interact with your content, helping you focus on quality traffic that’s more likely to convert, which is essential for improving user experience and driving conversions.
For wordpress users, Analytify brings engaged session data directly to your WordPress dashboard, making it easier to monitor engagement without diving into complex GA4 reports.
2. Average Engagement Time
Average engagement time is one of the most important user engagement metrics in GA4. It measures how long, on average, users stay actively engaged with your website or app during a session. This metric goes beyond just time spent on site. It captures active interaction, such as scrolling or clicking.
In GA4, you can find this metric under Engagement Overview and Pages and Screens reports. Look for “Average engagement time per session” to evaluate how users interact with your content.
A longer average engagement time often reflects higher-quality content and a better user experience. It signals visitors are not just landing on a page and bouncing, but genuinely engaging with your site. This makes it one of the best user engagement metrics to identify what’s working and what needs improvement on your website.
If you’re using WordPress, Analytify makes it even easier. With its seamless WordPress engagement tracking GA4 integration, it displays GA4 engagement metrics, such as average engagement time, directly inside your dashboard.
3. Events per User
Events per user track the average number of actions or interactions (events) performed by each visitor. Key events could include clicks, video plays, downloads, or any tracked user interaction.
Navigate to Reports >> Engagement >> Events to view event data. To calculate events per user, divide total events by total users or use the custom reports feature in GA4 for a more detailed breakdown.
This metric reveals how actively users interact with your site beyond just viewing pages. A higher number means users engage more deeply, indicating a stronger connection with your content.
For wordpress users, Analytify simplifies event tracking by automatically displaying key event metrics, helping WordPress users understand user interactions without manual setup.
4. Bounce Rate vs. Engagement Rate
When it comes to user engagement metrics, understanding the difference between bounce rate and engagement rate is essential. Bounce rate refers to the percentage of sessions where users leave your website after viewing only one page, which is a negative indicator of user experience.
Engagement rate in GA4 focuses on Engaged sessions where users actively interact with your content, such as scrolling, clicking, or spending a certain amount of time.
To track this in GA4, head to Reports >> Engagement >> Pages and screens report to compare both metrics. This comparison provides valuable insights into website user engagement metrics and visitor intent.
Not all one-page visits are bad. Someone might read an entire blog post and leave, which still shows interest. That’s why the engagement rate is more useful than just looking at the bounce rate.
It helps you understand how users actually interact with your site, especially on pages where users scroll a lot or don’t need to click to engage. This shift makes engagement rate one of the top user engagement metrics in the GA4.
If you’re using WordPress, Analytify simplifies WordPress engagement tracking by displaying bounce and GA4 engagement metrics directly in your dashboard, making WordPress user engagement analytics easy to understand at a glance.
5. Page Views per Session
Page views per session is one of the top user engagement metrics that helps you understand how deeply users interact with your content. Page views per session measures the average number of pages a user views during a single session, offering insights into browsing patterns and content interest.
To track this metric in GA4, head to Reports >> Engagement >> Pages and Screens.
You can also create custom explorations that combine session counts and page views to get a clearer picture of user interaction.
Higher page views per session typically indicate engaging content, smooth site navigation, and effective internal linking, key factors that enhance the overall user experience. Among the best user engagement metrics, this one reveals how well users are guided through your site.
If you’re a WordPress user, Analytify simplifies this process. With built-in WordPress engagement tracking GA4, it shows pageviews per session right on your dashboard. This makes WordPress user engagement analytics more accessible, allowing you to monitor key GA4 engagement metrics without switching platforms.
6. Scroll Depth Tracking
Scroll depth is one of the top user engagement metrics that tells you how far down a page visitors scroll, usually measured in percentages, like 25%, 50%, or 90%. This type of tracking helps you understand whether users are truly engaging with your content or dropping off halfway through the page.
In GA4, scroll tracking is built in. GA4 automatically records a scroll event when a user reaches 90% of a page. You can view this data by going to Reports >> Engagement >> Events.
There, you’ll see how scroll depth fits into your GA4 engagement metrics and how it complements other important metrics to measure user engagement.
This helps you understand if users consume your content fully or drop off early in long-form blog posts, product pages, or landing pages, where your goal is to keep users interested until the end.
For WordPress users, Analytify makes this even simpler. With its WordPress engagement tracking GA4 integration, you can easily view scroll depth and other website user engagement metrics right inside your dashboard.
7. Video Engagement (Video Views, Completion Rates)
Video engagement shows how many users are watching your videos and how much of those videos they actually complete. This includes key metrics like video views and completion rates.
In GA4 engagement metrics, video interactions are tracked as events. If you’re using YouTube and it’s properly integrated with GA4, video play and completion events are tracked automatically.
Otherwise, you can set them up manually as custom events. These events will show up in your GA4 Events report, giving you insights into how users engage with your video content.
Video is one of the most engaging content formats available today. Understanding if users watch videos fully or drop off early helps you optimize video content for better engagement and conversions. That’s how it can help you improve your content.
For WordPress users, Analytify makes this process simple. With built-in WordPress engagement tracking GA4 support, it pulls in key video stats so you can access them easily.
How to Use Engagement Metrics for Website Optimization
Understanding user engagement metrics can help you improve your website, make better content, and guide visitors toward taking action. Here’s how to use these insights effectively:
Refine Your Website Content
- Look at metrics like average engagement time, events per user, and scroll depth to see what type of content keeps users interested.
- Identify top-performing pages and create more content like them. These are Analytify, which turns complex data into easy-to-understand reports.
- It’s especially helpful if you’re focusing on WordPress engagement tracking with GA4 or looking for accurate user interaction tracking in WordPress.The topics your audience cares about.
- For pages with low engagement, try updating headlines, simplifying text, or adding visuals to make them more appealing.
Optimize the User Journey
- Use page views per session and engaged sessions to understand how users move through your site.
- If visitors are dropping off on a certain page, consider changing the layout, adding a clear CTA (call to action), or reducing page load time.
- Check which buttons or links users click on using event tracking in GA4. This helps you place important elements where users actually engage.
Boost Conversions with Targeted Changes
- Engagement data can highlight what’s working in your conversion funnel and what’s not.
- For example, if users spend time on a pricing page but don’t convert, maybe it’s time to clarify your offer or add testimonials.
- Improve forms, landing pages, or checkout flows by analyzing where users stop engaging or exit the page.
Improve User Retention
- Metrics like returning users and engagement rate show how often visitors come back.
- If certain content brings people back, add related posts or videos to keep them around longer.
- Set up email signups, loyalty offers, or personalized content based on what users engage with most.
By regularly checking your metrics to measure user engagement, you’ll better understand your audience and grow your website.
Integrating WordPress with Analytify for Better Engagement Tracking
Tracking how users interact with your WordPress site is essential for improving performance, and with Google Analytics 4 (GA4), you get more advanced engagement data than ever. But setting it up manually can be confusing. That’s where Analytify comes in.
Join 50,000+ beginners & professionals who use Analytify to simplify their Google Analytics!
Analytify is a WordPress plugin that makes it super easy to connect your site with GA4, and no coding or technical skills are required. Once connected, it brings your GA4 engagement metrics right into your WordPress dashboard in a clean, visual format.
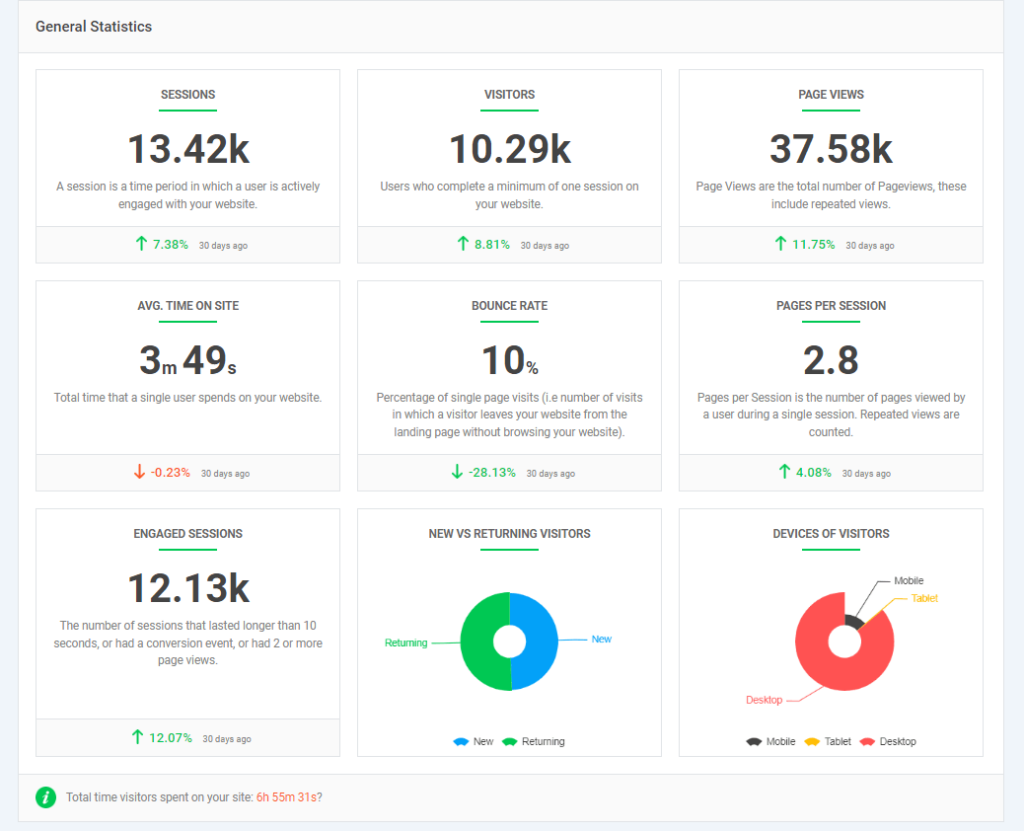
Analytify provides a comprehensive suite of engagement metrics. Key metrics include Sessions, Visitors (Users), and Page Views to view overall activity. It also measures Avg. Time on Site, Bounce Rate, and Pages per Session for basic interaction analysis.
More advanced metrics like Engaged Sessions and Engagement Rate, New vs. Returning Visitors, Devices of Visitors, and Scroll Depth are all presented within the WordPress dashboard to simplify data interpretation and aid in optimizing content and marketing strategies.
This helps you quickly understand what’s working on your site and what needs improvement, without having to switch back and forth between GA4 and WordPress.
Utilize them to enhance content, refine conversion paths, and increase user retention. So, Analytify is one of the best tools for integrating GA4 into WordPress.
Website User Engagement Metrics (FAQs)
1. What is an example of a user behavior metric in GA4?
An example of a user behaviour metric is events per user, which tells how often users interact with your site, like clicking buttons, watching videos, or scrolling. It gives you insight into how active and engaged each visitor is on your site.
2. What is a good engagement rate for GA4?
A good engagement rate in GA4 is generally 50% or higher, but it can vary based on industry and content type.
3. What is WordPress user engagement analytics?
WordPress user engagement analytics shows how visitors interact with your site, like how long they stay, what they click, or how many pages they view. It helps you understand what content keeps people interested so you can improve their experience and boost conversions.
4. How can I track user interaction on my WordPress site?
You can easily handle user interaction tracking in WordPress by using plugins like Analytify. It connects your site to Google Analytics 4 and shows key engagement data like clicks, scrolls, and pageviews right inside your WordPress dashboard.
5. What are GA4 engagement metrics for WordPress sites?
For WordPress, GA4 tracks metrics like average engagement time, events per user, and scroll depth through integrated plugins.
Final Thoughts: User Engagement Metrics
In this guide, we’ve explored seven key ways to see how people interact with your site using GA4. We started by explaining user engagement and why it matters to improve your website.
We explained user engagement metrics like Events per User, Engagement Rate, Page Views per Session, Scroll Depth, and Video Engagement. Each of these helps you understand how people interact with your site and content.
Ultimately, we shared tips on using this data to improve your content, make your site easier to use, and boost conversions. No matter what type of website you have, a blog, online store, or business site, tracking these metrics in GA4, especially with the help of a plugin like Analytify, can drive real results.
For further guidance, read these articles:
Which engagement metric do you find most useful? Share with us in the comments below!


