How to Find and Analyze Bounce Rate On Google Analytics 4 (GA4)

GA4 shows bounce rate under Reports > Life Cycle > Engagement > Overview. You can also add it as a metric to the Pages and Screens report. GA4 doesn’t show bounce rate by default; it focuses on engaged sessions instead.
Bounce rate measures single-page sessions where a visitor leaves without interacting further. It’s been a core Google Analytics metric for years.
GA4 doesn’t surface bounce rate as prominently as Universal Analytics did. It centers reporting on engaged sessions instead. The metric still exists, you just need to know where to look.
This guide covers three things: what bounce rate means in GA4, how it differs from Universal Analytics, and the steps to add it to your reports.
Bounce Rate in Google Analytics 4 (TOC):
What is Google Analytics Bounce Rate?
Bounce rate reflects the share of visitors who leave after one page. In short, it shows visitors who land and leave without further interaction.
Imagine your website as a store. Bounce rate is the share of visitors who browse one aisle and leave without exploring further.
A high bounce rate can signal several things:
- The landing page content might be irrelevant to the visitor’s search intent.
- The page might be slow to load, leading to frustration and abandonment.
- Navigation might be unclear, making it difficult for visitors to find what they want.
Your bounce rate reveals user engagement and flags areas to improve on your site.
Difference between Bounce Rate in GA4 and UA
Universal Analytics (UA) is the older version of Google Analytics, since replaced by GA4.
In UA, bounce rate measures single-page sessions where users leave without interacting.
UA and GA4 calculate and report this metric differently.
Bounce Rate in Universal Analytics (UA)
In Universal Analytics, the bounce rate is defined as:
“The percentage of sessions where users only visit a single page and trigger no additional requests to the analytics server.”
If a user leaves after one page with no other action, that session counts as a bounce. Actions include a click, form submission, or second page view.
High bounce rates can signal issues with content, user experience, or traffic relevance.
How do you calculate the Bounce rate in Universal Analytics (UA)?
Use this formula to calculate bounce rate in Universal Analytics:
Bounce Rate = (Single Page Sessions ) / (Total Sessions) x 100
Where:
- Single-Page Sessions: The number of sessions during which users viewed only one page and triggered no additional requests.
- Total Sessions: The total number of visits to your website within a specific timeframe.
Interpreting Bounce Rate:
- A high bounce rate isn’t always negative. It depends on the context. For example, blog posts or informational pages may bounce higher as users get the information they need and leave without further interaction.
- Conversely, high bounce rates on product or checkout pages can indicate issues that need addressing.
Bounce Rate in Google Analytics 4 (GA4)
GA4 approaches this metric differently. It introduced Engagement Rate, essentially the inverse of the traditional bounce rate.
First of all, we will discuss it:
“Engagement rate is the percentage of engaged sessions on your website.”
Instead of focusing on bounce rate, GA4 focuses on “engaged sessions”. An engaged session in GA4 has to meet these criteria:
- A session that lasts longer than 10 seconds
- has a conversion event
- has two or more page views.
So here, the GA4 bounce rate is defined as:
“ Percentage of sessions which are not engaged is called the GA4 bounce rate.”
Conditions that consider a session a bounce are:
- A session that lasts less than 10 seconds.
- If a visitor triggers no conversion event during his visit.
- Sessions with only one page or screen view.
These count as bounces unless a session-duration, conversion, or page-view threshold is met. A visitor who stays over 10 seconds or converts won’t count as a bounce.
How to Calculate the Engagement Rate in Google Analytics 4 (GA4)?
Here’s the formula to calculate engagement rate in GA4:
Engagement Rate = (Engaged Sessions/Total Sessions) × 100
How to Calculate the Bounce Rate in Google Analytics 4 (GA4)?
A higher engagement rate means a lower bounce rate. To get bounce rate in GA4, use the complement of the engagement rate:
GA4 Bounce Rate= 100% − Engagement Rate
Interpreting Engagement Metrics
GA4 engagement metrics show how users interact with your site, beyond just bouncing.
- Low Engagement Rate: Indicates potential content, user experience, or traffic quality issues.
- High Engagement Rate: Suggests that users find value and engage with your site or app.
Use that to improve user experience, optimize content, and boost engagement.
| Criterion | Counts as an Engaged Session? |
|---|---|
| Session lasts 10 seconds or longer | Yes |
| Session includes 1 or more conversion events | Yes |
| Session includes 2 or more page or screen views | Yes |
| Visitor leaves in under 10 seconds with no conversion or second view | No, counted as a bounce |
Summary of Difference between Bounce Rate in UA and GA4
| Difference key points | Universal Analytics ( UA ) | Google Analytics 4 (GA4) |
| Definition: | Bounce Rate is based on single-page sessions with no further interactions. | Bounce Rate (not directly reported, but inferred) is based on the lack of an engaged session. |
| Engagement Criteria: | Any interaction or a visit to another page negates a bounce. | An engaged session is defined by more criteria (lasting longer than 10 seconds, conversion event, or multiple page views). |
| Focus on Engagement: | Focuses on what counts as a non-engagement (bounce). | Focuses on what counts as engagement, with more nuanced criteria. |
| Reporting Changes: | Bounce rate is a prominent metric. | The bounce rate is not directly reported; engagement metrics are more emphasized. |
| Actionable Insights: | High bounce rates can highlight pages that might be performing poorly or not meeting user expectations. | Engagement metrics provide a more comprehensive understanding of user interactions with low engagement, prompting a different approach to optimization. |
How to Find Bounce Rate on Google Analytics 4?
GA4 doesn’t display bounce rate on the front end like Universal Analytics did. But the data is still there, once you know where to look.
Here’s a step-by-step guide for adding bounce rate to standard GA4 reports. Use it to analyze user behavior and optimize your site.
| Location | How to Access |
|---|---|
| Pages and Screens report | Reports, Life Cycle, Engagement, Pages and Screens, add Bounce Rate as a metric |
| Traffic Acquisition report | Reports, Life Cycle, Acquisition, Traffic Acquisition, add Bounce Rate as a metric |
| Explore reports | Explore, Free form, add Bounce Rate as a metric |
| Analytify dashboard (WordPress) | Analytify, Overview, inside your WordPress admin, no separate GA4 login needed |
How to Add Bounce Rate in Google Analytics 4 Standard Reports?
GA4 reports don’t show bounce rate by default; you must customize them.
Pages and Screens Report
Here are those same six steps in detail, with screenshots, for Pages and Screens.
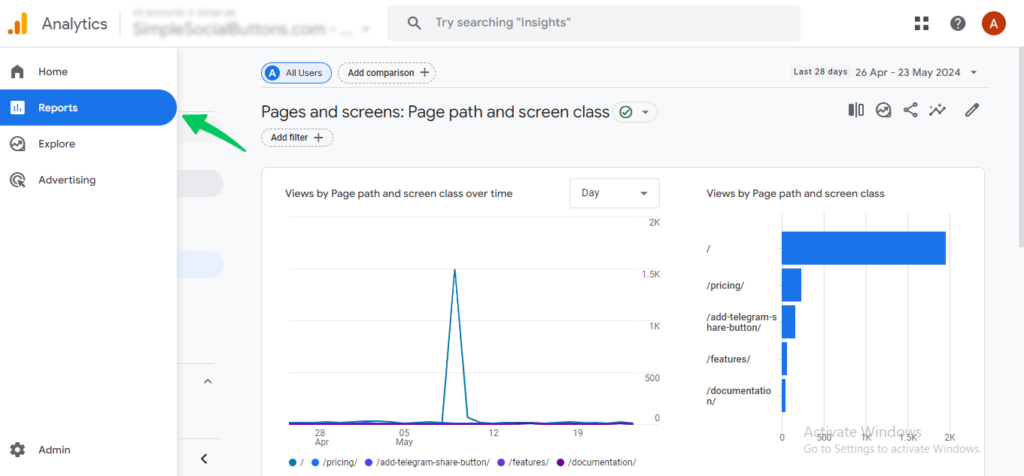
Step 1: Accessing the Report
Choose the “Reports” tab below the “Home” tab.
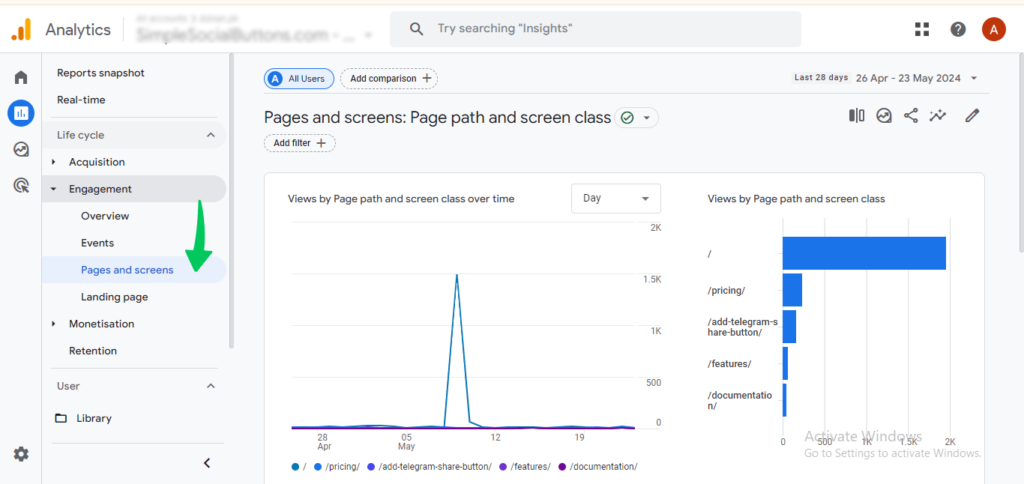
Step 2: Engagement Option
Select the “Engagement” option from the sidebar menu. Navigate to the specific report you want to analyze. From here, we’ll use the “Pages and screens” option.
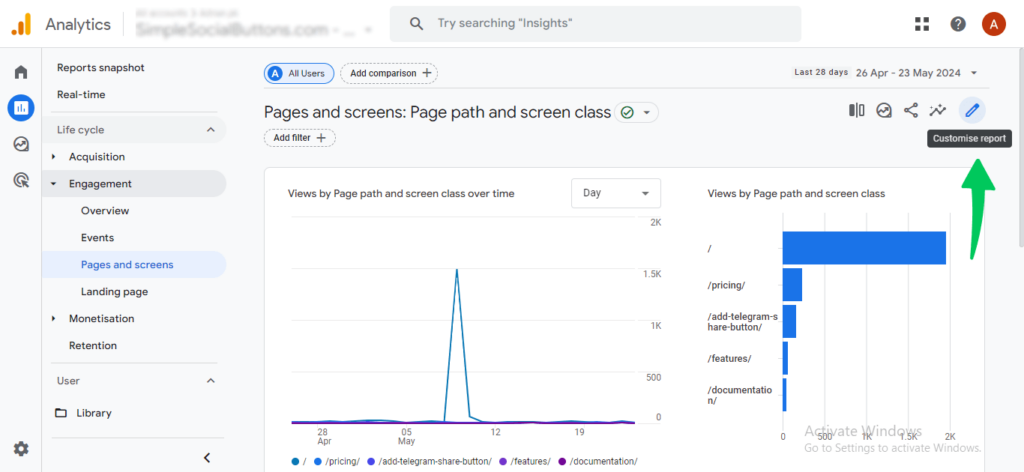
Step 3: Customizing the Report
Click the “Pen” icon in the report window’s top right corner. This icon is for “Customize report”. This opens a sidebar where you can modify the data displayed.
Step 4: Adding Bounce Rate
In the “Report data” section of the sidebar, click on “Metrics”. Here, you’ll see a list of available metrics.
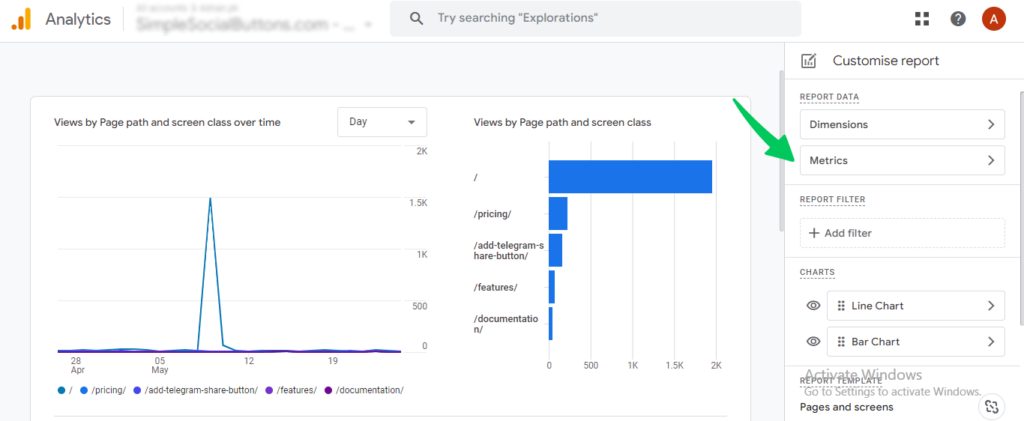
- Click on the bottom “ Add metric” option.
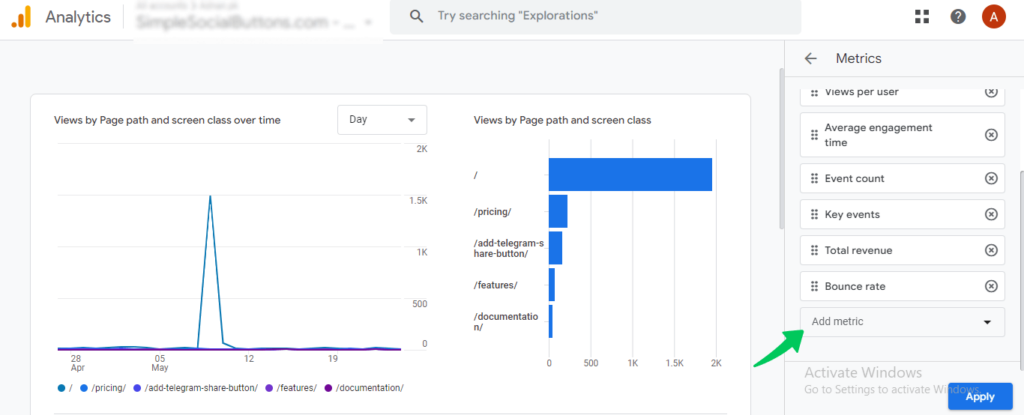
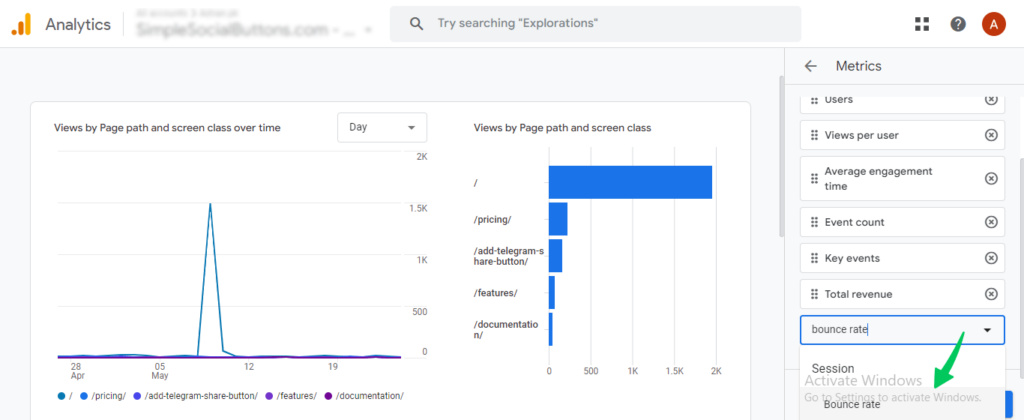
- Start typing “bounce rate”. Once it appears, select the “Bounce rate” metric.
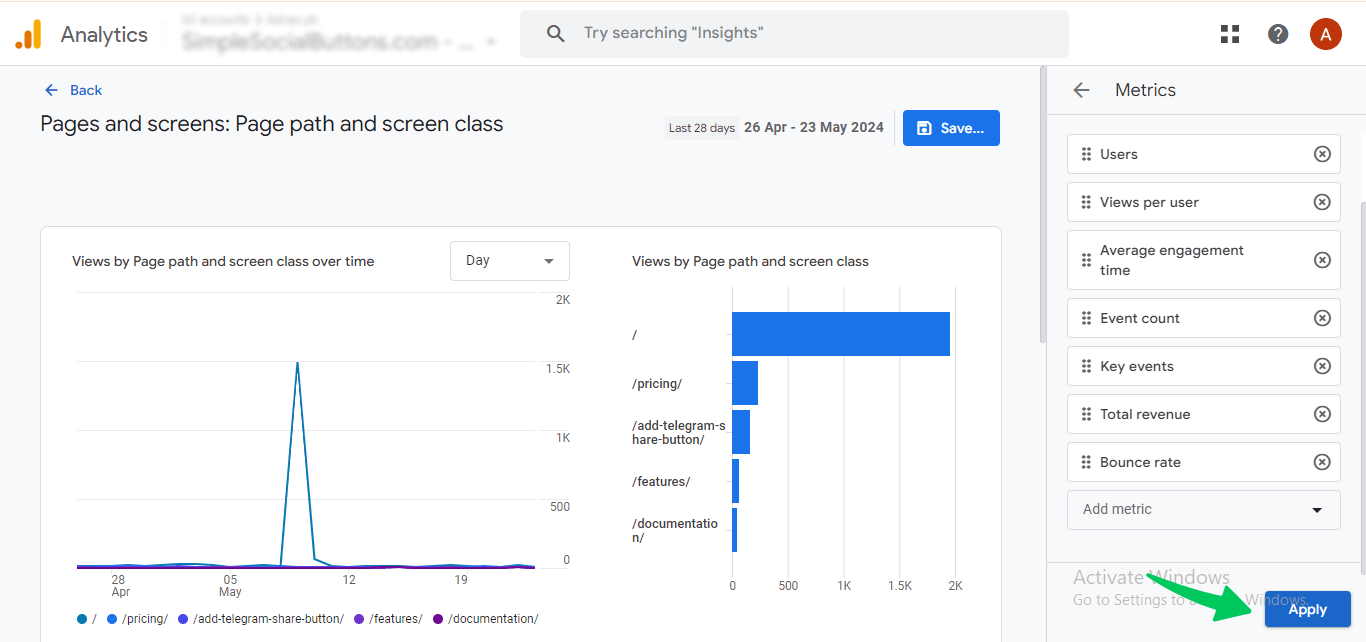
Step 5: Choose Apply
The bounce rate will be added to the list of Metrics. Click the “Apply” button at the bottom of the sidebar.
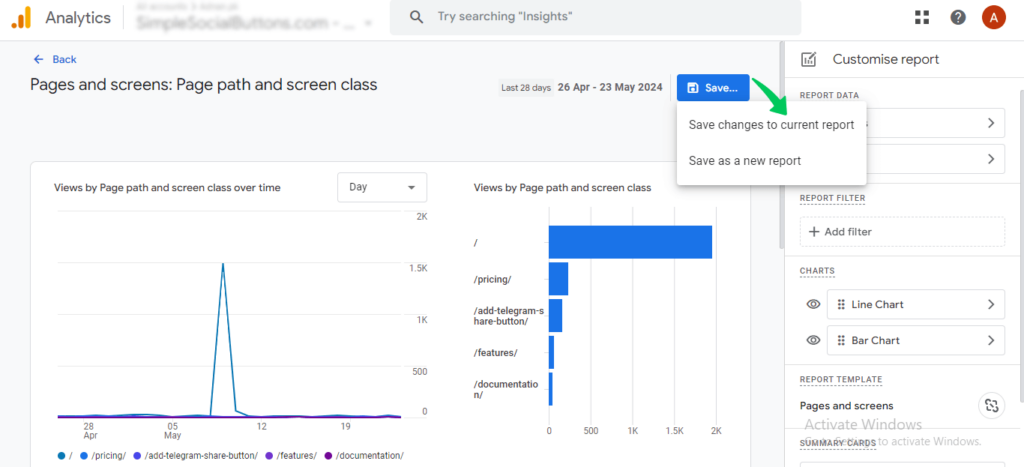
Step 6: Saving the Customization
Click “Save” and choose “Save changes to current report.” This creates a personalized report with the added bounce rate metric.
Traffic Acquisition Report
Here’s the step-by-step guide to find bounce rate in GA4 for the Traffic Acquisition Report:
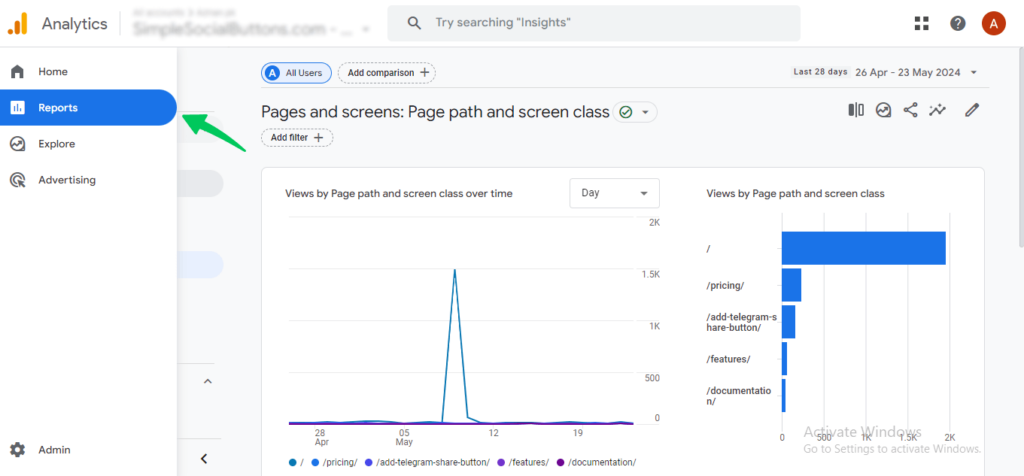
Step 1: Accessing the Report
Choose the “Reports” tab below the “Home” tab.
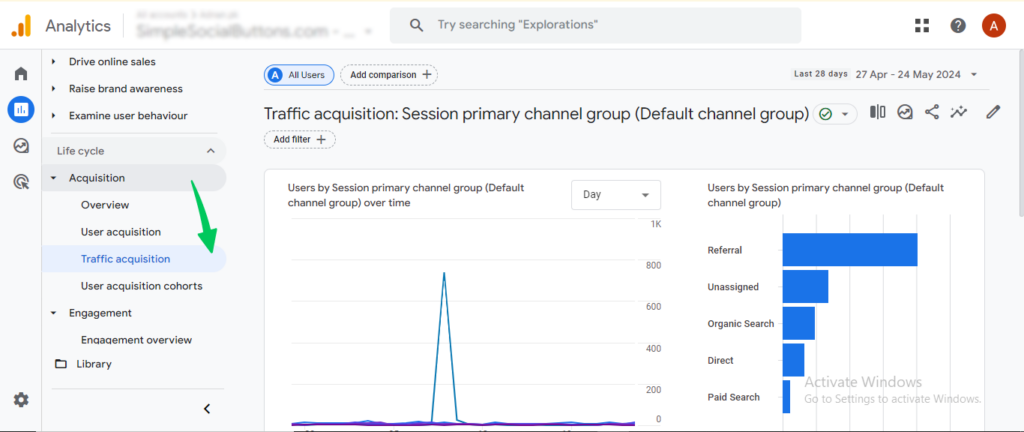
Step 2: Choose the Traffic Acquisition Report
Select the “ Acquisition ” Tab from the sidebar menu. We’ll use the “Traffic Acquisition” option from here.
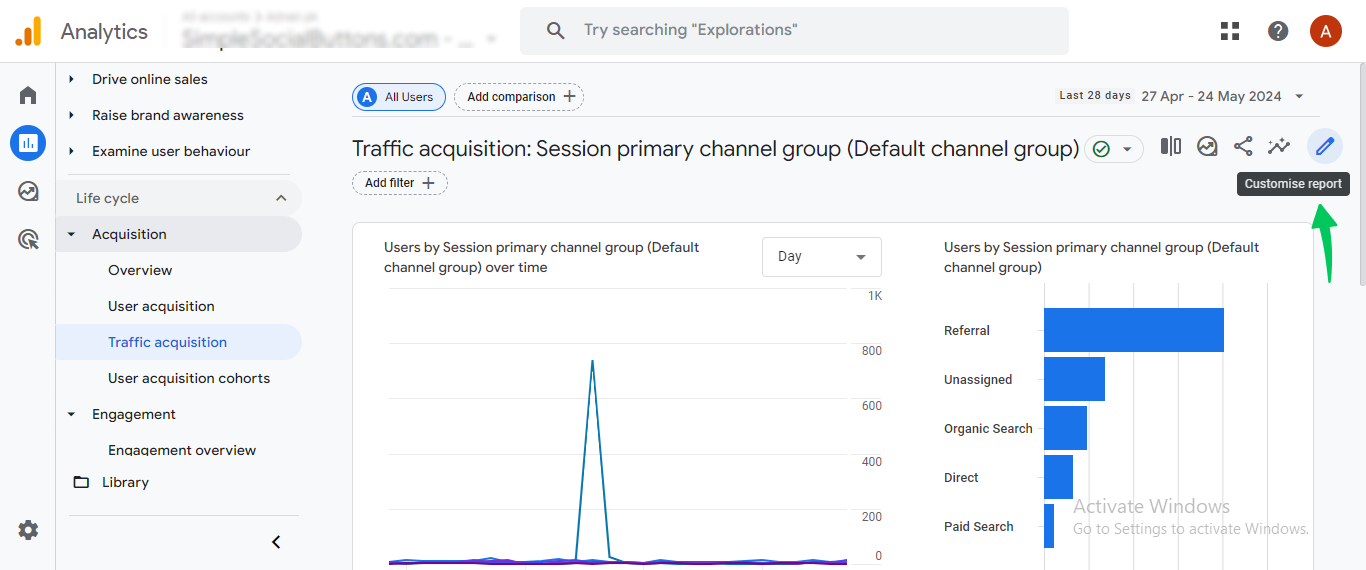
Step 3: Customizing the Report
Click the “Pen” icon at the top right of the report window; it’s for “Customize report.” This opens a sidebar to modify the data shown.
Step 4: Choose Metrics
In the “Report data” sidebar section, click “Metrics”.
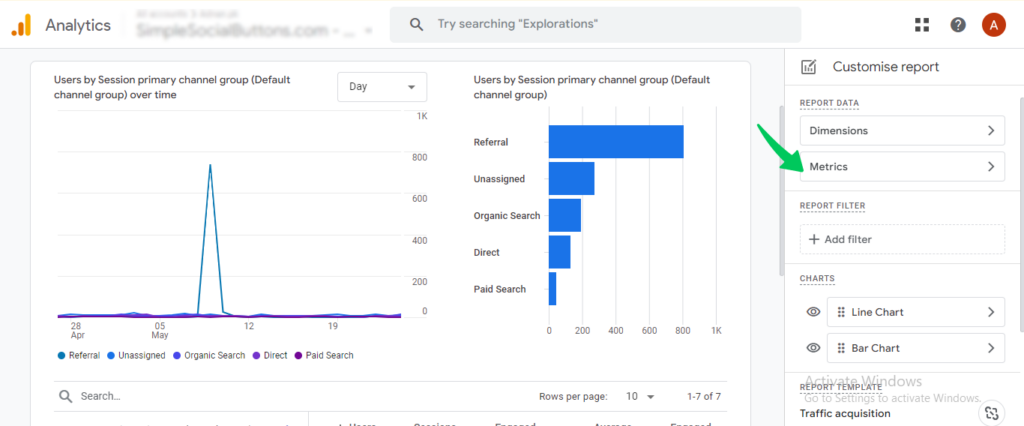
Step 5: Adding Bounce Rate
Here, you’ll see a list of available metrics. Click on the “ Add metric” option at the bottom.
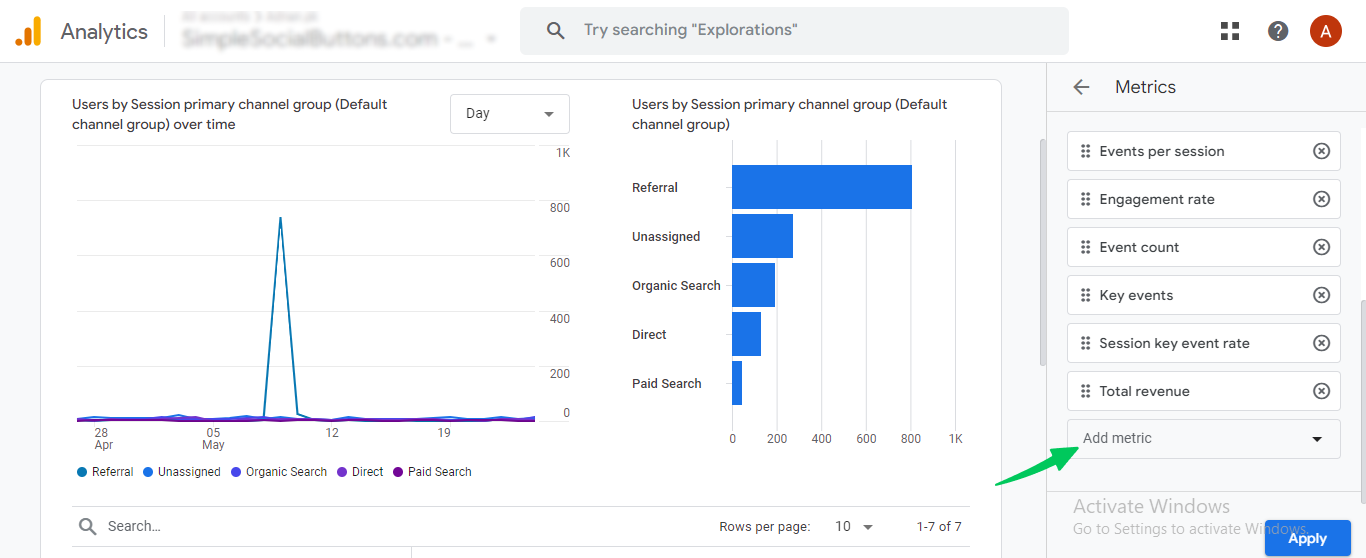
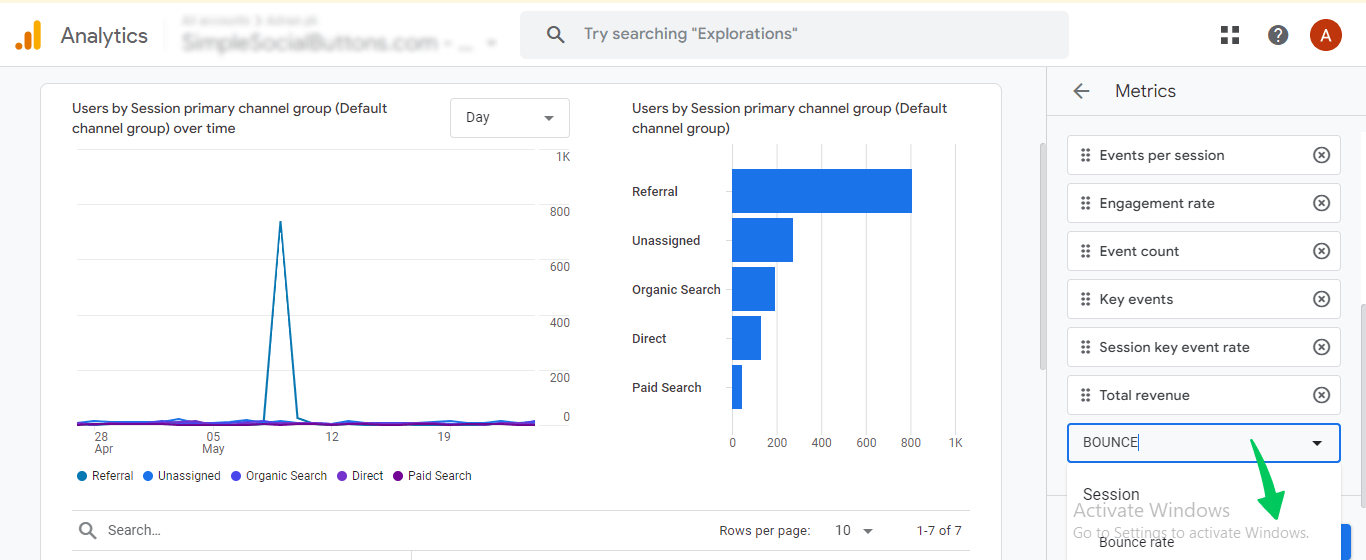
- Start typing “bounce rate.” Once it appears, select the “Bounce rate” metric.
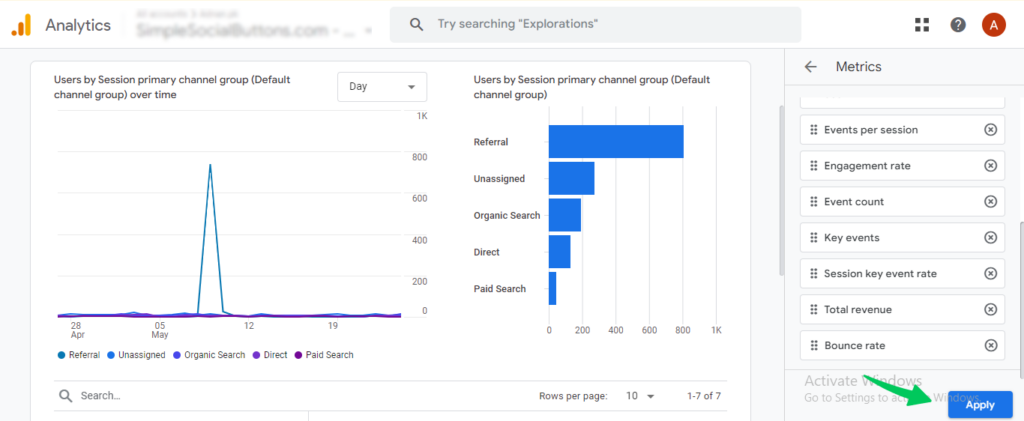
The bounce rate will be added to the Metrics list. Click the “Apply” button at the bottom of the sidebar.
Step 6: Saving the Customization
Click “Save” and choose “Save changes to the current report.” This creates a personalized report with bounce rate.
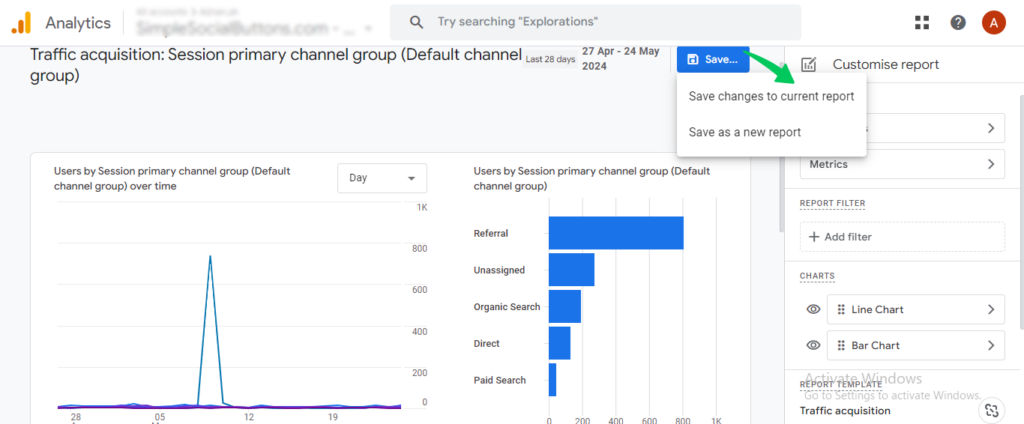
These steps reveal valuable bounce rate insights in your GA4 reports. A lower bounce rate generally means a more engaged user experience.
How to Find Bounce Rate in WordPress?
The previous section covered finding bounce rate in GA4. On a WordPress site, you can see bounce rate right in your WP dashboard, alongside your other stats.
Analytify is the best Google Analytics plugin for viewing performance right inside WordPress. It’s a one-stop solution for a full view of your site.
Join 50,000+ beginners and professionals using Analytify to simplify Google Analytics!
It shows visitors, page views, time on site, bounce rate, and engaged sessions.
How to Check Bounce Rate and Other Metrics in the Analytify Dashboard?
To check bounce rate in the Analytify dashboard on WordPress, follow these steps:
1. Log in to Your WordPress Admin Panel
- Enter your username and password to access the WordPress dashboard.
2. Install and Activate Analytify
- From the left sidebar, click on the Plugins tab. Choose “ Add new plugin.”
- Search Analytify in the search bar, install the Analytify plugin, and then activate it.
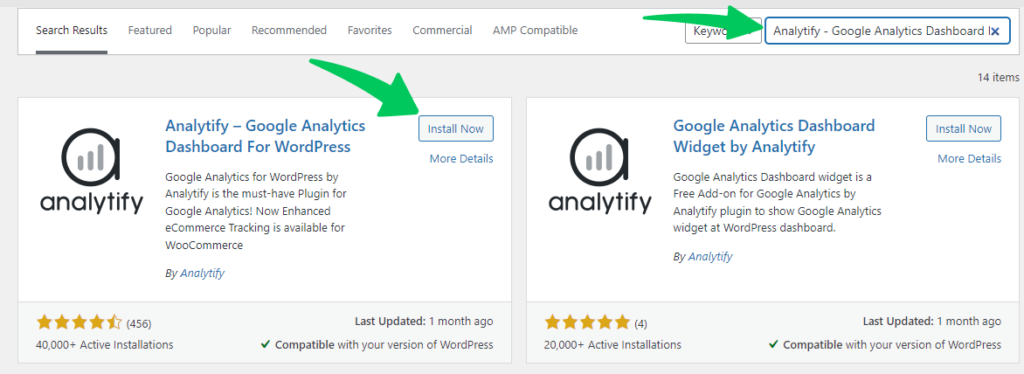
- For all the advanced features, install Analytify Pro.
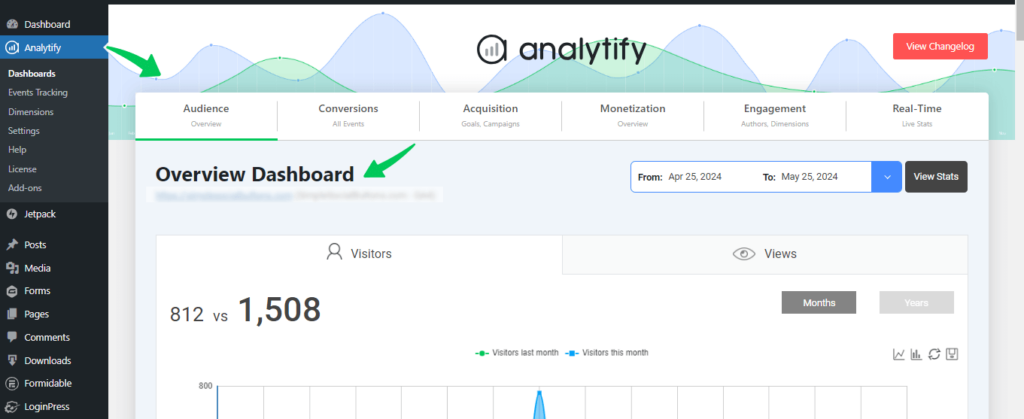
3. Navigate to the Analytify Dashboard
- In the left-hand menu of your wp-admin, click on “Analytify.”
- This will open the Analytify dashboard.
4. View Your Dashboard
- On the Analytify dashboard, you will see various analytics reports.
- Look for the “Overview” or “Dashboard” tab where key metrics are shown.
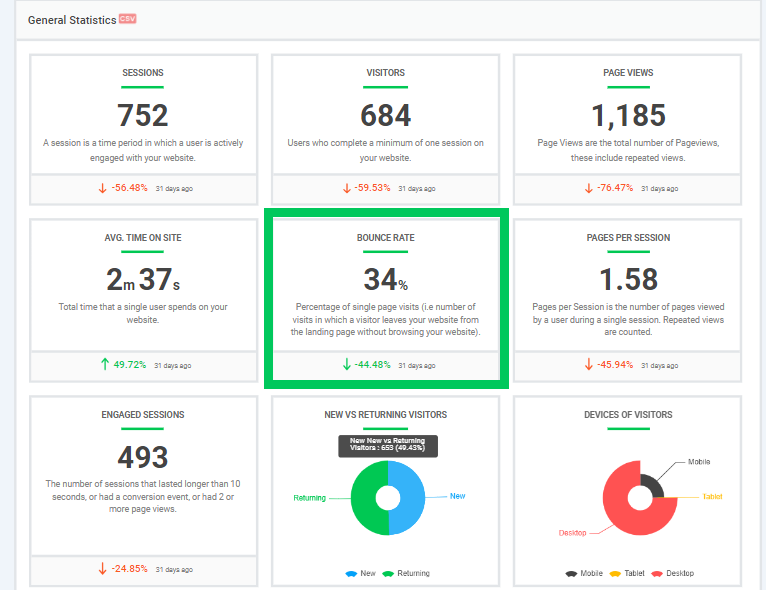
5. Find the Bounce Rate
The overview section shows bounce rate, sessions, users, page views, and average session duration.
GA4 Bounce Rate FAQs
1. What does bounce rate mean?
It’s the percentage of visitors who leave after one page with no other action. A high homepage bounce rate often points to design, content, or relevance issues.
2. Does Google Analytics 4 have a bounce rate metric?
GA4 favors engagement rate over bounce rate. Bounce rate here is unengaged sessions divided by total sessions.
3. What is a good engagement rate in Google Analytics?
A good engagement rate varies by product, industry, and audience. Experts put it at 1% to 5% on social media, 60% to 70% on websites.
4. Where is bounce rate in Google Analytics 4?
Go to Reports, open the report, click Customize report, then Metrics, and add Bounce rate. See the full walkthrough with screenshots earlier in this guide.
5. What is a reasonable bounce rate in Google Analytics?
A bounce rate under 40% is generally good; over 55% signals room to improve. Most sites average between 26% and 70%, depending on industry, content, and traffic source.
6. How do I add bounce rate to a GA4 report?
Open a report like Pages and Screens and click the pencil (Customize report) icon. Select Metrics, choose Bounce Rate, then click Apply and Save.
7. Can I see bounce rate without leaving WordPress?
Yes. With Analytify installed, bounce rate and other GA4 metrics show right on your WordPress dashboard, no separate GA login needed.
8. Does a high bounce rate always mean a problem?
No. A high bounce rate on a blog post or contact page can be normal. It’s more concerning on pages meant to drive action, like product or landing pages.
9. Why isn’t bounce rate showing up in my GA4 reports?
Bounce rate doesn’t show in GA4 by default; Google made engagement rate the primary metric instead. Add it manually as a column in Pages and Screens or Traffic Acquisition. Or view it automatically in the Analytify dashboard.
Bounce Rate in Google Analytics 4: Final Thoughts
This guide covered finding bounce rate in GA4 and how it differs from UA.
Bounce rate reflects how engaging your site is to visitors, but it’s only one metric. Check engagement time and conversion rates too, for a fuller view of site performance.
There’s more to explore. WordPress plugins like Analytify Pro show website performance metrics directly in your dashboard.
What is your preferred analytics metric for understanding your website’s performance? Please share your choice in the comments below.