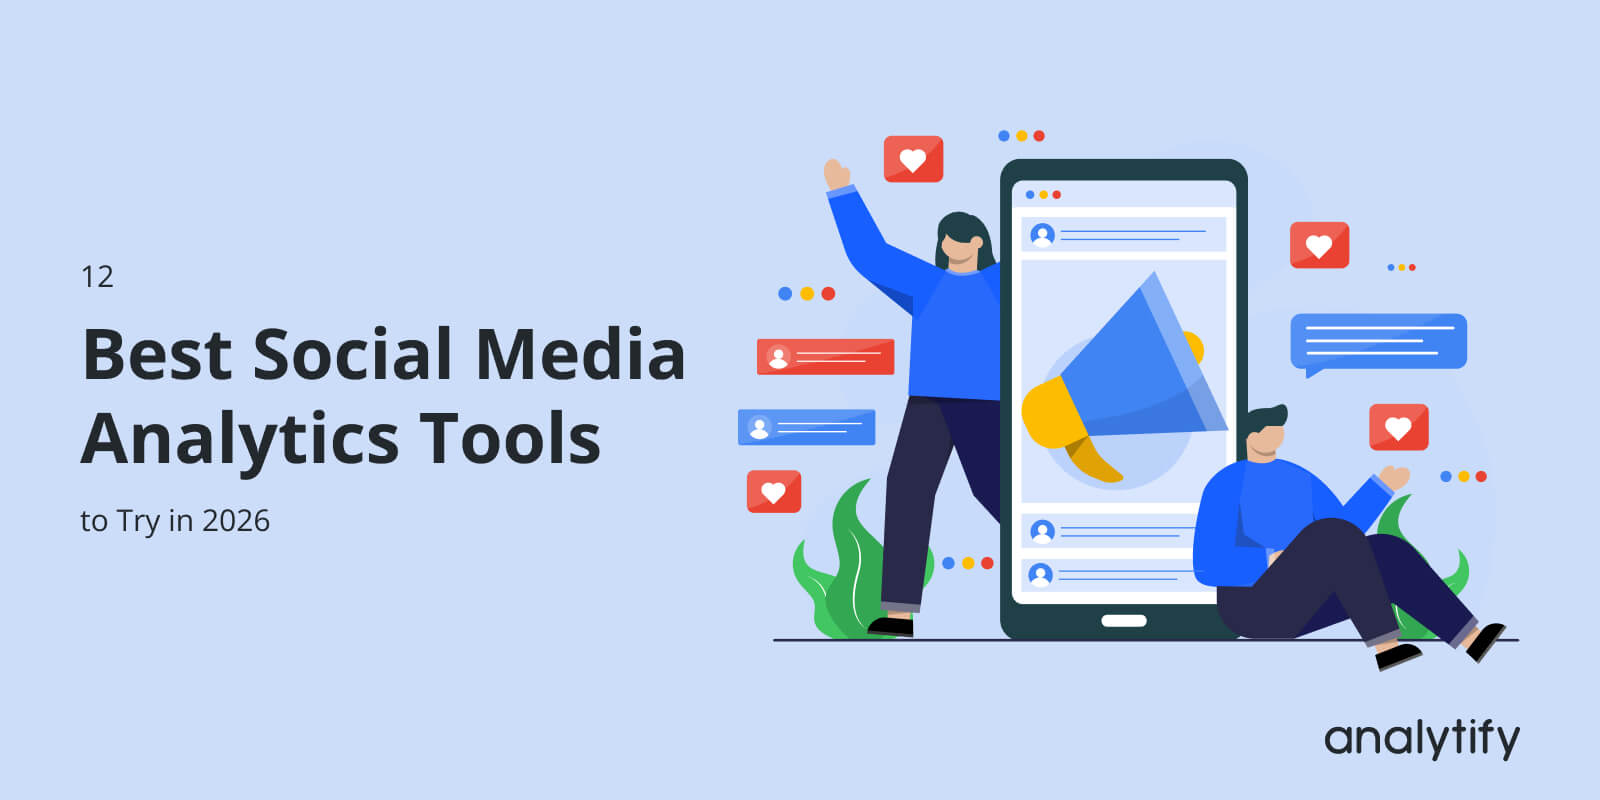
12 Best Social Media Analytics Tools (Free + Paid)

Reporting season arrives, and you can show reach, likes, and follower growth. What you cannot show is whether any of it produced a visitor, a lead, or a sale.
The best social media analytics tools in 2026 are Meta Business Suite Insights, LinkedIn Page Analytics, YouTube Studio, TikTok Analytics, Buffer, Metricool, Hootsuite, Sprout Social, and Brandwatch, paired with Google Analytics 4, Analytify, and Looker Studio for the website side of the funnel.
This guide covers all 12 social media analytics tools, with real prices, who each is best for, and an honest limitation for each pick. It also covers the step most roundups skip: connecting a social click to what that visitor did on your site.
Social Media Analytics Tools (TOC):
What Are Social Media Analytics Tools?
Social media analytics tools are software that collect and report performance data from social platforms, including reach, engagement, follower growth, and link clicks. They pull this data from each platform’s own API and present it as dashboards and trend charts. Their visibility ends the moment someone clicks a link.
There are three subtypes, and most people use more than one:
- Native platform dashboards. Built into Facebook, Instagram, LinkedIn, YouTube, and TikTok. Free, accurate, and limited to one platform each.
- Third-party cross-platform tools. Pull several accounts into one report. Usually paid, usually bundled with scheduling.
- Social listening tools. Track brand mentions and sentiment across social and the wider web. Priced for enterprise budgets.
Each of these three kinds of social media analytics tools answers a different question. None answers what happened after the click.
What’s the Difference Between Social Media Analytics and Website Analytics?
Social media analytics measure what happens on the social platform, while website analytics measure what happens after someone clicks through to your site. Both are necessary. Neither replaces the other.
Here’s the thing: it makes more sense as one visitor than as two categories.
Someone scrolls Instagram and sees your post. Instagram logs the impression, the save, and the profile visit. They tap your link. From that moment, Instagram knows nothing. Google Analytics 4 picks up a session, records the landing page, and tracks whether that person read one recipe or signed up.
Two tools. One person. One handoff.
| Social media analytics | Website analytics | |
|---|---|---|
| Measures | Impressions, reach, engagement, follower growth, link clicks | Sessions, landing pages, engagement time, events, conversions |
| Data source | Each platform’s own API | Your site’s tracking code, usually GA4 |
| Visibility ends | At the click | At the exit |
| Answers | Did the post perform? | Did the visitor do anything? |
| Typical cost | Free natively, paid for cross-platform | Free with GA4 |
What falls into that gap is the part that matters most. Which page they landed on. How long they stayed. Whether they did the thing you wanted.
Most reporting never crosses that gap. That is a habit problem, not a tooling problem.
How Did We Choose These Social Media Analytics Tools?
We selected these social media analytics tools on five criteria: whether a usable free tier exists, whether pricing is published rather than quote-only, which platforms each one actually covers, whether the tool reports anything after the click, and what each one cannot do. Every entry below lists that last point openly, because a roundup that only lists strengths is a sales page.
Two decisions are worth naming. First, native platform dashboards are ranked first rather than buried, because for most readers they are the correct answer and they cost nothing. Second, three website-side tools sit in a list of social media analytics tools on purpose: reach and engagement are only half of the question, and no social platform can report the other half.
Prices were checked in August 2026 and are listed as published by each vendor. Vendors change pricing often, so treat every figure here as a starting point and confirm on the vendor page before you buy.
What Are the Best Social Media Analytics Tools in 2026?
The best social media analytics tools in 2026 are Meta Business Suite Insights, LinkedIn Page Analytics, YouTube Studio, TikTok Analytics, Buffer, Metricool, Hootsuite, Sprout Social, and Brandwatch, paired with Google Analytics 4, Analytify, and Looker Studio for the website side of the funnel.
The list of social media analytics tools runs free native dashboards first, then website-side tools, then paid platforms. Prices were checked in August 2026 and change often.
Some links in this article are affiliate links. This does not affect which tools we include or how we rate them.
| # | Tool | Category | Best for | Free tier | Starting price | Covers post-click behavior |
|---|---|---|---|---|---|---|
| 1 | Meta Business Suite Insights | Native | Facebook + Instagram | Yes | Free | No |
| 2 | LinkedIn Page Analytics | Native | B2B pages | Yes | Free | No |
| 3 | YouTube Studio Analytics | Native | Video retention | Yes | Free | No |
| 4 | TikTok Analytics | Native | Short-form video | Yes | Free | No |
| 5 | Google Analytics 4 | Website-side | Traffic + conversions | Yes | Free | Yes |
| 6 | Analytify | Website-side | GA4 data inside WordPress | Yes | $99/year | Yes |
| 7 | Looker Studio | Website-side | Custom combined reports | Yes | Free | Yes |
| 8 | Buffer | Cross-platform | Scheduling + light reporting | Yes | $5/channel/mo | No |
| 9 | Metricool | Cross-platform | Small budgets, benchmarking | Yes | $20/mo | No |
| 10 | Hootsuite | Cross-platform | Teams needing custom reports | No | $99/user/mo | No |
| 11 | Sprout Social | Platform | Larger teams, reporting + listening | No | $79/seat/mo | No |
| 12 | Brandwatch | Platform | Listening and sentiment | No | Quote only | No |
That final column is the honest one. Only three of these twelve social media analytics tools show what a social visitor did after landing on your site, and none of the three is a social media tool.
1. Meta Business Suite Insights (Best free tool for Facebook and Instagram)
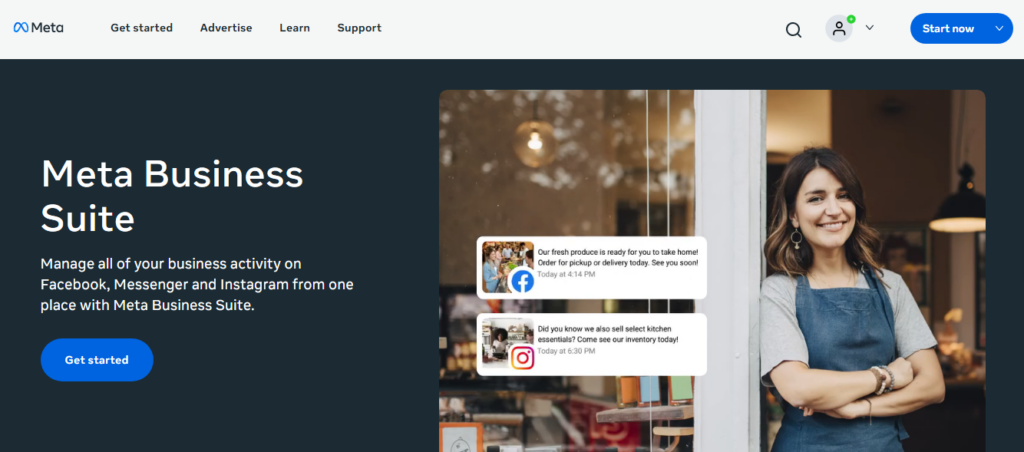
Meta Business Suite Insights is the combined native dashboard for Facebook Pages and Instagram business accounts.
It reports:
- Reach, impressions, and profile visits across both platforms
- Post and Reel performance, including saves and shares
- Follower demographics and growth
- Link clicks from posts and bio
Pricing: Free.
Best for: A local business running one Facebook Page and one Instagram account.
Picture a bakery checking which Reel drove profile visits before filming next week.
One requirement trips people up. Instagram data appears only for a professional account linked to a Facebook Page. A personal profile shows nothing.
Limitation: Meta reporting windows are shorter than most people expect. Comparing performance against non-Meta channels is impossible here.
2. LinkedIn Page Analytics (Best free tool for B2B)
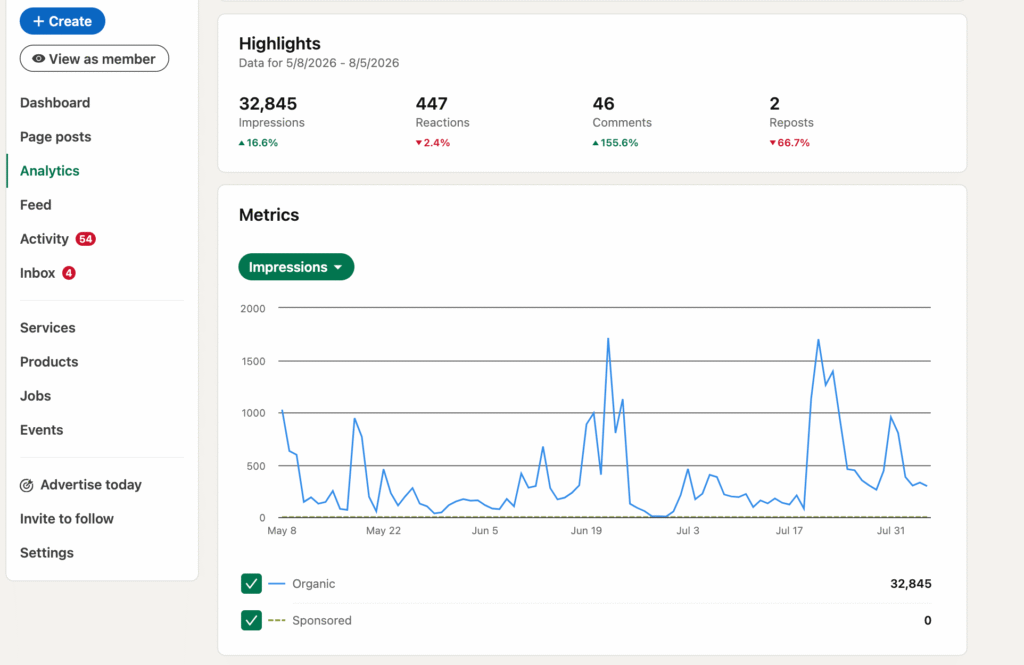
LinkedIn Page Analytics is the native reporting built into every LinkedIn company page.
It reports:
- Follower demographics by job title, industry, seniority, and company size
- Post impressions, clicks, and engagement rate
- Visitor metrics for the page itself
- Competitor page comparison at a basic level
Pricing: Free.
Best for: B2B companies checking whether content reaches decision makers or juniors.
A WordPress agency posting case studies can check whether agency owners actually read them. That breakdown beats the raw engagement number.
LinkedIn hides demographic data until a page passes a minimum audience size, so newer pages see gaps.
Limitation: LinkedIn Page Analytics covers the company page only. Employee posts and personal profiles are excluded, and that is where much B2B reach happens.
3. YouTube Studio Analytics (Best free tool for video retention)

YouTube Studio Analytics is the native analytics suite for any YouTube channel.
It reports:
- Watch time and average view duration
- Audience retention curves for individual videos
- Traffic sources, including search, suggested, and external
- Impressions and click-through rate on thumbnails
Pricing: Free.
Best for: Anyone publishing video who needs to know where viewers leave.
The retention curve is the feature worth learning. Open Content, select a video, then Engagement to see the exact second people leave. A walkthrough losing half its viewers at 0:40 has a problem in the first 40 seconds.
Limitation: YouTube Studio Analytics doesn’t report what happens on your site after someone clicks a description link.
4. TikTok Analytics (Best free tool for short-form video)
TikTok Analytics is the native reporting available inside any TikTok Business Account.
It reports:
- Video views, watch time, and completion rate
- Traffic source types, including For You and Follow feeds
- Follower activity by hour and day
- Trending content within your own account
Pricing: Free.
Best for: Brands testing posting times and formats on short-form video.
An ecommerce store can test whether 7 pm clips beat 9 am clips within a fortnight. The follower activity chart makes that test easy.
A Business Account is required, and data starts from the switch date. Nothing is backfilled.
Limitation: TikTok link attribution is weaker than any other platform here. Proving that downstream website traffic from TikTok is genuine is difficult.
5. Google Analytics 4 (Best free tool for social traffic and conversions)
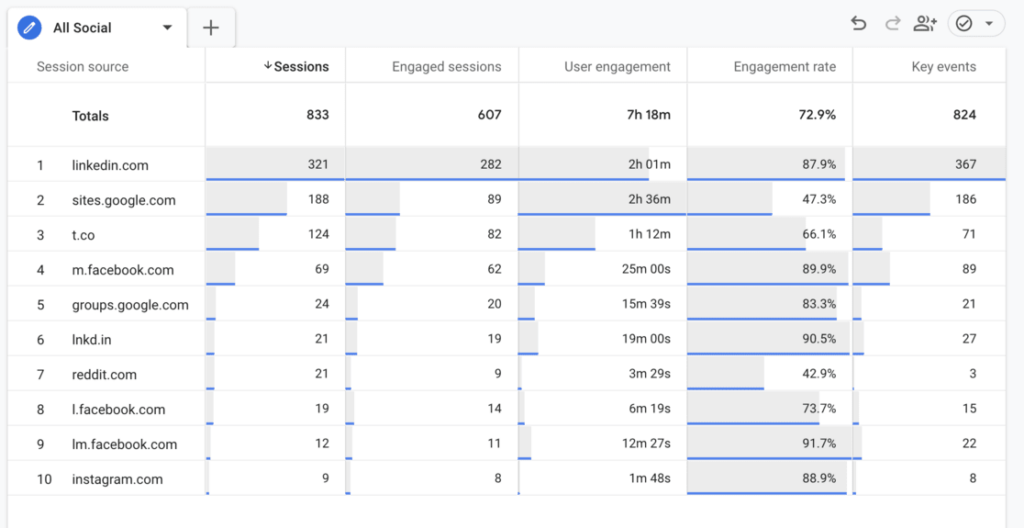
Google Analytics 4 is the free website analytics platform that reports on what visitors do after they arrive from social channels.
It reports:
- Sessions from each social platform, split into Organic Social and Paid Social
- Landing pages those visitors reached
- Engagement time and events
- Conversions attributed back to the source
- Campaign-level detail when UTM parameters are used
Pricing: Free.
Best for: Any site owner asked to prove social drives business results, not just engagement.
This is where free social media analytics tools stop being enough on their own. A membership site might find Pinterest sends the most sessions, while LinkedIn sends the people who sign up. Same data, opposite conclusions.
To find it: open Reports, then Acquisition, then Traffic acquisition, then set the dimension to Session source/medium. Our walkthrough of the GA4 traffic acquisition report explains how to read it alongside a wider guide to tracking website traffic.
Limitation: Google Analytics 4 reports nothing that happens on the platform itself. The interface also has a real learning curve for anyone who is not an analyst.
6. Analytify (Best for seeing social traffic performance inside WordPress)
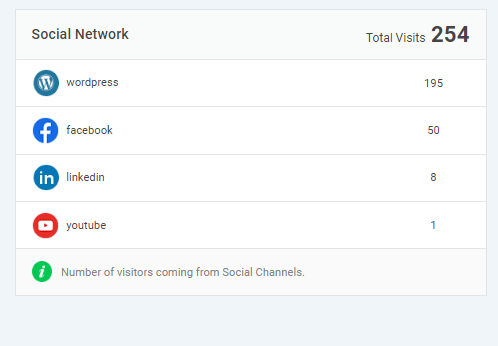
Analytify presents your Google Analytics 4 data inside the WordPress dashboard, including the traffic that arrives from social platforms.
Analytify is not, in itself, a social media analytics tool, but it has a feature that covers this. Analytify does not connect to Facebook, Instagram, or any other social API. Analytify answers the other half of the question: what the visitor did once they reached your site.
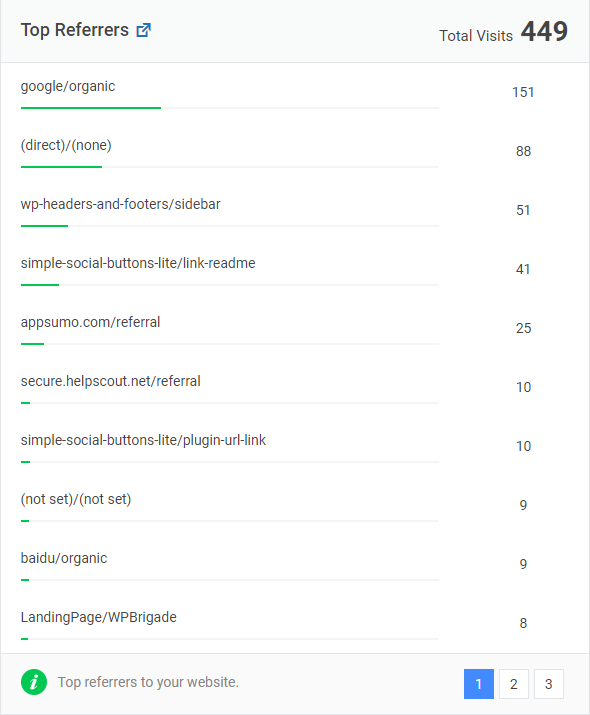
Analytify reports:
- Traffic sources and referral tracking, including social referrals, without leaving WordPress
- Top landing pages and page-level statistics
- Per-post statistics displayed directly below each post in the WordPress editor
- Campaign and UTM reporting (Analytify Pro, with the UTM Campaigns add-on)
The per-post report is the part worth the install. Analytify displays a post’s numbers beneath the post while you edit it. Picture a food blogger who shares every recipe to Pinterest, opens it in the editor, and sees whether it earned traffic. No second tab, no separate login.
Pricing: Analytify has a free version on WordPress.org with over 20,000 active installations. Analytify paid plans currently start at $99/year for StartUp, covering two sites, listed at 50% off the regular $199. The free version includes GA4 authentication and a limited overview dashboard that shows visitors, page views, and top pages. Analytify publishes a full free versus Pro comparison showing which reports need a paid plan.
Best for: WordPress site owners who want all analytics within their admin dashboard.
Limitation: Analytify does not schedule posts. Pair Analytify with a native platform dashboard from this list.
7. Data Studio (Best free tool for custom social and web reports)
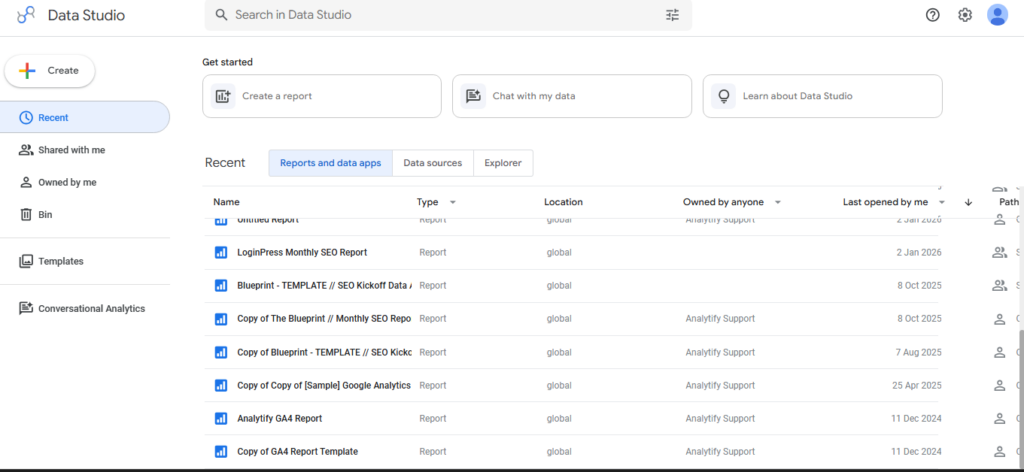
Looker Studio is Google’s free reporting tool for building custom dashboards from multiple data sources.
It reports:
- Anything in Google Analytics 4, natively connected
- Google Ads and Search Console data
- Social platform data via third-party connectors
- Custom calculated metrics across combined sources
Pricing: Free. Most social platform connectors are paid third-party products.
Best for: Freelancers who send a monthly report and want one page, not five screenshots.
As a social media reporting tool, it combines what nothing else does. Instagram reach can sit beside the sessions and signups it produced, and our guide to blending data in Looker Studio covers joining those sources.
Limitation: Looker Studio makes you design the report yourself. The first build is a genuine time investment, not a quick setup.
Paid cross-platform and listening tools
8. Buffer (Best for scheduling plus simple cross-platform reporting)

Buffer is a publishing tool with built-in reporting, rather than an analytics tool with publishing built in.
It reports:
- Per-post performance across connected channels
- Best time to post suggestions
- Channel-level engagement summaries
- Exportable reports in CSV and PDF
Pricing: Free plan covers three channels with 30 days of history. Essentials starts at $5 per channel per month, billed yearly.
Best for: Small teams that schedule regularly and want reporting in one place.
Custom UTM parameters sit on the paid tiers, which matters more than it sounds. Tagging links as you schedule is the difference between a habit you keep and one you drop by week three.
Limitation: Buffer reporting depth is lighter than dedicated analytics platforms. History beyond 30 days needs a paid plan.
9. Metricool (Best for small budgets and competitor benchmarking)
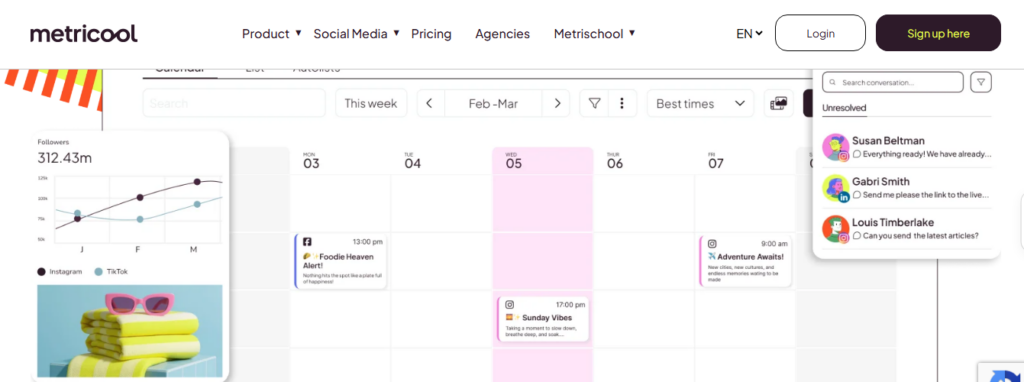
Metricool is a cross-platform reporting and scheduling tool priced for solo operators and small teams.
It reports:
- Cross-platform performance in one dashboard
- Competitor tracking across public profiles
- Best posting times per channel
- Downloadable white-label reports
Pricing: Free plan available. Starter begins at $20 per month billed annually.
Best for: Consultants who need competitor benchmarking without an enterprise contract.
As a social media reporting tool, it covers unusual ground at this price. Tracking four competitor profiles monthly normally costs several times more.
Limitation: Metricool does scheduling, analytics, and benchmarking at once. That breadth makes the interface slower to learn than a single-purpose tool.
10. Hootsuite Analytics (Best for teams that need custom reports)

Hootsuite Analytics is the reporting layer inside Hootsuite’s social media management platform.
It reports:
- Cross-network performance in custom report templates
- Team activity and approval workflow data
- Paid and organic performance side by side
- Industry benchmarking
Pricing: No free plan. A 14-day trial is available. Standard starts at $99 per user per month billed annually.
Best for: Teams where drafts need approval before publishing.
Limitation: Hootsuite pricing scales per user. A five-person team reaches a serious annual number fast, which rules it out for solo operators.
11. Sprout Social (Best for larger teams needing reporting and listening together)
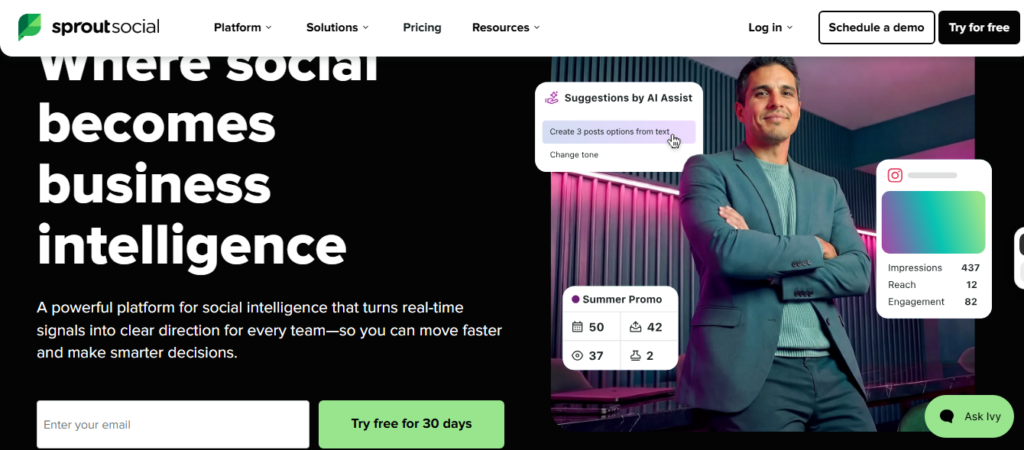
Sprout Social is a social media analytics platform that combines reporting, listening, and inbox management.
It reports:
- Unified cross-network performance
- Social listening and share of voice
- Response times and inbox activity
- Paid and organic in a single view
Pricing: No free plan. A 30-day trial is available. Essentials starts at $79 per seat per month billed annually.
Best for: Companies where support handles replies and marketing reports on reach, both from the same data.
Limitation: Sprout Social is priced per seat, which makes it the wrong choice for anyone under roughly five users.
12. Brandwatch (Best for social listening and sentiment)

Brandwatch is a social listening platform that monitors brand mentions across social networks and the wider web.
It reports:
- Brand mentions across social, news, blogs, and forums
- Sentiment analysis and shifts over time
- Trend and topic detection
- Audience research segments
Pricing: Not published, quote only, which tells you the target customer.
Best for: Brands where reputation monitoring matters more than post performance.
A plugin company can track whether mentions turned negative after a release, a different job from measuring engagement.
Limitation: Brandwatch is a listening platform first. Anyone who mainly needs post reporting pays for capability they never open.
How Do You Combine Social Media Analytics With Google Analytics Data?
You combine social media analytics with Google Analytics by adding UTM parameters to every link you post, then reading those campaigns in your GA4 acquisition reports. That is the whole mechanism.
The problem is simple. Platforms report the click. Google Analytics 4 reports what came after. UTM parameters tie the two together. Without them, social traffic arrives as one unhelpful lump.
Let’s break it down.
- Decide your tagging convention. Source is the platform (instagram). Medium is the type (organic_social or paid_social). Campaign is the push (spring_recipe_launch). Our guide to the standard campaign parameters covers all five tags. Write it down once and reuse it.
- Build the tagged URL. Use Google’s Campaign URL Builder or Analytify’s own UTM campaign URL builder rather than typing parameters by hand, which is where typos come from.
- Use the tagged link everywhere you post that campaign. Include the bio link. An untagged bio link is the most common leak.
- Wait for data, then open GA4. Go to Reports, then Acquisition, then Traffic acquisition.
- Switch the dimension to Session campaign. This shows performance by campaign rather than by platform, which is what tells you whether the push worked.
- Compare against a conversion event. Sessions alone answer a traffic question. Sessions plus conversions answer a business question.
- Check the same data inside WordPress. Analytify Pro with the Campaigns add-on surfaces campaign reporting in the WordPress dashboard, so the habit survives past week two. Campaign reporting is not part of the free version.
One caveat no tool solves. UTM tagging misses some social visitors. Shares through private messages and apps that strip parameters, called dark social, arrive as direct traffic. Anyone promising complete attribution is overselling.
Which Social Media Metrics Should You Actually Track?
The social media metrics worth tracking are those tied to a business outcome: link clicks, referral sessions, conversion rate from social, and cost per acquisition from paid posts. Everything else is context.
Most reporting built on social media analytics tools fails for one reason. It measures what is easy to count instead of what changes a decision. The best social media measurement tools hand you forty numbers. Thirty-five never alter what you do next week.
Metrics that drive decisions:
- Link clicks. The first honest signal that content moved someone.
- Referral sessions. Clicks that actually became visits, which is always a smaller number.
- Conversion rate from social. The only metric that survives contact with a finance team.
- Cost per acquisition on paid. Tells you whether to scale or stop.
- Landing page engagement time. Reveals whether the post promised something the page did not deliver.
Metrics that mostly inform ego:
- Follower count
- Total impressions
- Raw likes
- Reach without a campaign attached
That second list is not worthless. Reach and follower growth matter for awareness campaigns, where the goal really is being seen. The mistake is reporting them when the goal was signups.
Pick metrics from the goal, not from the dashboard.
Are Free Social Media Analytics Tools Good Enough?
Free social media analytics tools are good enough for most site owners running fewer than four accounts, because native platform dashboards plus Google Analytics 4 already cover both platform performance and website conversions. For many readers, the honest recommendation is to spend nothing.
That is not the answer most roundups give, and the reason is worth saying. Almost every article on this topic comes from a company selling a paid social tool. Recommending the free dashboard in your account is not in their interest.
Free covers you when:
- You manage one to three accounts
- One person does the reporting
- You only need data within each platform’s retention window
- Nobody outside your business receives the report
You have outgrown free when:
- You manage four or more accounts and switching dashboards eats real time
- Multiple people need access with different permissions
- Clients receive branded reports
- You need historical data beyond what the platform retains
- Competitor benchmarking is part of the job
| What you need | Free tools handle it | Paid tools needed |
|---|---|---|
| Single-platform performance | Yes, native dashboards | No |
| Website traffic and conversions from social | Yes, GA4 | No |
| Campaign attribution with UTM | Yes, GA4 | No |
| Combined multi-platform dashboard | Partly, via Looker Studio | Easier with paid |
| Long-term historical data | No | Yes |
| Competitor benchmarking | No | Yes |
| Client-ready white-label reports | No | Yes |
| Team roles and approval workflows | No | Yes |
The threshold is roughly four accounts or two people. Below that, paid tools buy convenience, not information.
How Do You Choose the Right Social Media Analytics Tool?
Choose a social media analytics tool by matching it to three things: how many accounts you run, how many people need access, and whether you need to prove website results or only platform performance. Answer those three and the shortlist of social media analytics tools worth your money narrows to one or two.
The third question is the one people skip. It decides whether a social media analytics platform alone is enough, or whether you need a website-side tool beside it.
| If you are | Start with | Pair it with |
|---|---|---|
| A solo blogger on one or two platforms | Native platform dashboards | GA4, shown in WordPress via Analytify |
| A small business on three or four platforms | Metricool or Buffer | GA4 with UTM tagging |
| A WordPress site owner focused on traffic and conversions | GA4 inside WordPress via Analytify | Native platform dashboards |
| A team of five or more | Hootsuite or Sprout Social | Looker Studio for combined reporting |
| A brand tracking reputation | Brandwatch | Native dashboards for post performance |
Every row has a pairing. No single tool covers both halves of the funnel. The sooner you accept two tools, the sooner reporting makes sense.
What Mistakes Do People Make With Social Media Analytics Tools?
The most common mistake is reporting platform engagement without ever checking whether that engagement produced site visits or conversions. Four others follow closely behind.
- Reporting engagement with no downstream data. A report full of impressions cannot say whether social is worth the time. Add referral sessions and one conversion metric to every report.
- Posting untagged links. Untagged social links collapse into direct traffic in GA4 and cannot be separated afterward. Tag every link before it goes out, because tagging is not retroactive.
- Comparing engagement rate across platforms. Each platform uses a different denominator. A 4% rate on LinkedIn and 4% on TikTok are not the same achievement. Compare each platform against its own history.
- Buying an enterprise tool for a two-account operation. Paying per seat for listening features you never open is the costliest mistake here. Start free, upgrade when a limit blocks you.
- Expecting historical data after switching account types. TikTok and Instagram business accounts collect analytics from the switch date. Nothing is backfilled. Switch early, before you need the data.
FAQs
1. Is there a free tool to track social media analytics?
Yes. Several free social media analytics tools exist, and every major platform includes free native analytics, including Meta Business Suite Insights, LinkedIn Page Analytics, YouTube Studio, and TikTok Analytics. Google Analytics 4 is also free and shows the traffic those platforms send to your website. For most site owners running fewer than four accounts, that combination is enough.
2. Do you need a social media analytics tool if platforms already provide data?
Not always. The native social media analytics tools built into each platform are enough when you run one or two accounts and only need on-platform performance. A separate tool earns its cost once you manage three or more accounts or have to report to someone else.
3. What can social media analytics tools help you measure?
Social media analytics tools measure impressions, reach, engagement rate, follower growth, and link clicks on the platform itself. They do not measure what happens after someone clicks through to your website. Pairing them with Google Analytics 4 adds landing pages and conversions.
4. Does Google Analytics track social media?
Google Analytics 4 tracks visitors who arrive at your website from social platforms, grouped under the Organic Social and Paid Social channels. Google Analytics 4 does not track what happens on the platform itself, such as likes or follower growth. Adding UTM parameters to your posted links makes this reporting more precise.
5. Why is my social media traffic not showing up in Google Analytics?
The usual cause is untagged links that arrive as direct traffic rather than social. Check three things in order. First, confirm your posted links carry UTM parameters. Second, confirm your GA4 property uses the correct data stream for the domain people actually land on. Third, check whether an ad blocker or consent banner stops the tag firing for some visitors. Traffic from private message shares is never attributed, so expect a permanent gap between platform clicks and GA4 sessions.
6. How often should you check your social media analytics?
Check your social media analytics tools weekly if you post regularly, and monthly is enough for client or management reporting. Checking daily encourages reacting to noise, because single-post variance is high. Set one weekly slot to review link clicks and referral sessions together.
Conclusion
If your social traffic lands on a members-only signup or a client portal, LoginPress lets you brand that login page so the experience matches the rest of your site.
Social media analytics tools tell you how a post performed. They do not tell you whether it produced anything. Closing that gap is what separates a report from a decision.
Three things to do next:
- Pick one native platform dashboard for the channel you post to most, and check it weekly.
- Add UTM parameters to every link you post from this week forward.
- Connect Google Analytics 4 to your WordPress site so social referral traffic and conversions appear where you already work.
Analytify shows your GA4 social traffic and per-post performance inside the WordPress dashboard. A free version is available, and paid plans start at $99/year. See Analytify plans
Further Readings: