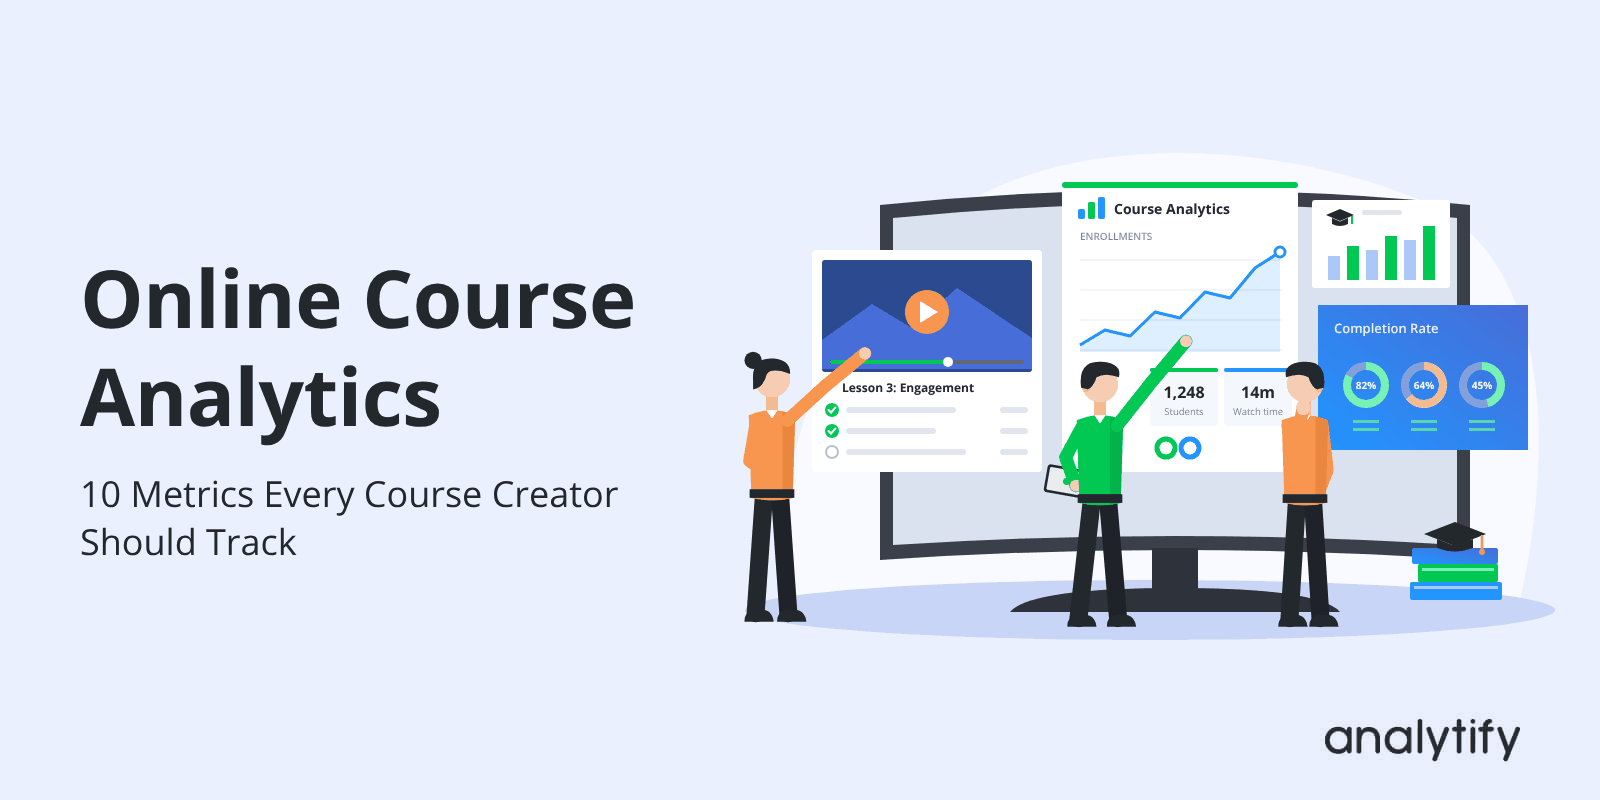
Online Course Analytics: 10 Metrics Every Course Creator Should Track

Most course creators watch enrollments and revenue. Then they can’t explain why sales slow down or why students quit.
The 10 online course analytics that matter. They follow a student from the first visit to the last lesson: course page views, engagement time, traffic sources, conversion rate, funnel drop-off, time to purchase, revenue by course, average order value, refund rate, and completion rate.
For each metric below, you get a simple meaning, a formula where one helps, what a change usually means, and where to find the number: GA4, Analytify, or LifterLMS.
Table of Contents
What Is Online Course Analytics?
Online course analytics means measuring how people find your course, buy it, and finish it. It covers four stages: traffic, sales, revenue, and learning.
Each stage answers one simple question:
- Traffic: Are the right people finding your course?
- Sales: Are visitors becoming students?
- Revenue: Is the course making money that stays after refunds?
- Learning: Do students finish what they paid for?
More visitors don’t always mean more success. A course with 500 visitors can sell more than a course with 5,000. A course can also sell well and still lose money to refunds.
On a WordPress course site, these numbers live in three tools. GA4 and Analytify show traffic, sales, and revenue. LifterLMS shows what students do after they join a course.
Which Online Course Metrics Should You Track?
Track these 10 online course metrics to see the full path from first visit to finished course. The table groups them by the four stages above: traffic, sales, revenue, and learning.
| # | Stage | Metric | What it tells you | Where to find it |
|---|---|---|---|---|
| 1 | Traffic | Course page views | Which courses get attention | GA4 / Analytify |
| 2 | Traffic | Average engagement time | Whether visitors actually read the course page | GA4 / Analytify |
| 3 | Traffic | Traffic source performance | Which websites and channels send buyers | GA4 / Analytify |
| 4 | Sales | Conversion rate | How many visitors join or buy | Analytify / GA4 |
| 5 | Sales | Funnel drop-off | The step where buyers give up | Analytify |
| 6 | Sales | Time to purchase (sessions and days) | How long people take to decide | Analytify |
| 7 | Revenue | Revenue by course | Which courses make the most money | Analytify |
| 8 | Revenue | Average order value | How much one sale is worth on average | Analytify |
| 9 | Revenue | Refund rate | How often buyers ask for their money back | Analytify |
| 10 | Learning | Course progress and completion | Whether students finish the course | LifterLMS |
Metrics 1 to 9 happen before or during the sale. Metric 10 happens after the sale. You need both sides to see the full picture.

Important: The Analytify LifterLMS add-on shows your LifterLMS course traffic, sales and refunds inside your WordPress dashboard, using data from Google Analytics 4. Most of the metrics in this guide come from its reports.
The add-on requires an Analytify Pro license. See what the Analytify LifterLMS add-on tracks.
1. What Do Course Page Views Tell You?
Course page views tell you how many times people opened a course page. They show which courses get attention, but not which ones sell.
Look at these two courses:
- Course A gets 2,000 views and 20 sales.
- Course B gets 500 views and 25 sales.
Course A gets more visitors. Course B makes more sales with fewer visitors, so it’s doing better.
Analytify’s LifterLMS analytics reports show course views next to purchases, revenue, and conversion rate. Analytify also tracks course list views, course selections, lesson views, and enrollments.

How to read course page views with sales
| What you see | What it usually means |
|---|---|
| Many views and many sales | The course offer is working |
| Many views but few sales | Check the course page, the price or the type of visitors |
| Few views but many sales | The offer works, so send more of the right visitors |
| Views going down | Fewer people are finding the course, so sales may drop next |
Bottom line: always compare views with sales. This tells you if the problem is “not enough visitors” or “visitors aren’t buying.”
2. What Does Average Engagement Time Show on a Course Page?
Average engagement time shows how long visitors actively look at a course page. A short time usually means people leave without reading.
GA4 counts engagement time only while the page is open and in front of the visitor. A tab hidden in the background doesn’t count.
Analytify’s Course Page Insights report shows views, bounce rate, and average engagement time for each course page.
Questions to ask when engagement time is low
- Does the page say clearly who the course is for?
- Does the page match what the ad or Google result promised?
- Is the important information hidden too far down?
- Is the price easy to find?
- Does the page work well on a phone?
There’s no single “good” engagement time. A short workshop page will always be read faster than a long certification page. Compare each course page with similar pages on your own site.
3. How Do You Measure Traffic Source Performance for a Course?
Traffic source performance shows which channels send people who buy, not just people who visit. A channel is a place visitors come from, like Google, email or social media.
Here’s an example:
| Source | Visits | Sales | Sales per 100 visits |
|---|---|---|---|
| Google search | 1,000 | 40 | 4 |
| Paid social ads | 1,500 | 12 | 0.8 |
| Partner website | 300 | 25 | 8.3 |
Paid social ads bring the most visits but the fewest sales. The partner website brings the fewest visits but sells twice as well as Google.
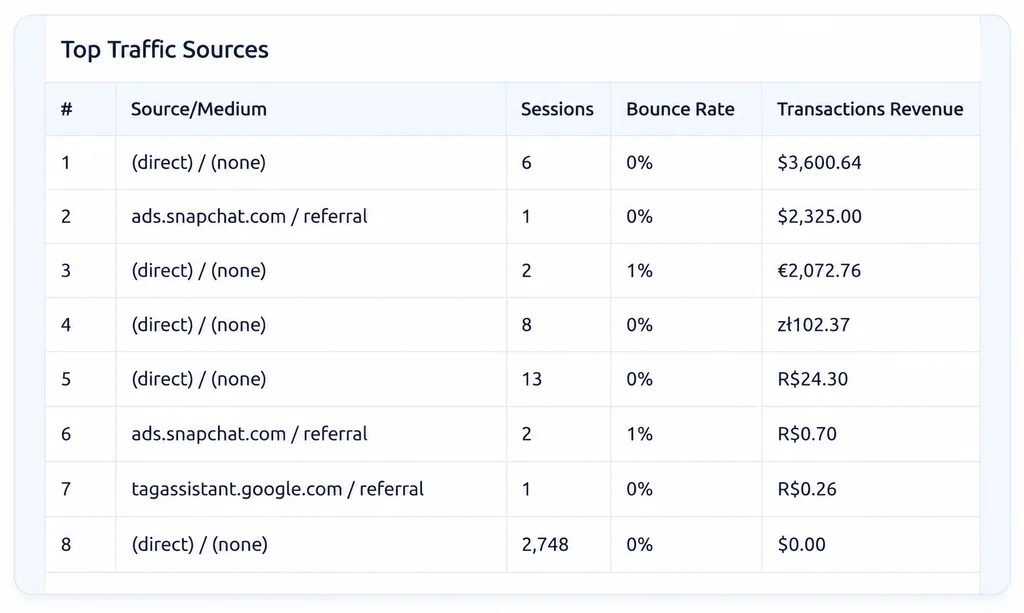
Analytify’s Top Traffic Sources report for LifterLMS shows each source, its visits, bounce rate, and revenue in one table. To learn more, read our guide to analyzing GA4 traffic sources.
The result? You spend time and money on channels that sell, not channels that only look busy.
4. How Do You Calculate Your Online Course Conversion Rate?
Your online course conversion rate is the percentage of visits that end in a sale or an enrollment.
Conversion rate = number of sales ÷ number of visits × 100
For example, 30 sales from 1,000 visits is a 3% conversion rate. For a free course, count enrollments instead of sales.
GA4 now calls conversions “key events.” Our GA4 conversion rate guide explains the difference.
Analytify shows the conversion rate for each LifterLMS course, next to its views, sales, and revenue.
Ways to split your course conversion rate
- By course
- By traffic source
- By campaign
- By landing page
- New visitors vs returning visitors
Here’s why that matters: a drop in your overall rate doesn’t always mean your page got worse. A big ad campaign can bring many visitors who were never likely to buy. Check which group changed before you edit pages or change prices.
5. Where Do Students Drop Off Before Buying?
A sales funnel shows the exact step where people give up before they pay. Conversion rate only tells you they didn’t buy.
A typical online course funnel has five steps:
- The visitor views the course.
- The visitor selects the course.
- The visitor starts checkout.
- The visitor completes the purchase.
- The student is enrolled.
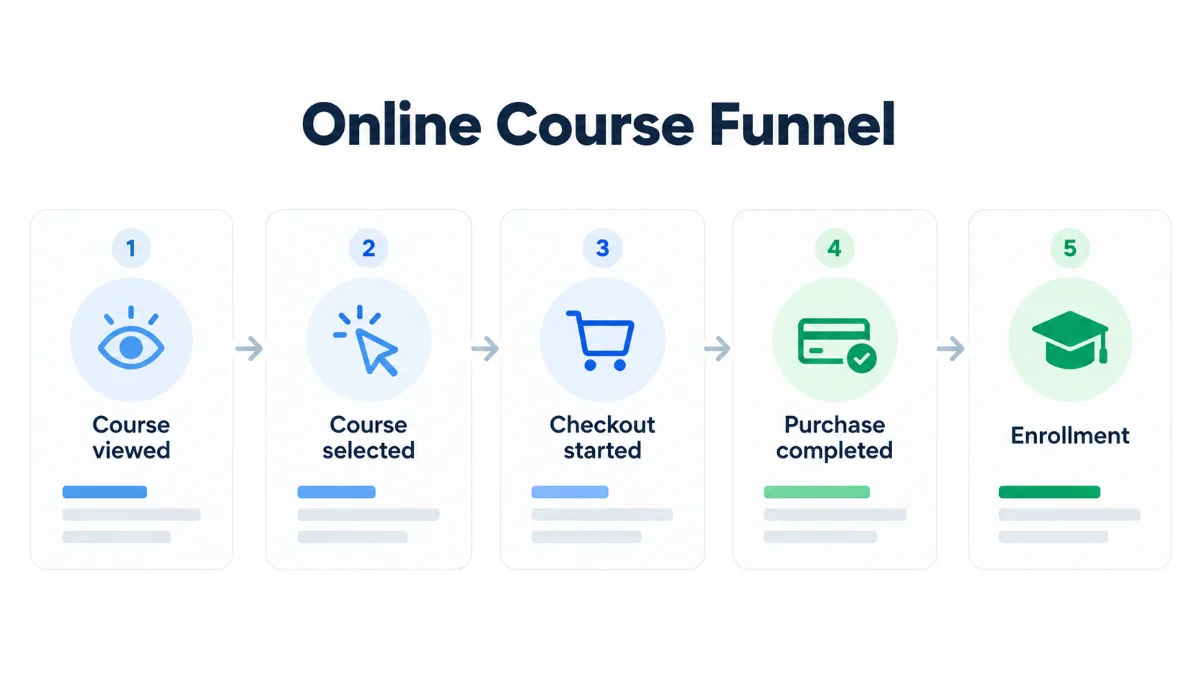
Say 1,000 people view a course and only 30 buy. The funnel shows whether most people left before checkout or during checkout. These are two different problems with two different fixes.
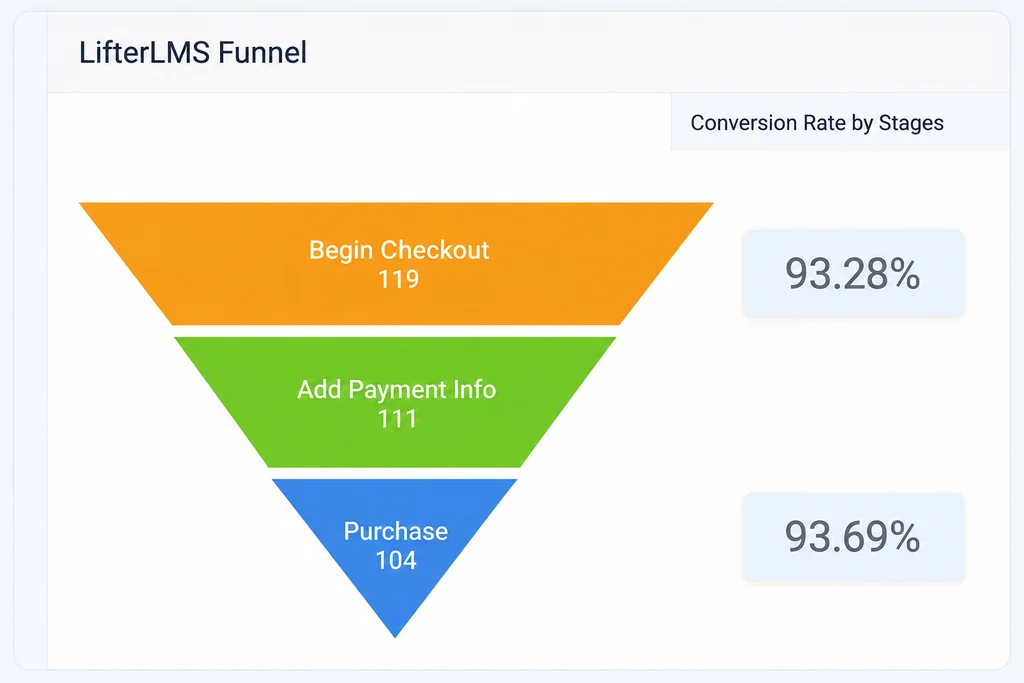
Analytify’s LifterLMS Funnel report zooms in on the checkout part of this journey. It shows how many people start checkout, enter payment details, and complete the purchase. It also shows the percentage that moves from one step to the next.
| Where people leave | What to check |
|---|---|
| Between the course page and checkout | Is the course clearly explained? Is the buy button easy to find? Is the price clear? |
| Between checkout and payment | Are there surprise costs, payment errors, too many form fields or a forced sign-up? |
Fix the step that loses the most people first. For more help, read our guide to analyzing content engagement with GA4 funnels.
If jumping between GA4 and your LMS to find these numbers takes too long, Analytify Pro’s LifterLMS add-on puts course views, funnels, revenue and refunds in one WordPress dashboard.
6. How Long Do People Take to Buy a Course?
Sessions to Purchase and Days to Purchase show how long people take before they buy. Analytify tracks both for LifterLMS sales.
- Sessions to Purchase: the number of visits before someone buys.
- Days to Purchase: the number of days between the first visit and the purchase.
Say the average buyer visits 4 times over 10 days. Then a visitor who leaves today without buying isn’t lost. They may still be deciding.
Content that helps people decide
- FAQs
- Free sample lessons
- Teacher bios
- Reviews from real students
- Comparison pages
- Email follow-ups
- Webinars or videos
Knowing your buying cycle also stops you from judging a campaign too early. A course launched on Monday may not show its full sales by Tuesday.
7. Which Courses Earn the Most Revenue?
Revenue by course shows how much money each course makes. Your total revenue can’t show this.
The course with the most students isn’t always the one that earns the most. Prices, discounts and refunds are different for each course.
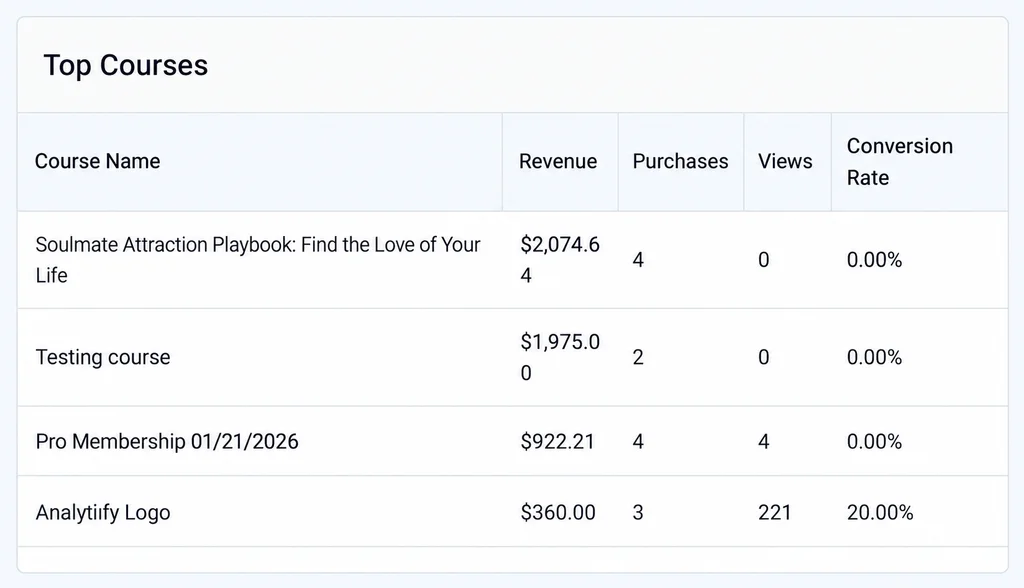
Analytify’s Top Courses report shows each course’s name, revenue, purchases, views and conversion rate in one table.
| Course | What you see | What to do next |
|---|---|---|
| Course X | Earns the most, but only because it gets lots of visitors | Improve its course page so more visitors buy |
| Course Y | Earns less, but sells twice as well | Send it more of the right visitors |
Always compare revenue with views, sales, conversion rate and refunds. The course that earns the most isn’t always your best course.
8. How Do You Calculate Average Order Value for Courses?
Average order value (AOV) is the average amount a customer pays in one order.
Average order value = total revenue ÷ number of orders
Analytify shows AOV in its LifterLMS reports.
A higher AOV grows revenue without new buyers. 100 orders at $50 each bring $5,000. The same 100 orders at $65 each bring $6,500.
What changes average order value
- Price changes
- Course bundles
- Memberships
- Upsells (offering a bigger package at checkout)
- Coupons
- Buyers getting more than one course
Always read AOV together with the number of orders. A lower AOV during a sale can be normal. A higher AOV can hide the fact that fewer people are buying.
9. What Does Your Course Refund Rate Tell You?
Refund rate is the percentage of course sales that end in a refund. A rising refund rate means buyers didn’t get what they expected.
Refund rate = number of refunds ÷ number of sales × 100
Analytify shows both the number of refunds and the refund rate for LifterLMS sales.
Common reasons course refunds go up
- The course didn’t match what the sales page promised.
- The ads brought the wrong people.
- Students couldn’t log in or watch lessons.
- Buyers felt the course wasn’t worth the price.
- The course length or requirements weren’t clear before buying.
The refund rate tells you that something changed, but not why. To find out why, read refund requests, support emails, and student feedback, and check which campaign the buyers came from.
So what does this mean for you? If a campaign raises both sales and refunds, it probably brought the wrong buyers.
10. How Do You Measure Course Progress and Completion Rate?
Course completion rate is the percentage of enrolled students who finish the course.
Course completion rate = students who finished ÷ students enrolled × 100
This is the only metric in this list that starts after the sale. It answers one question: did students actually use what they bought?
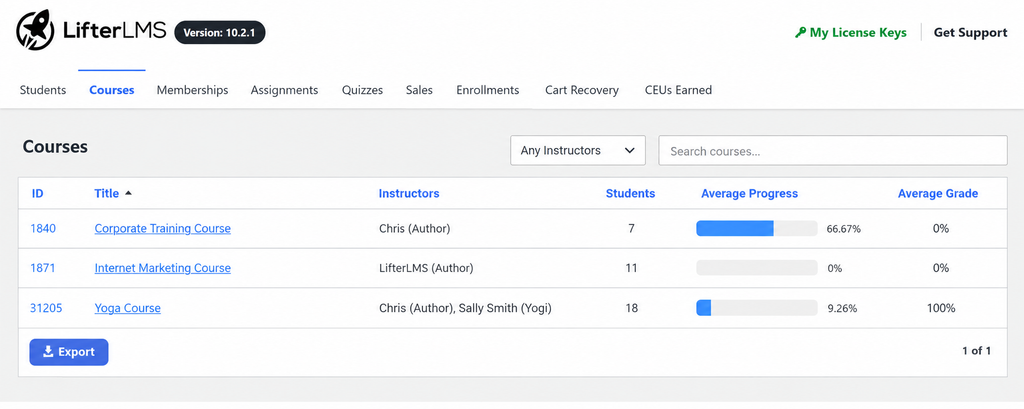
LifterLMS has built-in reporting shows enrollments, course progress, quiz attempts, certificates, achievements, and each student’s activity.
The final percentage isn’t enough on its own. Progress data shows the exact lesson where students stop. For example, if most students finish lesson 6 but few finish lesson 7, look at lesson 7 first.
What to check at the lesson where students stop
- Is the lesson too long?
- Is it suddenly much harder?
- Does it need skills students don’t have yet?
- Is there a hard quiz or test?
- Is something broken, like a video that won’t play?
- Did students already get what they came for?
Completion also depends on the course type. A short training course and a large self-paced course will never have the same completion rate. To measure learning quality, see our guide on measuring e-learning effectiveness.
How Do You Read Online Course Metrics Together?
Read course metrics in pairs, because one number alone rarely explains a problem.
| What you see | What it might mean |
|---|---|
| Lots of visitors, few sales | The wrong visitors, or a weak course page |
| Few visitors, lots of sales | A strong course that needs more of the right visitors |
| Lots of sales, lots of refunds | The course doesn’t match what buyers expected |
| Strong sales, low progress | Marketing works, but students struggle after joining |
| Long page visits, few checkouts | People are interested, but something stops them from buying |
| More visits before buying | Buyers need more proof or answers before they decide |
These patterns show where to look. They don’t prove the cause. For example, if sales drop after a price change, the price may not be the reason. A new ad campaign, a holiday, or a slow website could also explain it.
LifterLMS Analytics: Which Tool Tracks What?
For LifterLMS analytics, you need three tools. GA4 tracks what visitors do on your website. Analytify’s LifterLMS add-on shows GA4 and LifterLMS sales data inside WordPress. LifterLMS tracks what students do after they join a course.
| Tool | Best for | Example numbers |
|---|---|---|
| Google Analytics 4 | Website visitors and their behavior | Visits, traffic sources, engagement, events |
| Analytify (Pro + LifterLMS add-on) | GA4 and course sales data inside WordPress | Course views, traffic sources, funnels, sales, revenue, AOV, refunds, time to purchase |
| LifterLMS | Student activity after joining | Enrollments, progress, quiz attempts, completion, certificates |
If you’re running a course on WordPress, LifterLMS handles the course itself: enrollments, lessons, quizzes and student records. Use each tool for the question it answers best.
How Often Should You Review Online Course Analytics?
Check your sales numbers weekly and your learning numbers monthly. Most course sites don’t need daily checks.
| When | What to check |
|---|---|
| Every week | Traffic sources, course page visits, conversion rate, funnel steps, sales and refunds |
| Every month | Revenue by course, AOV, traffic trends, time to purchase, enrollments, progress and completion |
| After a launch or campaign | The whole journey, from first visit to student progress |
Checklist after a launch
- Who visited, and where did they come from?
- Did they spend time on the course page?
- Did they buy, and how long did they take?
- Did refunds go up?
- Are new students moving through the lessons?
Frequently Asked Questions About Online Course Analytics
1. What is the most important metric for an online course?
No single metric matters most for every course. The right metric depends on the weakest part of your student journey. If few people visit, focus on traffic. If many people visit but few buy, focus on conversion rate and the funnel. If students rarely finish, focus on course progress.
2. What is a good online course conversion rate?
There is no single good conversion rate for every course. Price, audience, traffic source, and whether the course is free or paid all change the number. A person who searches for your course by name is much more likely to buy than a person who clicks a social media ad. Compare your rate with your own past results instead of an industry average.
3. What is a good online course completion rate?
A good completion rate depends on the course length, how hard it is, and whether students must take it. Free online courses usually have very low completion rates. Paid, focused courses usually do much better, so compare each new group of students with your earlier groups.
4. Why is LifterLMS course revenue not showing in Google Analytics?
LifterLMS revenue only shows in GA4 when your site sends purchase events to GA4. Without these events, GA4 counts visits but not course sales. In Analytify, the LifterLMS add-on needs an active Analytify Pro license and must be turned on in Analytify’s settings. If revenue is still missing, follow the LifterLMS ecommerce tracking setup guide.
5. How often should course creators check analytics?
Check traffic, conversion rate, funnels, sales, and refunds once a week. Check course progress and completion once a month, because students need weeks to move through a course. The goal is to spot clear patterns, not to react to small daily changes.
6. Can Google Analytics track course completion?
GA4 can track course activity only when your website sends it as events. Analytify sends LifterLMS activity, such as course views, lesson views, and enrollments, to GA4. Detailed student progress, quiz scores, and completion records are easier to read in LifterLMS, which saves them for each student.
How Do You Turn Course Data Into Better Decisions?
Find the weakest step in your student journey and fix that step first.
- Pick four main numbers: course page views, conversion rate, refund rate, and completion rate.
- Find the weak step: traffic, course page, checkout, or learning after enrollment.
- Change one thing at a time, and wait a full buying cycle before you judge the result.
Analytify shows how visitors find your course, move through checkout, and turn into revenue. LifterLMS shows what students do after they join. Together, they show what’s working and what to fix next.
Ready to see these numbers for your own courses? Get the Analytify LifterLMS add-on to track course views, funnels, revenue and refunds right inside WordPress. The add-on requires an Analytify Pro license.
New to LifterLMS? Explore LifterLMS to build, sell, and track your online courses on WordPress.