Heatmaps in Google Analytics: Does GA4 Have One? (Plus 4 Tools That Do)

You went looking for heatmaps in Google Analytics. They are not there: Google Analytics has no native heatmap feature in GA4 or any version before it.
GA4 records clicks and scroll depth as events and numbers. It never draws them onto your page, which is why heatmaps in Google Analytics have never appeared in any report.
So you did not break anything. You did not miss a setting. The fix is to pair GA4 with a dedicated heatmap tool, covered below.
Below: what GA4 tracks instead, how close you can get with GA4 data alone, the four tools that actually produce the heatmap, and how to run one next to your current setup without duplicate tracking. New to any of this? Start with how to set up Google Analytics 4 on WordPress.
What This Guide Covers:
Does Google Analytics Have a Heatmap Feature?
No. Google Analytics has no native heatmap tool. There is no heatmap tab, no click overlay, and no scroll map anywhere in the interface.
A heatmap is a color-coded picture of a single page that shows where visitors clicked, tapped, moved, or stopped scrolling. Warm colors mark heavy activity; cool colors mark ignored areas. Google Analytics produces no such picture at any point in its reporting, so heatmaps in Google Analytics remain a third-party job.
The confusion is fair. GA4’s Enhanced Measurement auto-tracks scroll and click activity, so people assume it gets drawn onto the page somewhere. It never does. GA4 stores it as aggregated event counts. Searching the interface for heatmaps in Google Analytics returns nothing because the feature was never built.
What Does Google Analytics Show Instead of a Heatmap?
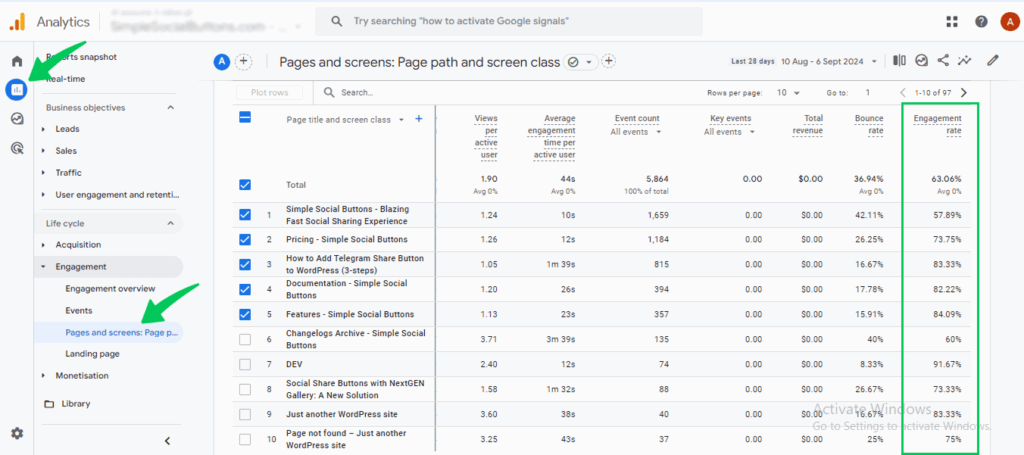
Google Analytics tracks engagement behavior as events and numbers, not as a visual map of a page. GA4’s Enhanced Measurement records a defined set of interactions, and each one produces a count or an average rather than an image. Anyone hunting for heatmaps in Google Analytics is usually after one of these metrics without knowing it.
Here is what GA4 gives you, and what each metric leaves out:
- Scroll events. Fire the first time a visitor reaches 90% page depth. Tells you they reached the bottom, not where they paused. More detail: Google Analytics scroll depth tracking.
- Average engagement time. How long the page held focus, not which section held it.
- Engaged sessions. Visits that lasted, converted, or went deeper. No detail on what they touched.
- Exit rate. Where visitors leave, not what they were looking at when they gave up.
- Outbound click events. Clicks on links leaving your domain. Every click that goes nowhere is invisible.
- Site search, file downloads, video engagement, form interactions. Useful counts, still no position on the page.
Together they tell you how many and how long. A heatmap answers where. Deeper breakdown: GA4 engagement metrics explained.

Why Are There No Heatmaps in Google Analytics?
Google Analytics was built to measure traffic and conversions at scale, not to visualize individual sessions. A heatmap needs cursor coordinates, taps, and scroll behavior captured per visitor. GA4 aggregates events instead, which keeps reporting fast across millions of sessions.
Privacy plays a part too. Session-level recording carries consent and retention obligations that event counting does not. Google lists every interaction GA4 captures in its Enhanced Measurement documentation. Cursor movement is not on the list.
Worth checking before you blame the tool: those events can be switched off. Confirm what is enabled in GA4’s Enhanced Measurement settings first.
Can You Build a Heatmap Using GA4 Data Alone?
Not a true one. GA4 never stores the x and y coordinates a heatmap is drawn from, so no report, exploration, or export can reconstruct the visual. What you can build is a rough approximation of the same insight, which is the closest thing to heatmaps in Google Analytics that exists.
Three approaches get you partway there:
- Custom scroll thresholds. GA4’s built-in scroll event only fires at 90%. A Google Tag Manager scroll-depth trigger can send events at 25%, 50%, and 75% as well, which turns one blunt signal into a drop-off curve for the page.
- Click events on specific elements. A GTM click trigger fired on a button, a table of contents, or an internal link records interactions GA4 ignores by default. That gives you counts per element, which is the numeric half of a click map.
- Path exploration. GA4’s Explorations show the sequence of pages and events a visitor moves through, which surfaces where journeys break even though it says nothing about position on the page.
The honest limit: this tells you what share of readers never passed the halfway mark. It does not tell you which paragraph they stalled on. For that, a dedicated heatmap tool is the only route, and setting one up is faster than building custom triggers anyway.
What Are the Best Heatmap Tools to Use With Google Analytics 4?
Microsoft Clarity, Hotjar, Lucky Orange, and Crazy Egg are the four heatmap tools most commonly paired with GA4. Each runs its own script alongside GA4, adding the visual layer GA4 was never built to produce.
| Tool | What it adds | Cost | Best for |
|---|---|---|---|
| Microsoft Clarity | Heatmaps, session recordings, GA4 property link | Free | Bloggers and small sites |
| Hotjar | Heatmaps, recordings, on-page surveys | Free tier with session caps, paid tiers above | Landing page testing |
| Lucky Orange | Heatmaps, live chat, form analytics | Paid, priced by session volume | E-commerce stores |
| Crazy Egg | Heatmaps, scroll maps, A/B testing | Paid, free trial only | Marketers running tests |
Verify current free-tier terms before committing. Third-party pricing changes without notice.
Below are some of the best heatmap tools for Google Analytics.
1. Microsoft Clarity
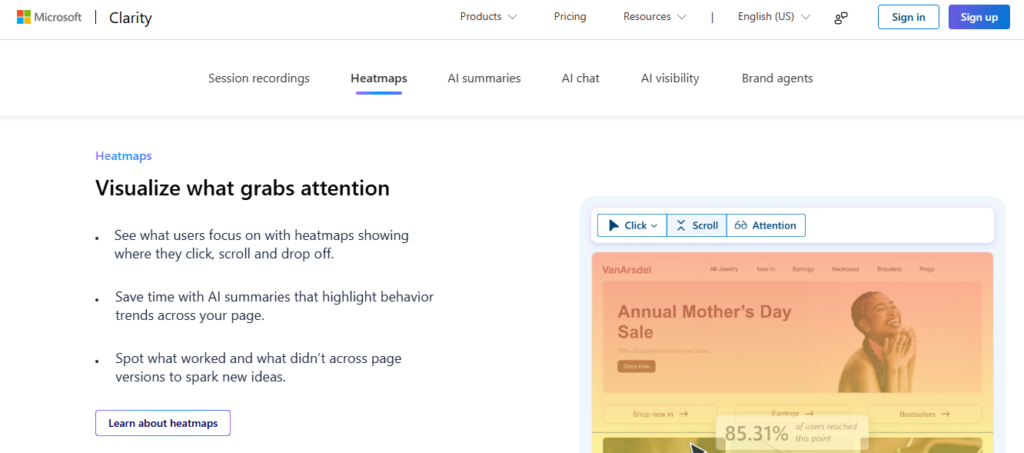
Microsoft Clarity is the free option, and it links directly to a GA4 property. A solo blogger who wants click maps and session recordings without a subscription should start here. That GA4 link lets you jump from a recording to the matching segment. The trade-off is a thinner feature set around surveys and testing than the paid tools offer.
2. Hotjar

Hotjar pairs heatmaps with on-page surveys, so you can ask visitors why they stalled. A SaaS landing page owner testing headline copy gets both signals in one place. The free tier caps daily sessions, so busy pages hit the ceiling fast and start sampling.
3. Lucky Orange
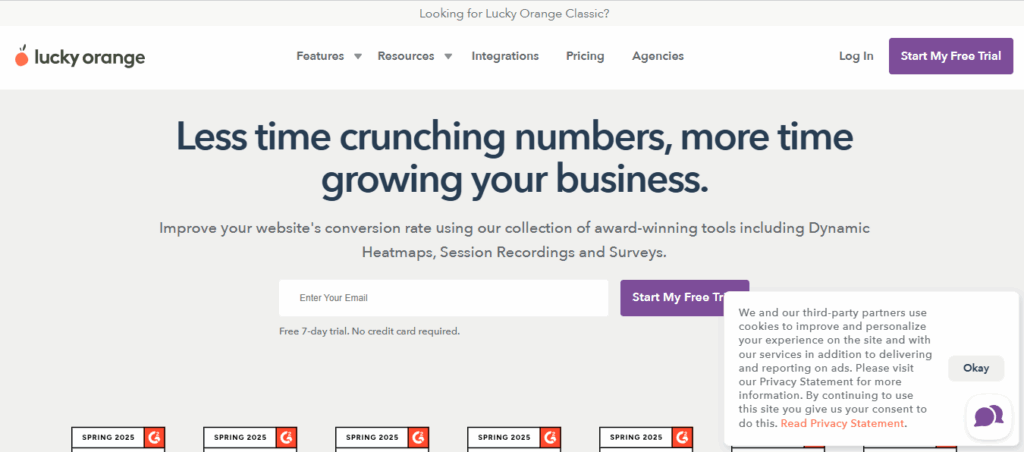
Lucky Orange bundles heatmaps with live chat and form analytics. An e-commerce owner chasing checkout abandonment gets scroll maps and field-level drop-off in one view. Plans are paid for by sessions collected, so a traffic spike can move you up a tier unexpectedly.
4. Crazy Egg
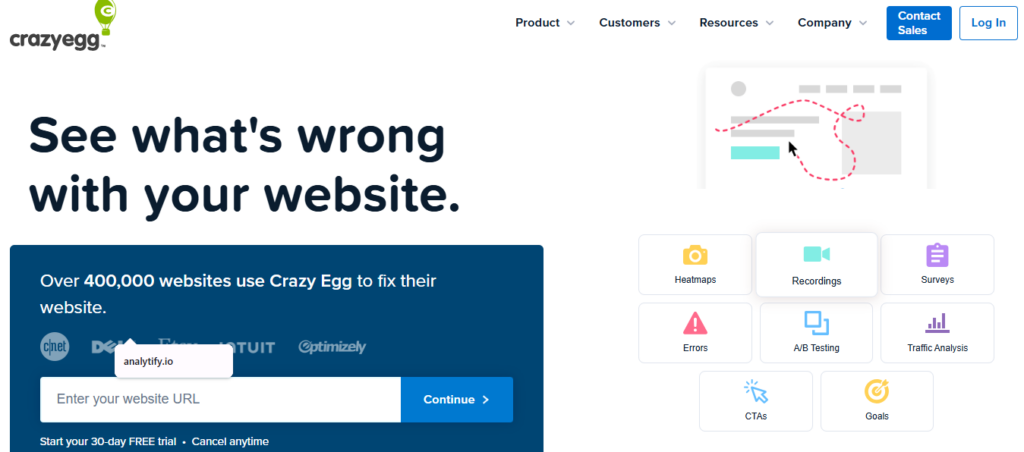
Crazy Egg combines heatmaps with A/B testing, so you can spot a problem and test the fix in one tool. A marketer iterating on a sales page benefits most. There is a free trial but no permanent free tier, so budget for it.
Free vs paid at a glance:
| Free option | Paid option | |
|---|---|---|
| Tool | Microsoft Clarity | Hotjar, Lucky Orange, Crazy Egg |
| Session limits | None advertised | Tiered by volume |
| Extras | Recordings | Surveys, chat, forms, A/B testing |
Which Pages Should You Heatmap First?
Start with high-traffic pages that underperform, because a heatmap needs volume to be readable and only pays off where there is something to fix. Running one across an entire site produces noise and slows pages that were never the problem.
Use your existing GA4 numbers to pick the shortlist:
- High sessions, low engagement time. People arrive and leave. A scroll map shows how far down that happens.
- High traffic, low conversion. Cross-reference your top converting pages in GA4 and heatmap the ones that should be on that list and are not.
- Long pages with weak scroll events. If almost nobody triggers the 90% scroll event, something above the fold is stopping them.
- Checkout, pricing, and lead forms. The pages where a single confusing field costs revenue.
Three to five pages is a sensible first pass. Read them after a full week of data, not before. Because heatmaps in Google Analytics are not an option, the shortlist comes from GA4 and the visual comes from the tool you install.
How Does Analytify Fit Into Your Heatmap Strategy?
Analytify shows GA4’s engagement data directly inside your WordPress dashboard, so you never open a raw GA4 report to find it. If checking Google Analytics in a second tab is a daily chore, that alone saves real time.
Analytify displays per-post engagement reports below each post in the WordPress editor: sessions, engagement time, and traffic sources for that specific piece. That is how you build the shortlist in the section above without leaving WordPress. Analytify Pro adds advanced reports, WooCommerce tracking, and form tracking, starting at $99 per year.
One clarification: Analytify presents GA4 data; it does not generate heatmaps. Numbers come from Analytify; visuals come from the heatmap tool you install. Bottom line: they answer different questions and belong side by side.
How Do You Add a Heatmap Tool to a WordPress Site Running GA4?
Install your chosen heatmap tool’s own WordPress plugin, separately from your GA4 or Analytify setup. The two run in parallel without conflict.
- Pick one tool from the table above based on budget and whether you need session recordings.
- Install its WordPress plugin from Plugins >> Add New, or paste its tracking script using a header and footer plugin.
- Verify the script is firing with the tool’s own verification check.
- Let it collect for a week before reading the maps. Thin data produces misleading hotspots.
- Confirm both tools run by checking GA4 pageviews and heatmap sessions still increment.
One caution: a heatmap script records session-level behavior, so update your privacy policy and consent banner to cover it. GA4 consent settings do not extend to a second vendor automatically..
Google Analytics vs Heatmap Tools: What’s the Difference?
Google Analytics reports numbers, heatmap tools show visuals, and most sites need both. GA4 tells you a page loses people. A heatmap shows the paragraph where it happens.
| Differnces | Google Analytics (GA4) | Heatmap tools |
|---|---|---|
| Measures | Sessions, events, conversions | Clicks, taps, scroll depth, cursor paths |
| Data type | Quantitative, aggregated | Qualitative, visual, session-level |
| Setup effort | One tracking connection | A second script per site |
| Cost | Free | Free to paid, by session volume |
| Question it answers | How many, how often | Where, and why |
Pairing beats picking, because a number without a location is a problem you cannot act on. People searching for heatmaps in Google Analytics usually want both halves anyway, and running the two side by side is how you get them.
FAQs About Heatmaps in Google Analytics
1. Does Google Analytics have a heatmap feature?
No. Heatmaps in Google Analytics do not exist as a native feature, and GA4 did not add one. GA4 tracks scroll depth and clicks as events and numbers through Enhanced Measurement, but never renders them as a visual overlay. Seeing clicks and scrolls visually requires a separate heatmap tool running alongside GA4.
2. What are the best heatmap tools to use with Google Analytics 4?
Microsoft Clarity, Hotjar, Lucky Orange, and Crazy Egg are the four most widely used heatmap tools that pair with GA4. Microsoft Clarity is free and links to a GA4 property. Hotjar adds surveys, Lucky Orange adds live chat and form analytics, Crazy Egg adds A/B testing. Choose on budget and which extra signal you need.
3. How do I add a heatmap to my WordPress site alongside GA4?
Install the heatmap tool’s WordPress plugin, or add its script through a header and footer plugin, separately from GA4. Microsoft Clarity and Hotjar both publish dedicated WordPress plugins that activate in a few clicks. The tool then collects data alongside GA4 or Analytify without conflict, because the two capture different data types.
4. Google Analytics vs heatmap tools: what’s the difference?
Google Analytics reports quantitative data: pageviews, sessions, conversion rates. Heatmap tools report visual data: where visitors click and how far they scroll. GA4 answers how many and how often; a heatmap tool answers where and why. Running both gives a fuller picture than treating them as alternatives.
5. Can I create a heatmap from Google Analytics data in Looker Studio?
Not a true page heatmap. Looker Studio can visualize GA4 metrics as color-scaled tables or charts, which some people call a heatmap, but it cannot plot clicks onto a screenshot of your page because GA4 never captures the coordinates. A color-coded table of scroll events by page is the closest Looker Studio gets.
6. Why is scroll tracking not showing in my GA4 reports?
Scroll tracking sits inside Enhanced Measurement, and it can be switched off at the data stream level. Check Admin >> Data Streams >> your stream >> Enhanced Measurement and confirm the scroll toggle is on. Also, remember GA4’s scroll event fires only at 90% page depth, so pages nobody finishes show few scroll events even when tracking works.
7. Does running a heatmap tool alongside GA4 slow down a WordPress site?
A heatmap tool adds a second JavaScript file, and session-level recording does more browser work than GA4 does. The real impact depends on your host, caching, and traffic volume. If page speed matters, limit the script to the pages you are studying, then remove it once you have enough data.
Google Analytics Heat Map: Final Thoughts
Heatmaps in Google Analytics do not exist, and that is not the obstacle it looks like. GA4 gives you the numbers, a second tool draws the picture, and the two together answer questions neither can answer alone.
Three things to do next:
- Open your GA4 Engagement reports, or Analytify’s dashboard, and note the scroll and engagement data you already have.
- Pick one heatmap tool from the table above, based on budget and whether session recordings matter.
- Install it alongside GA4 on three to five pages, and let it run a full week before changing anything.
Further Readings:
Let me know if you have any queries; feel free to share in the comment box.