
Understanding DebugView in Google Analytics 4
If you’ve been struggling to understand the ins and outs of GA4 DebugView, you’re in the right place.
Google Analytics DebugView is a game-changer for marketers, analysts, and developers. It provides real-time insights that help troubleshoot and fine-tune the analytics setup.
In this article, we will discuss the importance of DebugView in Google Analytics 4, how to enable it, and everything else you need to master this tool.
Let’s get started!
GA4 DebugView (TOC):
What is DebugView in GA4?
DebugView in GA4 is a feature in Google Analytics 4 that allows you to monitor and troubleshoot your analytics setup in real time.
Developers and analysts use this to ensure that the data sent to GA4 is accurate and as expected.
GA4 Debug mode is a live feed showing you what’s happening under the hood as users interact with your website or app.
GA4 DebugView is important for the following reasons:
- Immediate Feedback: GA4 Debugger provides instant feedback on how events are being tracked. This is crucial when you’re setting up new tracking codes or troubleshooting existing ones.
- Troubleshooting Tool: It helps you quickly identify and resolve tracking issues, ensuring your data collection is as precise as possible.
- Validation: Before you go live with any changes in your tracking setup, you can use GA4 DebugView to validate data to ensure accuracy.
Key Features of DebugView:
- Real-time Event Tracking: See events as they are triggered.
- Parameter Inspection: View the parameters sent with each event to verify accuracy.
- Error Reports: Immediately spot errors in event tracking.
Here’s a look at what the DebugView interface might typically display:
| Feature | Description |
| Event Name | Name of the event being tracked. |
| Event Params | Parameters sent along with the event. |
| Trigger Time | Exact time when the event was triggered. |
| Error Details | Any errors associated with the event. |
Understanding and using GA4 DebugView effectively can significantly enhance the quality of your analytics data, making it an indispensable tool for anyone serious about data-driven decision-making.
Where is Debug View in GA4?
Navigating to DebugView in Google Analytics 4 is straightforward. Let’s learn the simple steps to locate DebugView in GA4.
Step 1: Sign In to Google Analytics
First, you need to log into your Google Analytics account.
Then, choose the GA4 property for which you want to access DebugView.
Step 2: Navigate to the Admin Section
In the left-hand sidebar, click the Admin gear icon at the bottom.
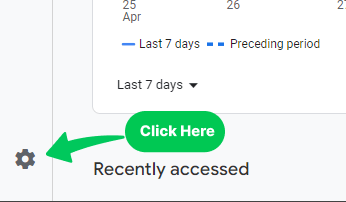
Step 3: Access DebugView in Google Analytics 4
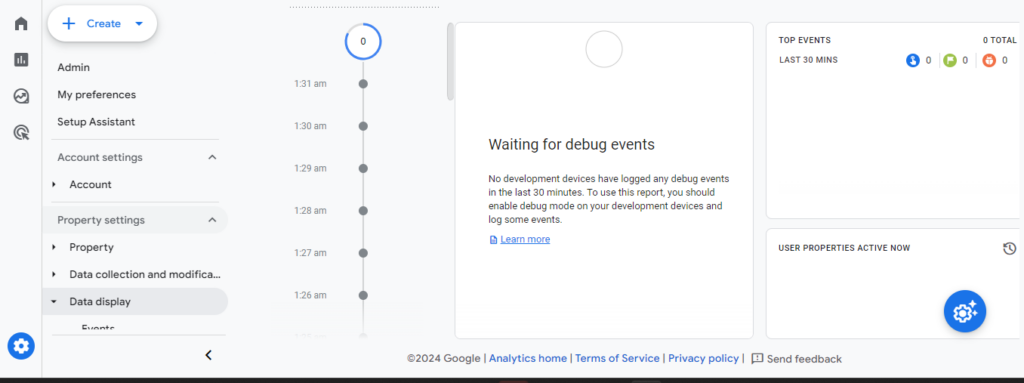
Here, you’ll find DebugView listed as an option within the Data display tab.

Click on it to open the debug interface.
Here’s a visual guide to help you find DebugView:
How to Enable DebugView in GA4? (3 Ways)
Enabling DebugView in Google Analytics 4 can be done through 3 methods, depending on your setup and preferences. Here, we’ll explain all these 3 ways to enable DebugView.
Method 1: Using GA Debugger Chrome Extension
Step 1: Install the GA Debugger Extension
1. Open Chrome Web Store:
Go to the Chrome Web Store and find GA Debugger.
2. Install the Extension:
Find the “GA Debugger” extension in the search results.
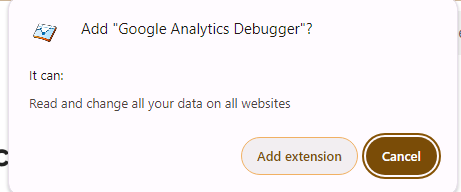
Then, click the “Add to Chrome” button. It will be added to your Chrome.

- In the pop-up window, click “Add Extension” to confirm the installation.
Step 2: Enable GA Debugger on Your Website
- Open Your Website:
- In a new tab, navigate to the website you want to debug.
- Enable GA Debugger:
- Click on the GA Debugger extension icon in the Chrome toolbar (it looks like a small bug icon).
- The icon should turn blue, indicating that the extension is active.

- Refresh Your Website:
- Refresh the page to start sending debug events to Google Analytics.
Step 3: Access DebugView in GA4
- Log in to Google Analytics:
- Go to the Google Analytics website and log in with your Google account.
- Select Your GA4 Property:
- Choose the GA4 property for which you want to enable DebugView.
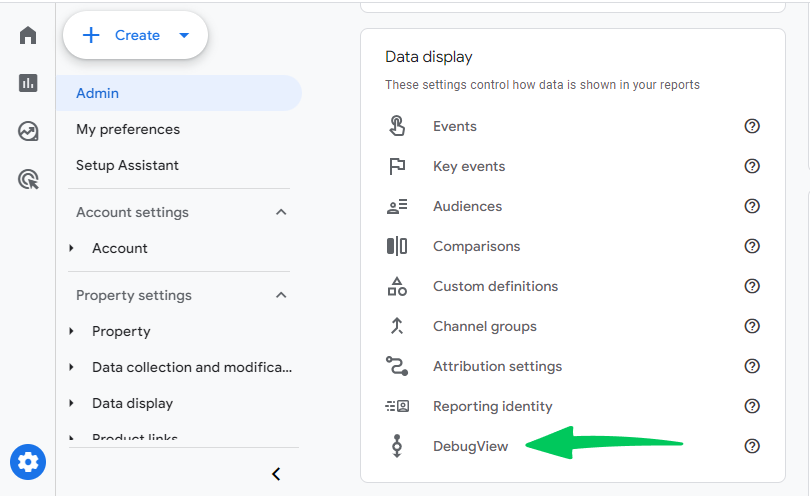
- Navigate to DebugView:
Navigate to Admin>> Debug View.
Step 4: Verify Events in DebugView
1. Monitor Events in Real-Time:
In DebugView, you will see a live stream of events being tracked.
The Seconds Stream shows events logged in the last 60 seconds.
The Minutes Stream shows a series of circles representing the most recent 30 minutes.
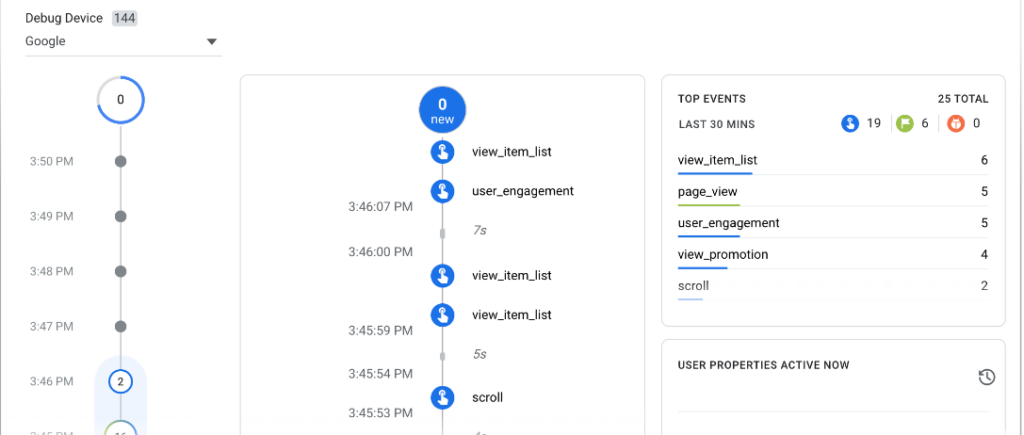
2. Analyze Event Data:
Click on individual events to view detailed parameters and user properties.
Use this information to verify that your events are being tracked correctly.
Step 5: Disable GA Debugger (Optional)
1. Disable the Extension:
If you no longer need to debug events, you can disable the GA Debugger extension by clicking the icon again.
The icon will turn gray, indicating that the extension is inactive.
Following these steps, you will successfully enable DebugView in GA4 using the GA Debugger Chrome Extension. This will allow you to monitor and troubleshoot your GA4 events in real-time.
Method 2: Enabling DebugView in GA4 Using GTM Preview and Debug Mode
Google Tag Manager (GTM) offers a preview and debug mode that allows you to test your container configurations on a live site before publishing them. This feature connects your site to Tag Assistant, enabling you to see which tags fire and in what order, thus ensuring your tags are set up correctly. Here’s a step-by-step guide on enabling DebugView in GA4 using this method.
- Log in to Google Tag Manager:
- Visit the Google Tag Manager site and sign in with your Google account.
- Select Your Container:
- Choose the container for the website or app you want to test.
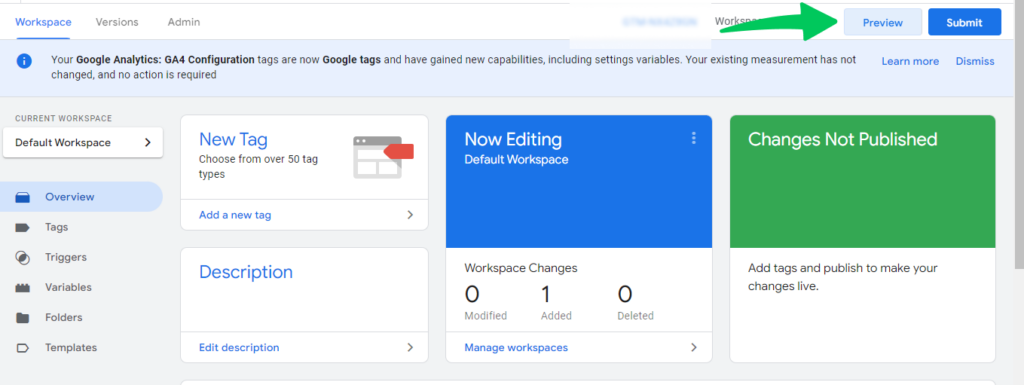
- Enter Preview Mode:
- In the top right corner of your workspace, click the “Preview” button.
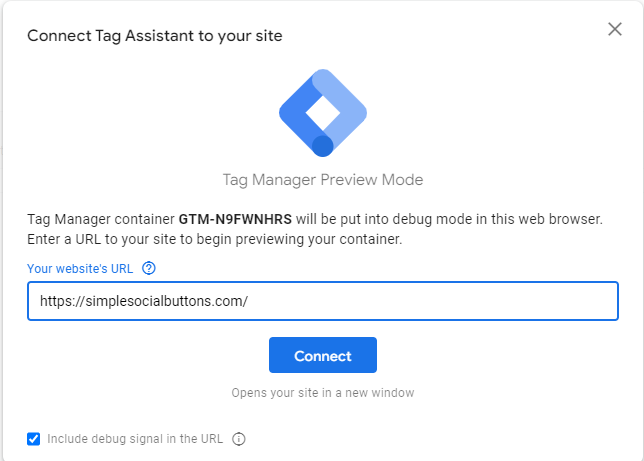
- Provide Your Site’s URL:
- Enter the URL of the site you want to debug into the “Enter URL” field.
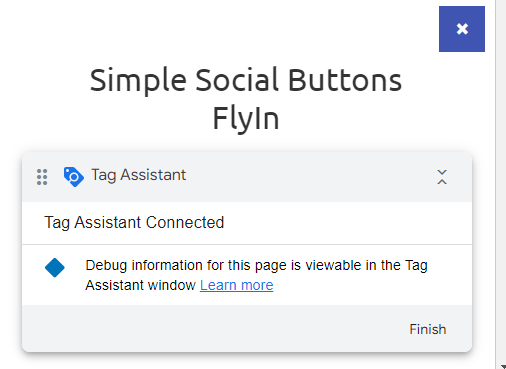
- Connect to Your Site:
- Click “Connect.” Your site will open in a new window (or a new tab if using the Tag Assistant Companion Chrome extension) and show a “Connected” status at the bottom right corner.
- Access the Debug Interface:
Return to the Tag Assistant tab and click “Continue” to open the debug interface.
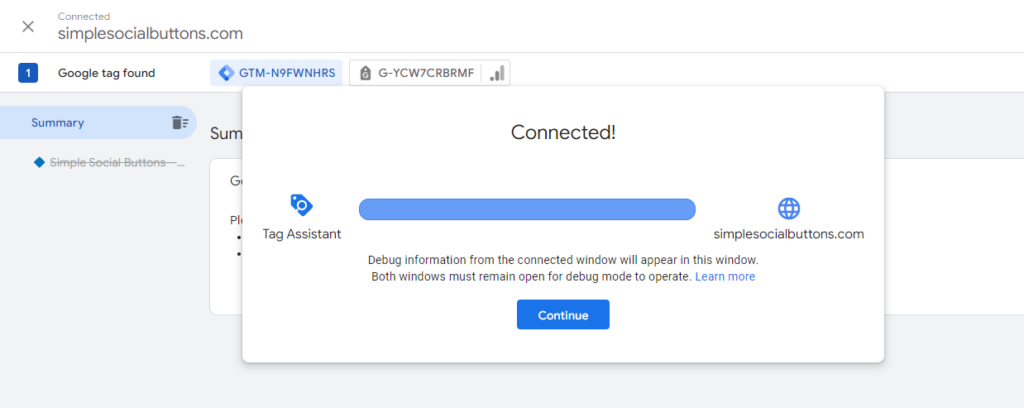
- The debug mode opens a new window or tab showing a summary about your Tags, Variables, and the Data Layer.
- Click “Tags” to see which tags fired and which did not. Selecting a tag provides details about its properties and associated triggers.
- The “Variables” tab shows detailed information about the variables for the selected event, including their types, returned data, and resolved values.
- The “Data Layer” tab displays the exact messages pushed to the data layer and its state after each event.
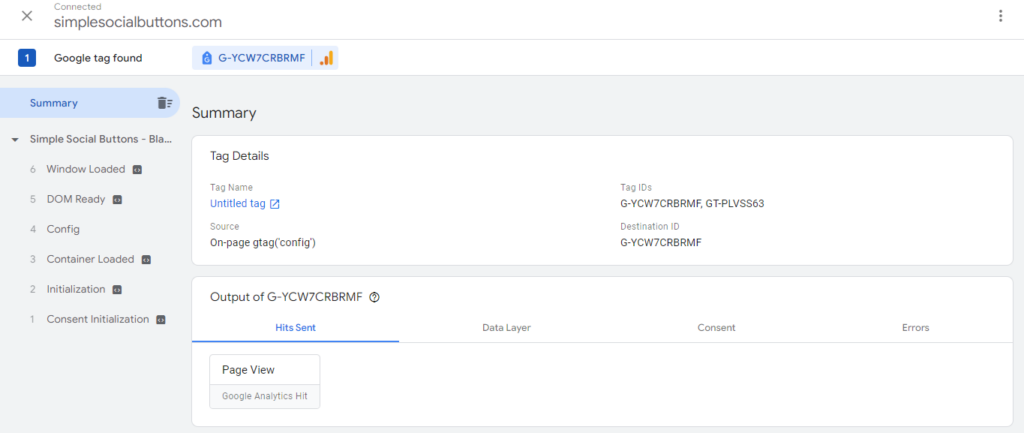
7. Go to GA4 Debug Mode
Now, you can go to GA4 Debugger, and you’ll find it is activated. You can check the details in GA4 DebugView.
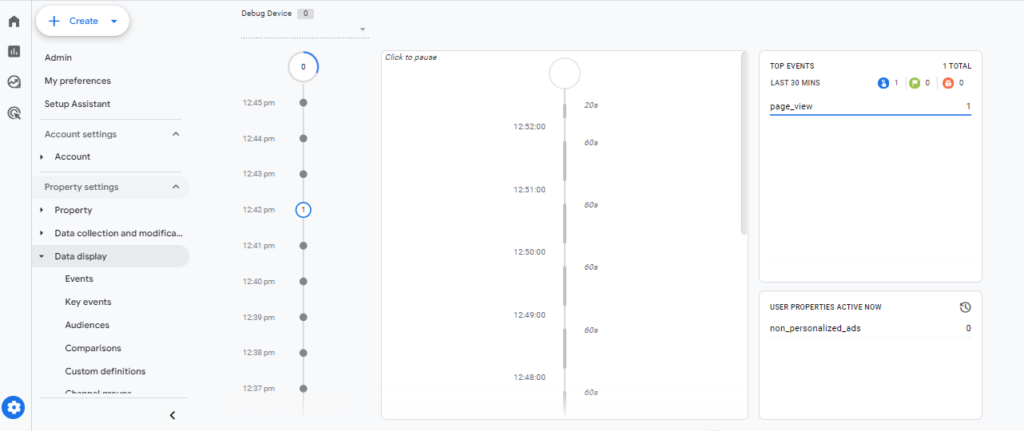
Following these steps, you can enable DebugView in GA4 using Google Tag Manager’s preview and debug mode. It helps ensure your tags are configured correctly and working as expected before you publish your container.
Method 3: Using Google Tag Assistant to Enable GA4 DebugView
Google Tag Assistant is a Chrome extension that makes it easy to test and debug your Google Analytics implementation directly from your browser. Here’s how you can use it to enable DebugView:
Download and install the Google Tag Assistant extension from the Chrome Web Store if you haven’t already.
- Enable the Extension:
- Once installed, click the Tag Assistant icon in your browser’s toolbar and ensure it’s turned on.
- Navigate to Your Site:
- Open a new tab and go to the webpage where your GA4 tracking code is implemented.
- Enable Debug Mode:
- Click the “Enable Debugging” button in the Tag Assistant popup. This action sets a cookie in your browser that activates GA4’s debug mode.

- Check DebugView in GA4:
Go back to your GA4 property in Google Analytics, navigate to the DebugView section, and see real-time data flowing in from your browser.

Using Google Tag Assistant is a quick and effective way to enable DebugView to troubleshoot and validate your GA4 setup in real time.
Overview of GA4 DebugView Interface (Main Components)
Once you have enabled DebugView in Google Analytics 4, it’s important to familiarize yourself with its interface and the main components it displays. This will help you effectively monitor and analyze the data that flows through.
Let’s explore the main components of the GA4 DebugView interface.
1. Event Stream
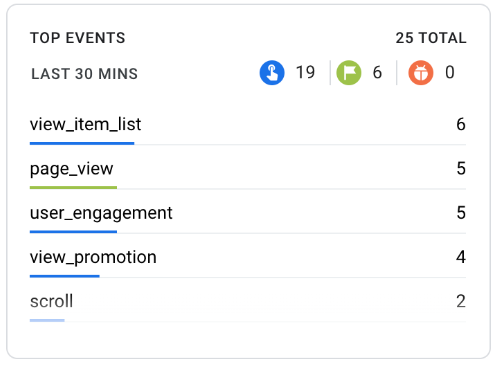
This is where you can see all the events that are being sent to GA4 in real time. Each event is listed along with its timestamp and key parameters.
2. Parameter Details
When you click on an individual event, you can see detailed information about the parameters associated with that event. This includes data like event labels, values, and user properties.
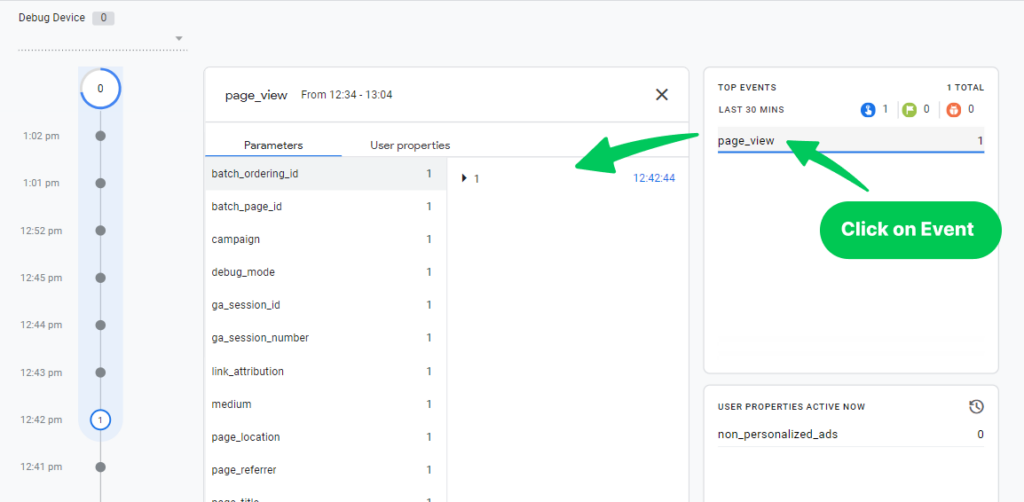
3. Seconds Stream
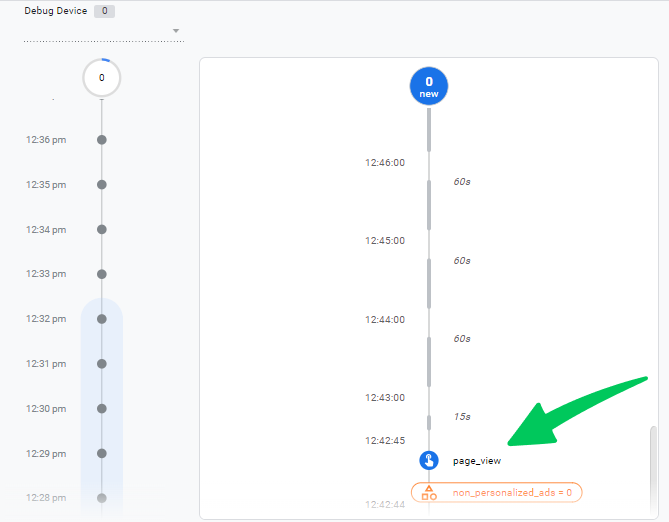
The Seconds Stream shows a list of events logged in the last 60 seconds.
Each event displays a timestamp corresponding to the time it was logged on the development device. This stream helps you see events as they happen in real time.
Details:
Event List: You will see events appearing in the stream as they occur, with the newest events at the top.
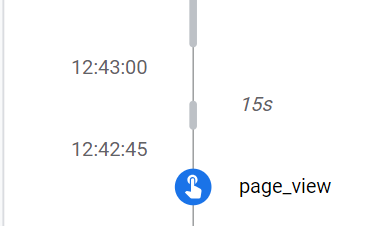
Timestamps: Each event in the Seconds Stream includes a timestamp, allowing you to understand exactly when the event was logged.
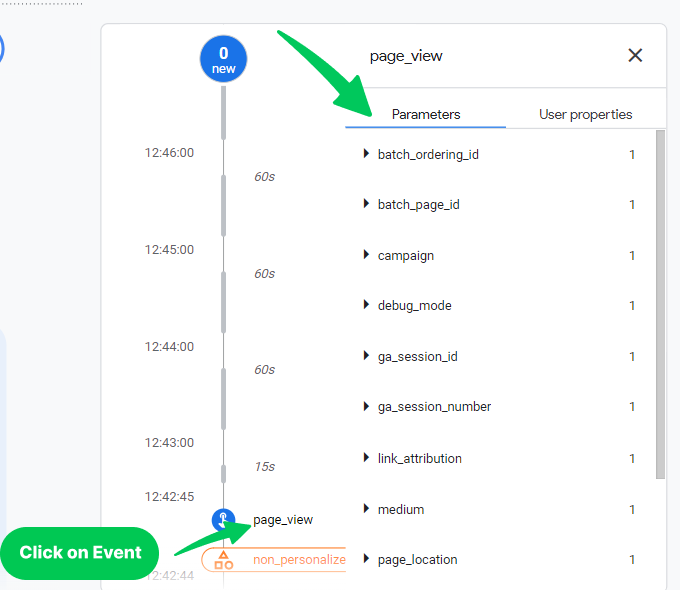
Event Details: Clicking on an event will display a list of associated parameters, providing detailed information about that event.
4. Minutes Stream
The Minutes Stream provides a broader view of events over the last 30 minutes.
It displays a series of circles, each representing one of the most recent 30 minutes.
The number inside each circle indicates the count of events received in that minute.
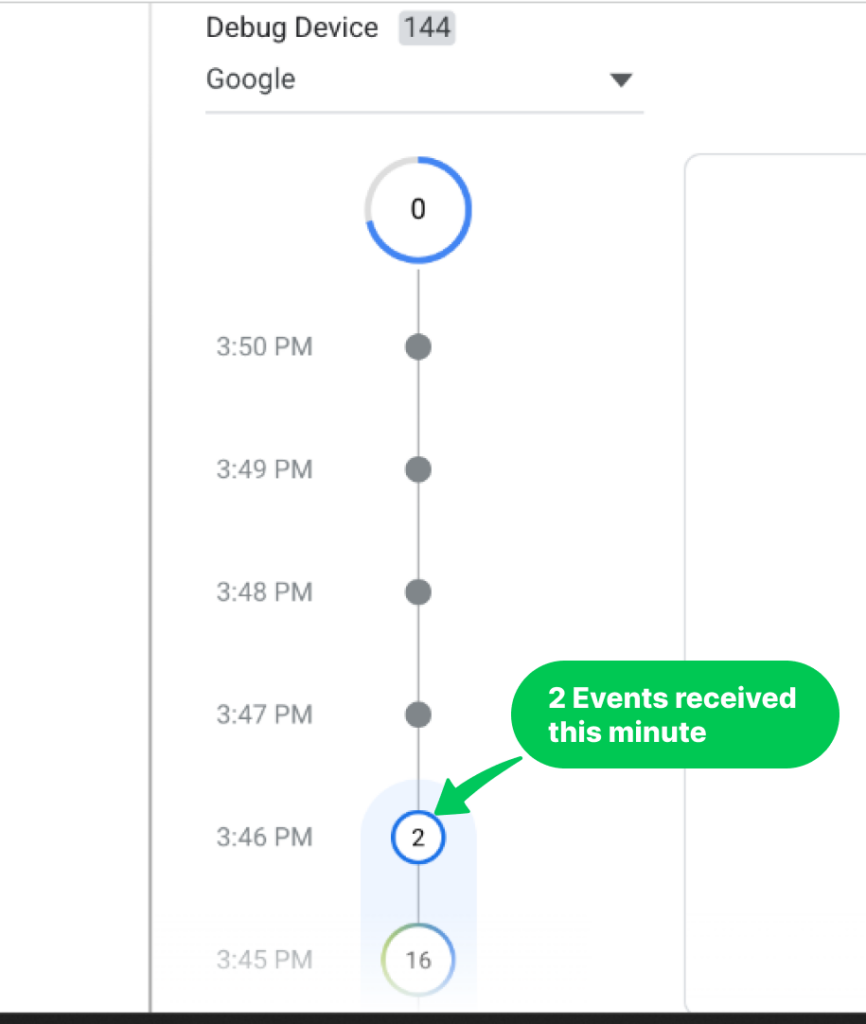
Details:
- Circles Representation: Each circle corresponds to one minute in the past 30 minutes. The number inside the circle shows how many events were logged during that minute.
- Event Count: The size and number within the circle help you quickly understand event activity over time.
- Detailed View: Clicking on a circle will populate the Seconds Stream with events that were logged during that specific minute, allowing you to drill down into the details of the events for that time period.
How to Use DebugView Report?
DebugView report in Google Analytics 4 shows detailed GA4 data to help you in analysis and troubleshooting.
Let’s learn how to use Debug view in GA4.
You can click events to see the parameters and their values.
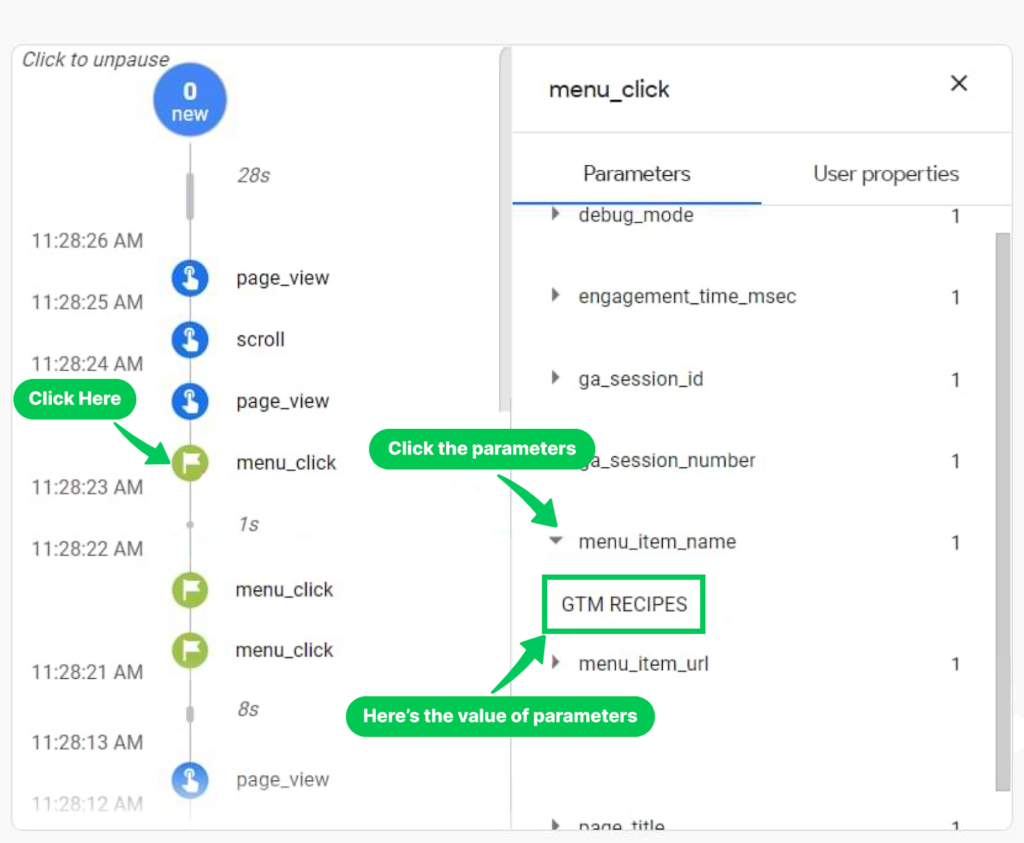
If there are a lot of events, you can pause by clicking on the white background.
In GA4 DebugView, blue icons are events, green icons are conversions, and orange icons are user properties.
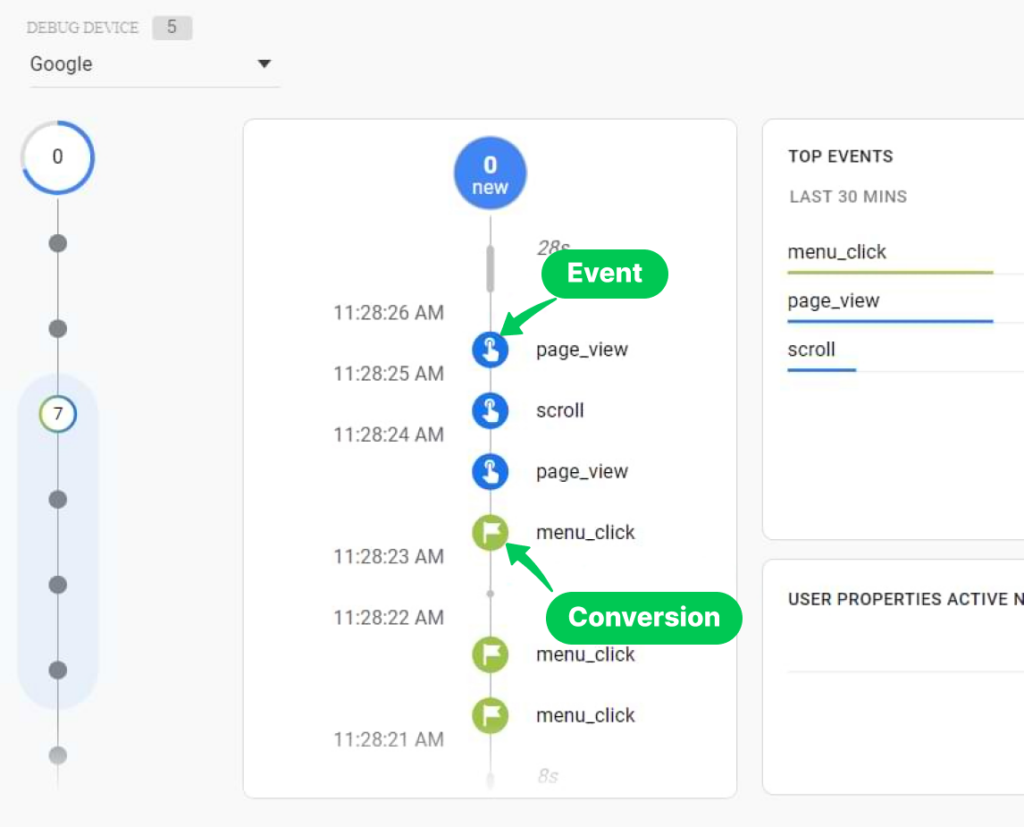
Sometimes there may be delays in getting the data. This means there might be a wait of several minutes before events show up in DebugView. It’s a little inconvenient, but hopefully, Google Analytics 4 will improve this in the future.
Practical Use Cases for DebugView Report
- Campaign Tracking: Verify that campaign-related events are being fired correctly and at the intended times.
- E-commerce Checkout Process: Monitor the sequence of events during a checkout process to ensure all steps are captured accurately.
- App Interactions: For mobile apps, DebugView can help ensure that user interactions, like button clicks and screen views, are being tracked correctly.
Here’s an example of what the DebugView report might look like during a user session:
Tips for Efficient Usage
- Regular Checks: Make it a habit to periodically check DebugView when implementing new tracking codes or making changes to your site.
- Collaborate with Developers: Share insights from DebugView with your development team to ensure technical issues are addressed promptly.
- Document Findings: Keep records of any anomalies or issues detected through DebugView for future reference and to track the resolution process.
GA4 DebugView Report Not Showing Data
Sometimes, despite setting everything up, you might find that the GA4 DebugView report is not showing any data. This can be frustrating, but there are a few common reasons why this might happen and, thankfully there are solutions to help resolve these issues.
- Debug Mode Not Enabled.
- Browser Issues.
- Incorrect Configuration.
- Network Issues.
Read our complete guide on GA4 DebugView Not Working.
Bonus: Analytify for WordPress Users
If you’re using WordPress and Google Analytics 4 (GA4), integrating Analytify can significantly enhance your analytics experience.
Analytify is a powerful WordPress plugin for analytics. It is designed to make Google Analytics simple for everyone, especially those without a technical background. It provides a user-friendly interface within your WordPress dashboard, making it easier to understand and manage your analytics data directly from your website’s backend.
Join 50,000+ Beginners & Professionals who use Analytify to Simplify their Google Analytics!
Key Features of Analytify Related to GA4 DebugView
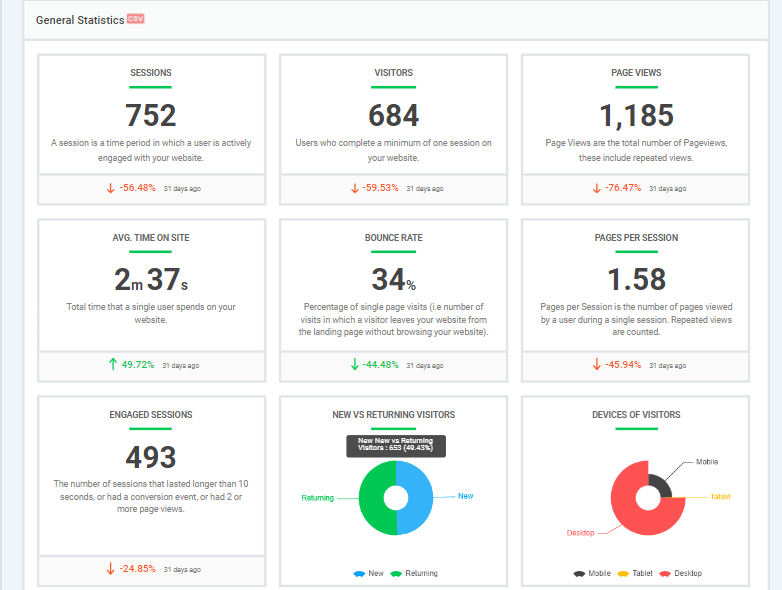
- Real-Time Stats: Analytify brings GA4’s real-time capabilities into your WordPress dashboard, allowing you to see live visitor data and event tracking without leaving your site.
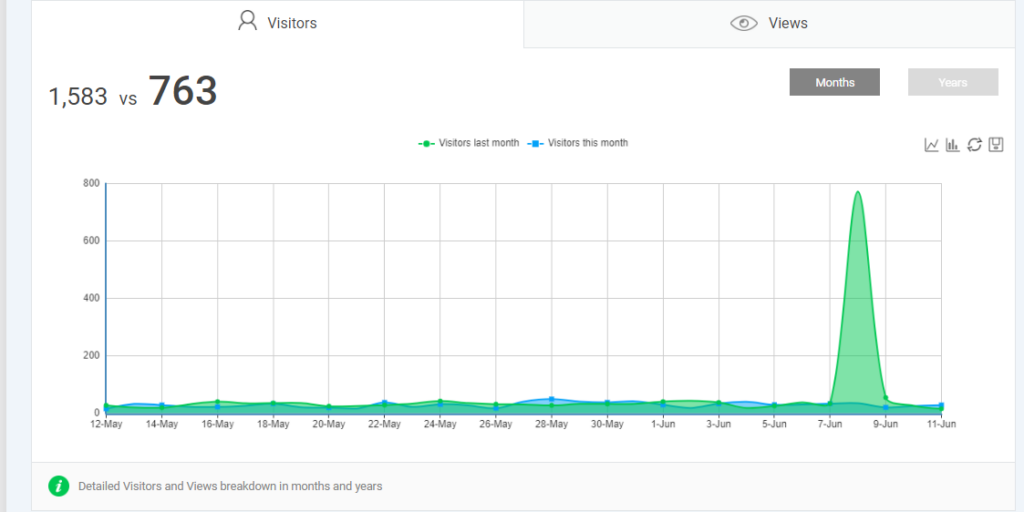
- Enhanced eCommerce Tracking: For WooCommerce store owners, Analytify simplifies the integration of GA4 eCommerce tracking, providing insights into user behavior, product performance, and conversion rates.
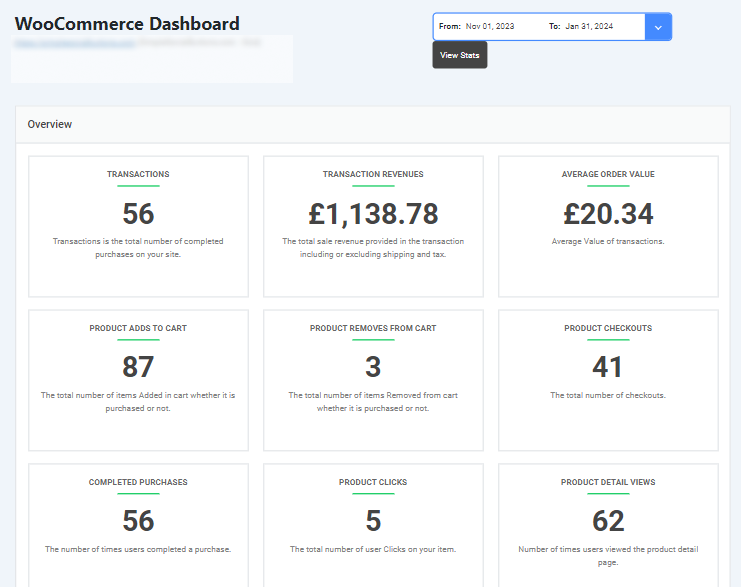
- Automated Reports: Receive automated reports summarizing your site’s performance directly in your WordPress dashboard or via email. These reports are customizable and can be tailored to highlight the most relevant metrics, including those from GA4 DebugView.
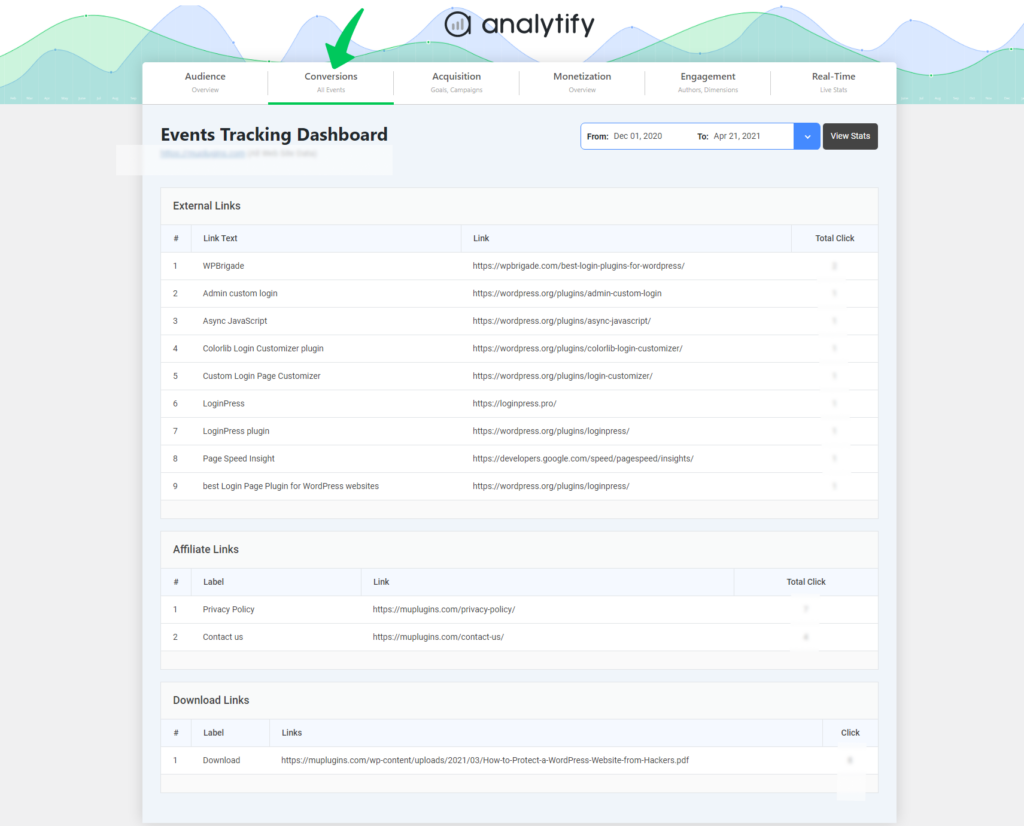
- Event Tracking Made Easy: With a few clicks (no coding necessary), you can easily set up event tracking for clicks, downloads, form submissions, and more. This feature complements the use of GA4 DebugView by simplifying the process of tracking custom events.
GA4 DebugView FAQs
What is GA4 DebugView?
GA4 DebugView is a real-time diagnostic tool within Google Analytics 4 that allows users to monitor and validate analytics data as it’s collected. It provides a live feed of events and data streams, helping users to troubleshoot and ensure the accuracy of their analytics setups.
How do I enable GA4 DebugView?
To enable GA4 DebugView, you can use one of several methods:
Google Tag Assistant: Use the Google Tag Assistant Chrome extension to enable debugging on your site.
Direct GA4 Configuration: Add the debug_mode: true parameter to your GA4 configuration code on your website.
Browser Extensions: Install a browser extension like GA Debugger to toggle debug mode for your analytics.
Why is no data showing in my GA4 DebugView?
If you’re experiencing issues with no data appearing in DebugView, consider the following troubleshooting steps:
Ensure that debug mode is activated.
Check for any misconfigurations in your tracking code.
Verify that no browser extensions or privacy settings are blocking the data.
Confirm that your network settings allow traffic to Google Analytics servers.
Can I use GA4 DebugView for mobile app analytics?
Yes, GA4 DebugType is also valuable for mobile app analytics. It allows you to monitor app events in real time, making it an essential tool for developers and marketers to ensure that their app tracking setups are functioning correctly.
How can I troubleshoot tracking issues with GA4 DebugView?
To troubleshoot tracking issues in DebugView, follow these steps:
Confirm that all events are correctly configured in your GA4 settings.
Use the event details in DebugView to check for any missing or incorrect parameters.
Review the error reports within DebugView for guidance on what might be going wrong.
If necessary, consult Google’s documentation or seek help from the GA4 community or support forums.
How does GA4 DebugView help with digital marketing?
GA4 DebugView assists digital marketers by providing immediate feedback on how events are tracked, which is crucial for campaign tracking, user interaction analysis, and optimization of digital marketing strategies. It ensures that all marketing actions are measurable and data-driven.
GA4 DebugView Report vs. GTM Preview Mode: Which is Better for Troubleshooting?
DebugView ensures your GA4 configuration is accurate, while GTM Preview Mode ensures that all tags managed through GTM are firing as intended.
GA4 DebugView is best used for monitoring and validating GA4-specific configurations and data streams in real-time. It allows you to see exactly what data is being sent to GA4 and is especially useful for checking that your GA4 setup captures the correct events and parameters as expected.
While, GTM Preview Mode is used for debugging and testing Google Tag Manager setups. It shows which tags are firing on a page and what triggers and variables are involved.
Should You Rely on the DebugView Report or the Real-Time Report in GA4 for Debugging?
Both DebugView and the Real-Time report in GA4 have their uses, but they serve different purposes:
DebugView is specifically designed for debugging and should be your go-to option when testing and validating event tracking. DebugView provides a more detailed and technical look at the data as it’s collected, including errors and event specifics
While, GA4 Realtime Reports also provide real-time data. This report is less detailed and is better suited for monitoring general activity on your site or app, such as the number of active users.
Final Thoughts on GA4 DebugView
As we wrap up our in-depth exploration of GA4 DebugView, it’s clear that this tool is an indispensable asset for anyone utilizing Google Analytics 4. Whether you’re a digital marketer, a web developer, or an analytics specialist, understanding and effectively using DebugView can dramatically improve the accuracy and reliability of your data tracking efforts.
Recap:
- Real-Time Troubleshooting: GA4 DebugView allows you to monitor and validate data as it comes in, providing immediate feedback and enabling quick fixes.
- Detailed Insights: Unlike more generalized real-time reports, DebugView offers detailed insights into each event, helping you understand not just what is happening but why.
- Versatility: It supports troubleshooting across various platforms, including websites and mobile apps, making it a versatile tool for various projects.
Thank you for following along with this guide on GA4 DebugView.
You may also like to read How to Track File Downloads in Google Analytics 4 (2024).
Feel free to reach out if you have any further questions, need clarification on any points, or wish to explore other features of GA4 or digital analytics tools.


