How to Use GA4 Anomaly Detection Insights in WordPress (2026)

GA4 anomaly detection flags a traffic, conversion, or revenue metric when it moves outside its expected range, and Custom Insights can email you when that happens.
I recommend setting up two alerts today: one for daily sessions and one for daily key events. Both are Custom Insights that you create inside GA4.
This guide is for WordPress site owners who want early warning when traffic or conversions drop. I show you what GA4 anomaly detection is, how to configure email alerts, how to investigate an anomaly in three steps, and how Analytify supports that investigation from inside your WordPress dashboard.
GA4 Anomaly Detection (TOC):
What Is GA4 Anomaly Detection and How Does It Work?
GA4 anomaly detection is a machine learning feature . It flags a metric when the metric moves outside its expected range. Automated Insights need no configuration.
GA4 has two types of insights: Automated Insights and Custom Insights.
Automated Insights are GA4’s passive detection layer. The system scans your data in the background and surfaces a card on the GA4 Home screen when it detects an unusual change. No setup is needed, but you have to go looking for it inside GA4.
Custom Insights allow you to create automatic anomaly alerts in GA4 to detect traffic spikes and drops without manual monitoring.
Custom Insights (GA4 Alerts) are the proactive layer. You define the condition. When the condition is met, GA4 shows the insight on the Insights dashboard and emails the addresses you entered. An alert like this keeps working when you are not watching your dashboard.
Accuracy note: GA4 applies a Bayesian state-space time series model to your historical data. The training period is 2 weeks for hourly detection, 90 days for daily detection, and 32 weeks for weekly detection. GA4 flags a data point as an anomaly when the actual value falls outside the model’s predicted range.
Important: In low-traffic sites, anomaly detection can occasionally produce false positives due to limited historical data.
How Do You Set Up Anomaly Alerts GA4 with Custom Insights?
To set up GA4 anomaly alerts, open View all insights from the GA4 Home page, click Create, and define a Custom Insight. Setup takes a few minutes, and the alert then runs in the background.
Note: If you haven’t Set Up GA4 yet, read How to Set Up Google Analytics 4 in an easy way.
You can set up GA4 insights for sudden changes in a few clicks:
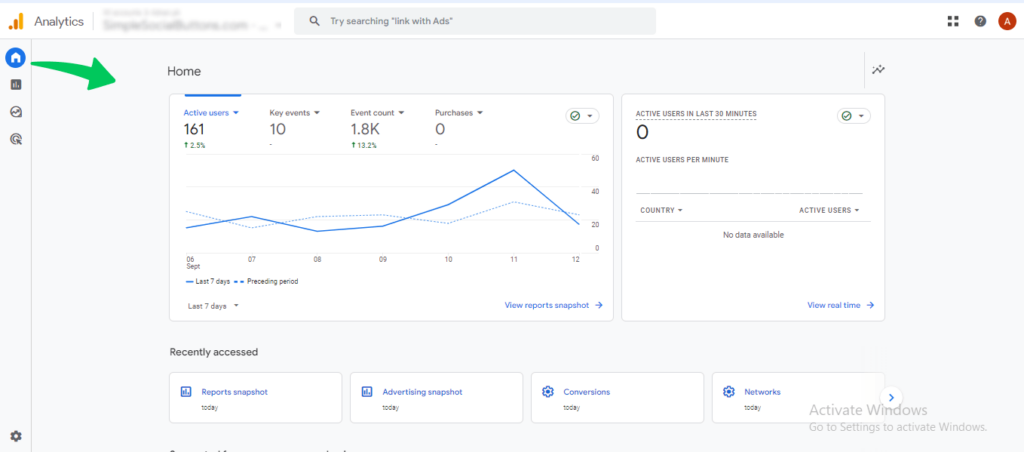
- Log in to GA4 and click the Home tab.
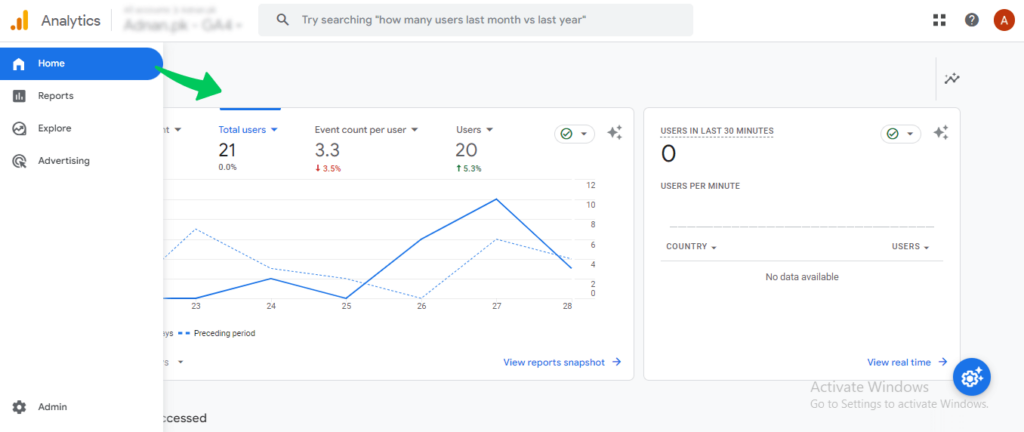
- Scroll down until you see the Insights and recommendations section. Click View all insights.
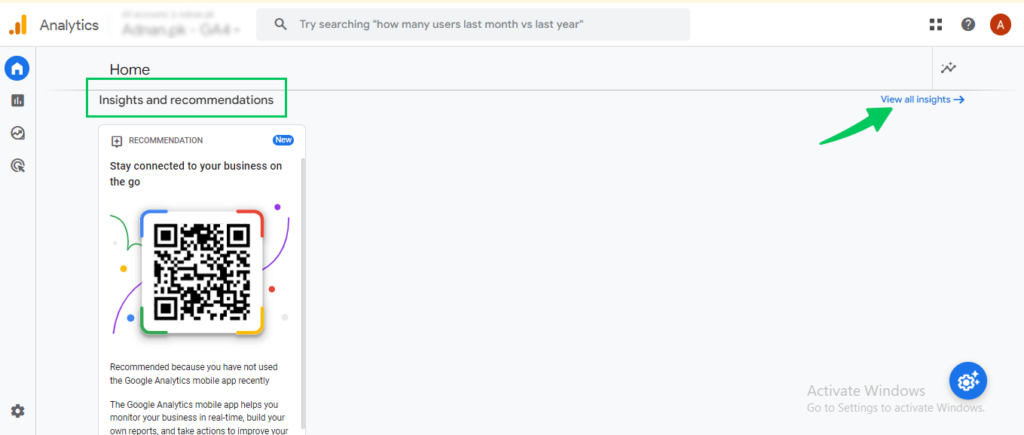
- On the Insights page, you will see two tabs. Click Create.
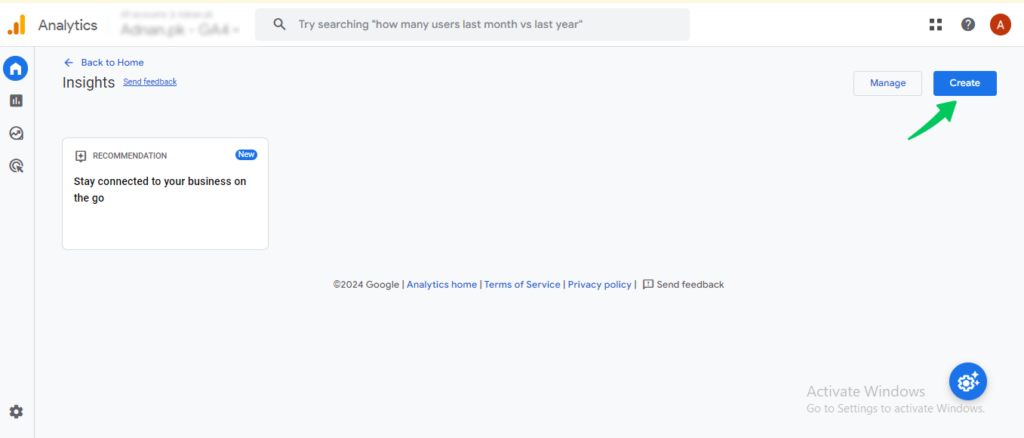
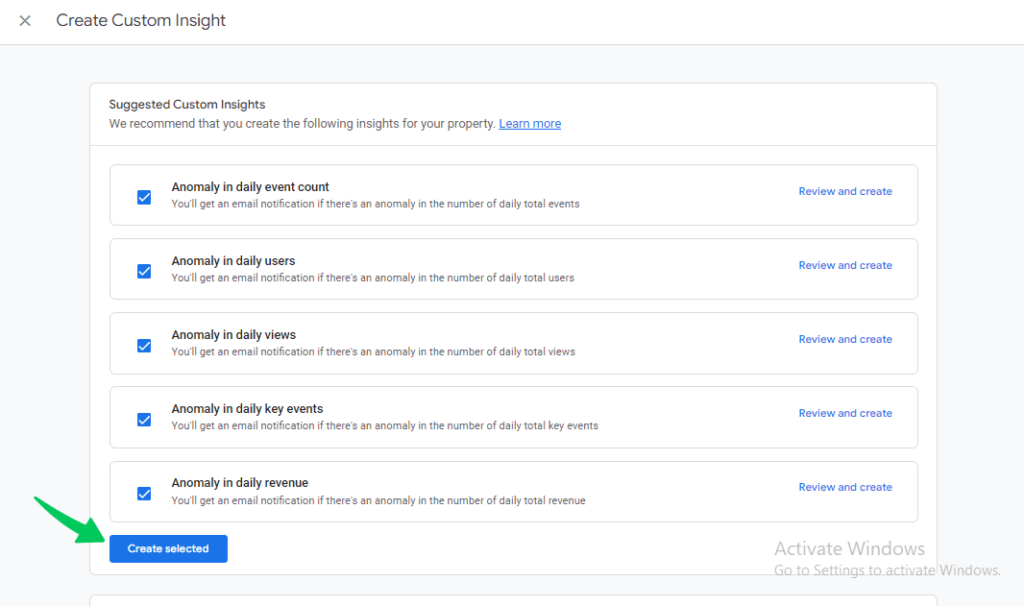
- GA4 shows suggested insights with pre-filled conditions. To use suggestions as they are, select the check box for each one, then click Create selected. To use a suggestion as a template, click Review and create in its row, adjust the condition, then click Create. To build your own, click Create new under Start from scratch.
- Set Evaluation Frequency: choose Hourly for critical metrics like sessions or revenue, Daily for most monitoring needs, or Weekly or Monthly for trend-level tracking. Hourly evaluation is available only for web data.

- Set Segment: use All Users for site-wide monitoring, or narrow to Organic Traffic to watch SEO health specifically.
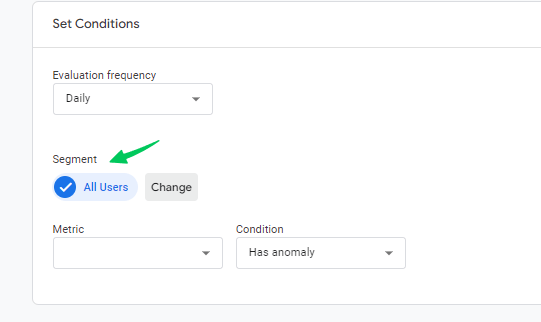
- Choose your Metric: Sessions, Users, Key Events, Event Count, Engagement Rate, or Revenue.

- Set Condition: choose Has Anomaly to let GA4’s ML model decide, or set a manual threshold, such as one that is more than 20% lower than the previous period.
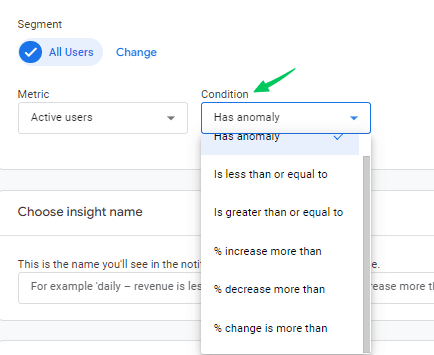
- Give the alert a clear name (for example, Daily Session Drop), enter the email addresses for notifications, and click Create.
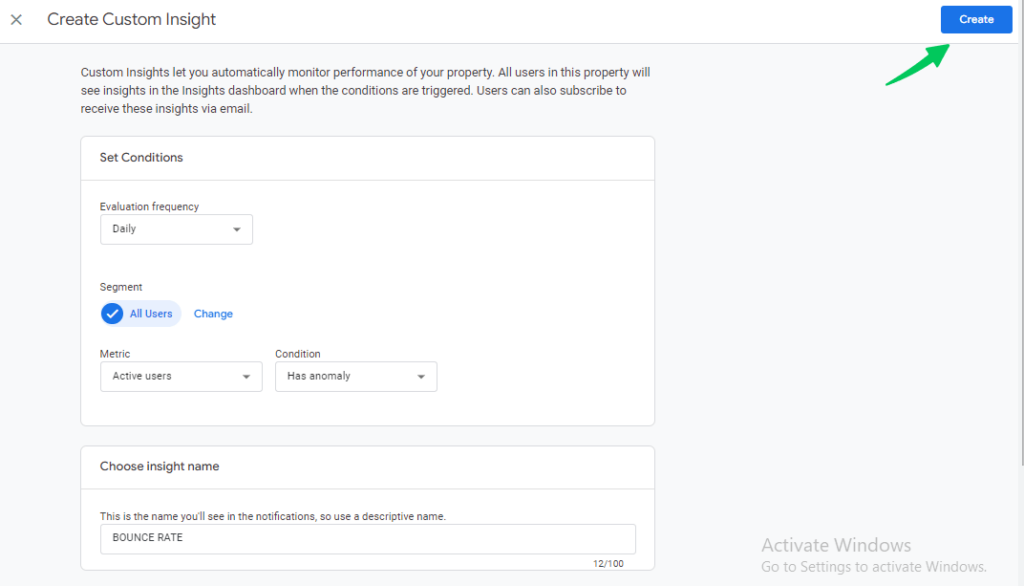
Recommended alerts to set up from day one:
- Daily Sessions: Has Anomaly
- Daily Key Events: Has Anomaly
- Organic Traffic: is more than 30% lower than the previous week
- Revenue (eCommerce sites): Has Anomaly
That completes the setup. The next section explains what to do when an alert fires.
How Do You Investigate a GA4 Anomaly Without Getting Lost in Reports?
To investigate a GA4 anomaly, confirm the drop is real, find the channel that lost traffic, then check your highest-traffic pages. GA4 shows what changed, and these three steps help you find the cause.
Step 1: Confirm It Is a Real Traffic Issue, Not a Tracking Problem
Confirm that the drop is real before you act. A plugin update, site migration, or theme change around the same time as the alert can break GA4 tracking and create a false drop.
Go to GA4, open Reports, and click Realtime. If active users look normal, but your alert fired for a past period, the tracking code is the likely culprit, not your traffic.

Step 2: Isolate the Source
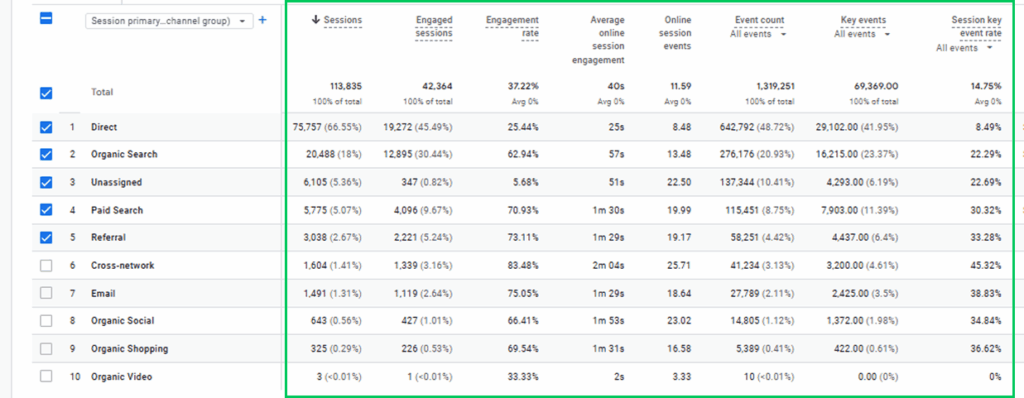
Go to Reports >> Acquisition >> Traffic Acquisition. Look for which channel lost volume: organic, direct, paid, or social.
If organic drops, check Google Search Console for manual actions, algorithm updates, or crawl errors. If all channels dropped equally, the site itself is the issue. Check server uptime, error logs, or whether the GA4 tracking tag is still firing correctly.
Step 3: Check Your Highest-Impact Pages
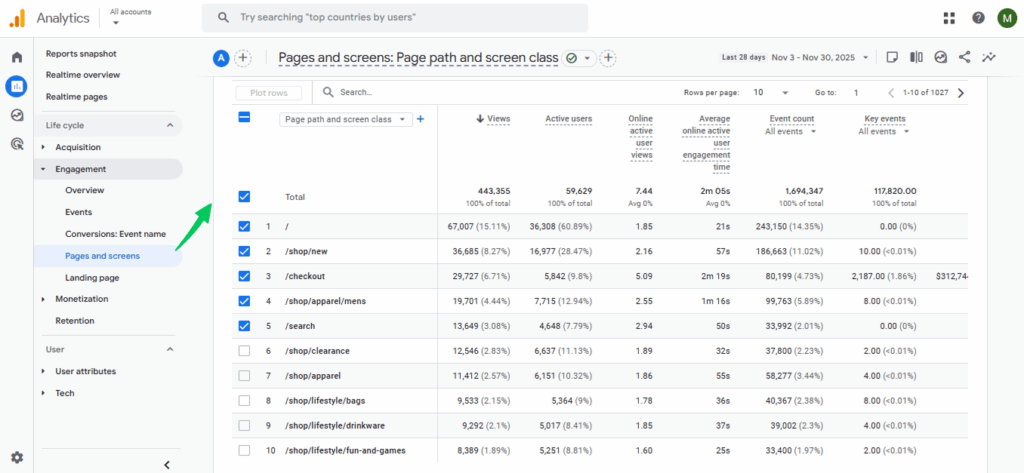
Go to Reports >> Engagement >> Pages and Screens. Sort by Sessions. Look for pages that normally drive volume but are suddenly underperforming.
A single broken page or an accidentally redirected URL can explain a significant traffic drop.
What to Do When a GA4 Anomaly Alert Fires (5-Step Workflow)

Analytify brings sessions, traffic sources, and per-page engagement into WordPress, so you can follow the three investigation steps without opening GA4.
How to use GA4 Anomaly Detection in WordPress (Using Analytify)?
Join 50,000+ Beginners & Professionals who use Analytify to Simplify their Google Analytics!
You can monitor GA4 anomalies from WordPress by pairing GA4 email alerts with Analytify, which shows your GA4 reports inside the WordPress dashboard.
Automated Insights appear only inside GA4, so you have to open GA4 to see them.
Analytify adds two monitoring layers in WordPress: scheduled email summaries (proactive) and dashboard reports for investigation (reactive).
Proactive Monitoring: Analytify Email Notification Add-on
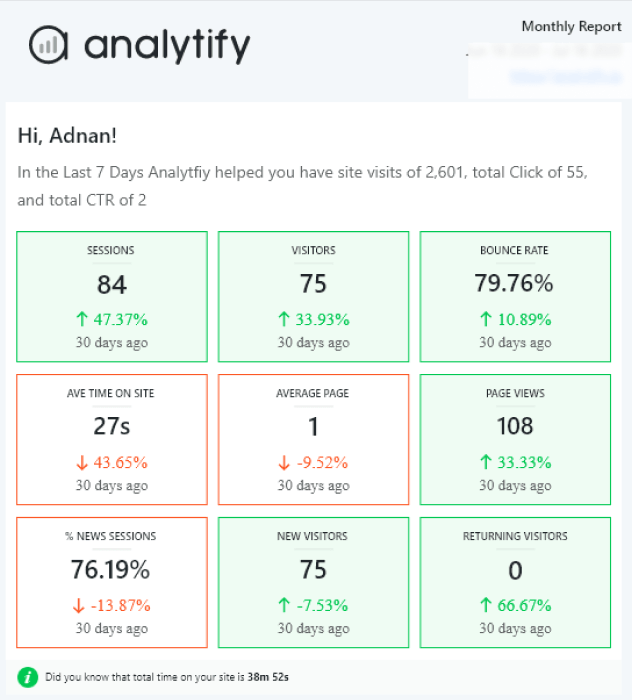
Analytify’s Email Notification add-on sends scheduled email summaries on a daily, weekly, or monthly schedule. You choose which metrics are included: sessions, traffic sources, top pages, and conversions.
Read How to Set Up Email Notifications Addon.
Analytify lets you add multiple recipients to each report, so team members and clients stay informed without needing GA4 access. No login required.
Analytify also supports threshold-based alerts through the add-on, so you can define a range for a key metric and receive a notification when it falls outside that range. It is a lightweight monitoring layer that runs entirely from your WordPress dashboard.
Reactive Investigation: Analytify WordPress Dashboard
When a GA4 alert fires and you need to diagnose what happened, Analytify brings your key data into WordPress so you can investigate without opening GA4.
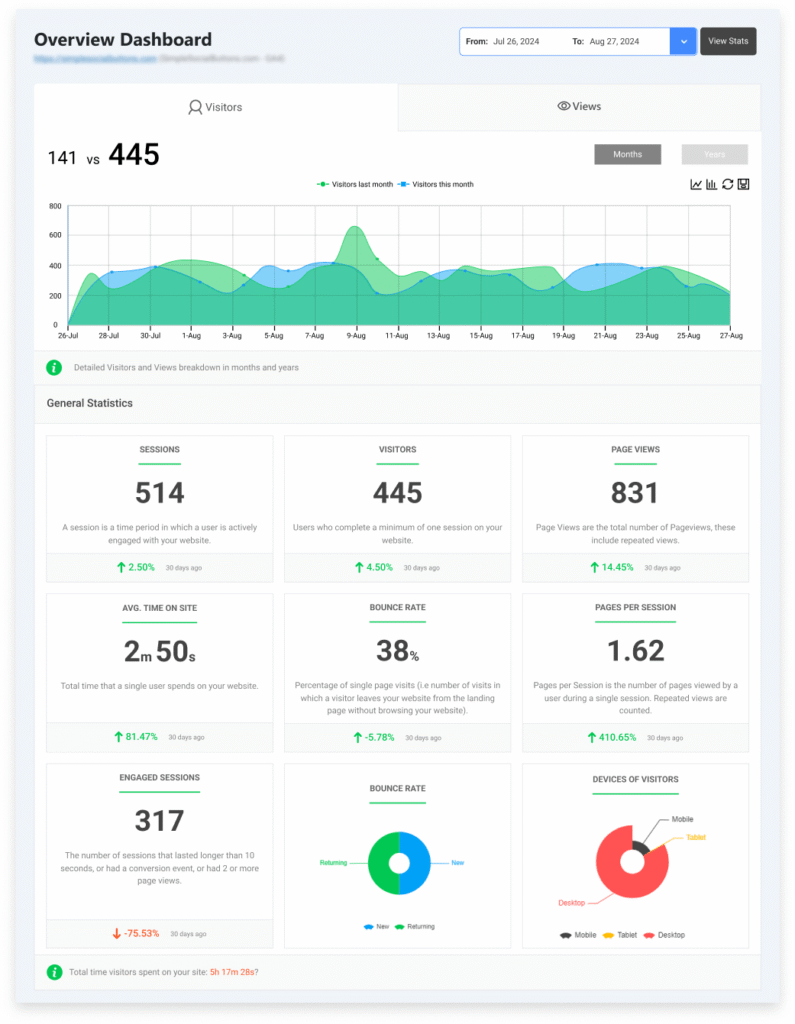
Analytify shows sessions, users, engagement, and traffic sources in one dashboard view inside WordPress. No report-building, no tab-switching.
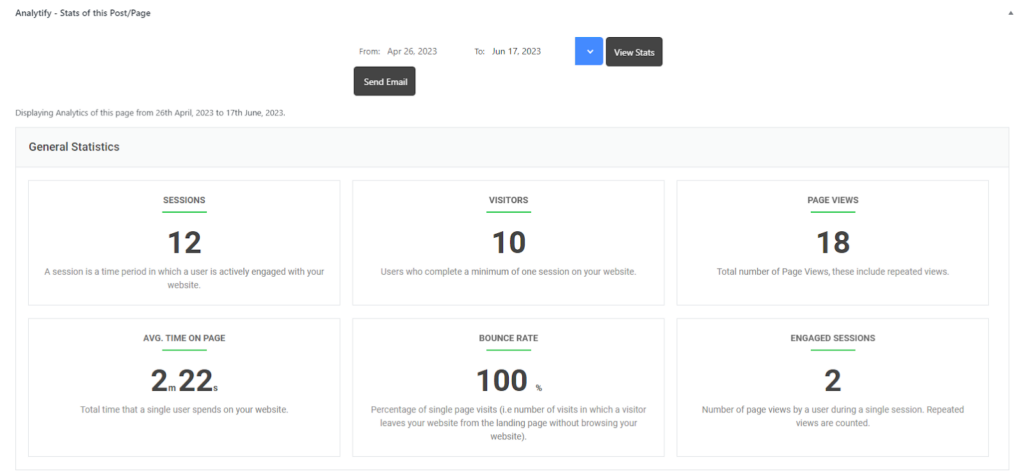
Analytify provides per-post and per-page engagement reports accessible directly inside the WordPress editor. If a specific page drove the anomaly, you can drill into its data without leaving the post.
Analytify also surfaces real-time stats so you can confirm whether traffic has recovered immediately after an incident.
The Email Notification add-on is included with Analytify Pro. See Analytify pricing at analytify.io/pricing/
Which GA4 Anomaly Alerts Should You Actually Act On?
Act first on any conversion drop. GA4 flags both positive and negative anomalies, and not every flag needs a response. The table below shows which ones to investigate.
| Anomaly Type | Likely Cause | Action? |
|---|---|---|
| Sudden traffic spike | Viral content, PR mention, campaign launch | Investigate the source, and double down if the spike is earned |
| Traffic drop (organic only) | Algorithm update, crawl error, ranking loss | Check Google Search Console immediately |
| Traffic drop (all channels) | Broken tracking code, site downtime, GA4 misconfiguration | Check site uptime and GA4 tag first |
| Conversion drop (sessions normal) | Broken form, redirect issue, CTA change | Test key forms and CTAs |
| Engagement rate drop | New traffic source bringing low-quality visits | Check Traffic Acquisition by source |
The most important metric to protect is conversions. A traffic spike that does not convert is interesting, but not urgent. A traffic drop that does not affect conversions may be a low-quality traffic source falling away, which can actually be a good sign.
A conversion drop always warrants immediate investigation, regardless of whether sessions look normal.
Frequently Asked Questions
What is GA4 anomaly detection?
GA4 anomaly detection is a machine learning feature that monitors your analytics data and flags when a metric moves outside its expected range. The system accounts for day-of-week patterns and seasonal trends, so it distinguishes between a normal Sunday traffic dip and a genuine drop that needs attention.
Do I need to set up GA4 anomaly detection manually?
Automated Insights run without any configuration. GA4 surfaces them on the Home screen automatically. Custom Insights (email alerts) require a one-time setup in GA4’s Insights section, where you define the metric, frequency, and email recipients. The setup takes under five minutes.
How does GA4 decide that something is an anomaly?
GA4 uses a Bayesian statistical model trained on 90 days of daily data, 2 weeks of hourly data, or 32 weeks of weekly data, depending on the evaluation frequency you select. The model calculates an expected range for each metric and flags data points that fall outside it. The model is site-specific, so your actual traffic patterns define what counts as unusual.
Can I see GA4 anomaly data inside WordPress?
GA4 anomaly alerts are delivered by email when triggered. To investigate inside WordPress without switching to GA4, Analytify brings your key reports, including sessions, traffic sources, per-page engagement, and real-time stats, directly into the WordPress dashboard. You can diagnose most anomalies without leaving your site.
What is the difference between automated insights and custom insights in GA4?
Automated insights are generated by GA4’s AI without any configuration. They appear passively on the Home screen and require you to log in and look for them. Custom insights are alerts you create with specific metrics, thresholds, and email notifications. For proactive monitoring, custom insights are the feature you actually need.
Why is GA4 anomaly detection not showing insights?
GA4 may not show anomalies if your property lacks sufficient historical data, traffic volume is too low, or the selected metric does not have stable patterns for the model to evaluate.
GA4 Anomaly Detection: Final Thoughts
GA4 anomaly detection catches problems you would miss manually, as long as alerts are configured and you know how to act on them.
Three actions to take today:
- Set up at least two Custom Insights in GA4: one for daily sessions (Has Anomaly) and one for daily key events (Has Anomaly).
- Install Analytify to monitor your GA4 data from your WordPress dashboard and investigate alerts without opening GA4.
- Bookmark the triage table above for when an alert fires. Use it to decide immediately whether the flag is a fire or just noise.
Further Readings:
- How to Track Form Submissions in GA4 with Analytify : monitor conversion events so your anomaly alerts catch form drop-offs.
- How to Set Up Google Analytics Email Reports : configure scheduled email summaries to track traffic changes.
Which GA4 anomaly are you most worried about missing: a traffic drop, a conversion dip, or something else? Let us know in the comments.