How to Build a Marketing KPI Dashboard? 13 Essential Metrics for Growth

A marketing KPI dashboard shows your most important marketing metrics, such as traffic, conversions, and ROI, in one view so you can spot changes and decide where to act.
To build one, define clear goals, choose 5 to 7 KPIs tied to them, segment by channel, add comparisons, and automate data collection. A well-structured dashboard then pulls traffic, conversions, ROI, and other key metrics into a single view.
A Marketing KPI dashboard is important because it makes reporting easier, helps spot trends, and keeps the team focused on the same goals.
Before you build one, set up your GA4 tracking. I recommend the guide on How to Set Up Google Analytics 4 and Connect it to Your WordPress Site? for the full setup steps.
This guide is for marketers, agencies, and site owners who report on campaign performance. I cover what a marketing KPI dashboard is, its benefits, 13 keys to building one, best practices, and how Analytify shows KPIs inside WordPress.
Marketing KPI Dashboard (TOC)
What is a Marketing KPI Dashboard?
A Marketing KPI Dashboard organizes and visually displays the most important marketing performance indicators in one place.
Instead of switching between different platforms like Google Analytics, email tools, or ad managers, a KPI dashboard brings everything together in one place.
It shows key data such as website traffic, conversion rates, cost per lead, customer acquisition cost, and return on investment (ROI).
The main purpose of this dashboard is to simplify performance tracking. Charts, graphs, and tables show how campaigns perform across channels, so marketers and business owners can understand results quickly.
For example, imagine you’re running multiple campaigns across Google Ads, social media, and email marketing. A KPI dashboard can combine all these results and display them in charts or graphs.
Benefits of Using a Marketing KPI Dashboard
Here are the following benefits of using a marketing KPI dashboard:
- Centralized Data: View all marketing KPIs in one place without switching tools, reducing manual exports.
- Real-Time Monitoring: Track campaign performance as it happens and catch spikes or anomalies early so that you can troubleshoot issues.
- Quick Insights: Visual charts and summaries make it easy to spot trends, patterns, and issues instantly, so complex metrics become clear and understandable.
- Resource Optimization: See ROI and cost metrics together to spot underperformers and reallocate budget, creative, or effort to the campaigns and audiences that deliver.
- Team Alignment: Share a single dashboard to keep marketers, managers, and stakeholders aligned on goals and progress on the same page.
- Transparency: Easily share performance results with clients or leadership.
- Goal Tracking: Map KPIs to targets and alerts; measure progress, forecast outcomes, and know when you’re ahead or behind so you can adjust plans in time.
13 Keys to Creating a Perfect Marketing KPI Dashboard
Follow these 13 keys to build a marketing KPI dashboard that works:
1. Define Clear Marketing Goals
Start by aligning your Marketing KPI dashboard with specific, measurable objectives such as boosting lead volume, improving conversion rates, or increasing brand awareness. Clear goals make sure your dashboard tells a meaningful story, instead of just showing raw data.
Clear goals help you select the right KPIs, focus your efforts, and measure success against benchmarks rather than undefined outcomes.
Clear goals also guide which reports you need and how to present them. This clarity also aligns internal teams and stakeholders around what success looks like.
2. Select the Right KPIs (Traffic, Conversions, ROI)
Choose KPIs that directly reflect your strategic goals, such as website traffic, conversion rate, cost per acquisition (CPA), customer lifetime value (CLTV), return on investment (ROI), or return on ad spend (ROAS).
Each metric should help you analyze performance accurately. Tracking too many KPIs can reduce focus, so use the 5 to 7 most relevant metrics.
3. Focus on Actionable Metrics, Not Vanity Metrics
KPI dashboards for marketers should highlight actionable data, not vanity metrics. Avoid metrics that look impressive but offer little strategic insight, like total page views or social media followers without engagement context.
Instead, emphasize actionable data: conversion rate, qualified leads, churn rate, or revenue per campaign. These figures can directly inform decisions like budget shifts or campaign tweaks.
4. Keep the Dashboard Simple and Visual
Keep the dashboard simple and visual. Use bar, line, and funnel charts so readers can interpret the data at a glance. Dashboards with endless numbers can confuse readers.
Avoid unnecessary visual stuffing like pie charts or excessive gridlines, and keep the layout simple and easy to follow. Prioritize readability by placing key metrics top-left, with supporting detail below.
Dashboards should save time, not add complexity. Following this dashboard best practice helps stakeholders quickly understand performance without having to go through detailed reports.
5. Segment by Channel (PPC, SEO, Social, Email)
One of the most useful marketing dashboard tips is to break down KPIs by channel. Instead of viewing overall traffic or conversions, segment performance across PPC, SEO, social media, and email.
This makes it easier to see which channels drive results, which need improvement, and how they work together.
For example, PPC may generate leads faster, while SEO drives long-term organic growth. Segmenting data ensures your Marketing KPI dashboard tells a complete story.
6. Show Real-Time Data
A KPI dashboard for marketers should pull current data from integrated sources like Google Analytics, ad platforms, or email tools. Google Analytics Realtime data typically takes a few minutes, while standard reports can take 24 to 48 hours to finish processing. Use Realtime to monitor and processed reports to decide.
Real-time insights allow timely adjustments in budget allocation or campaign optimization, which is especially important for channels like paid ads, where conditions shift daily.
7. Add Comparisons (vs. Benchmarks, Past Periods)
Data in isolation lacks context. That’s why a key part of marketing KPI reporting is adding comparisons against past periods, setting benchmarks, or industry standards.
Seeing progress over time helps you identify growth trends, seasonality, or areas falling behind expectations.
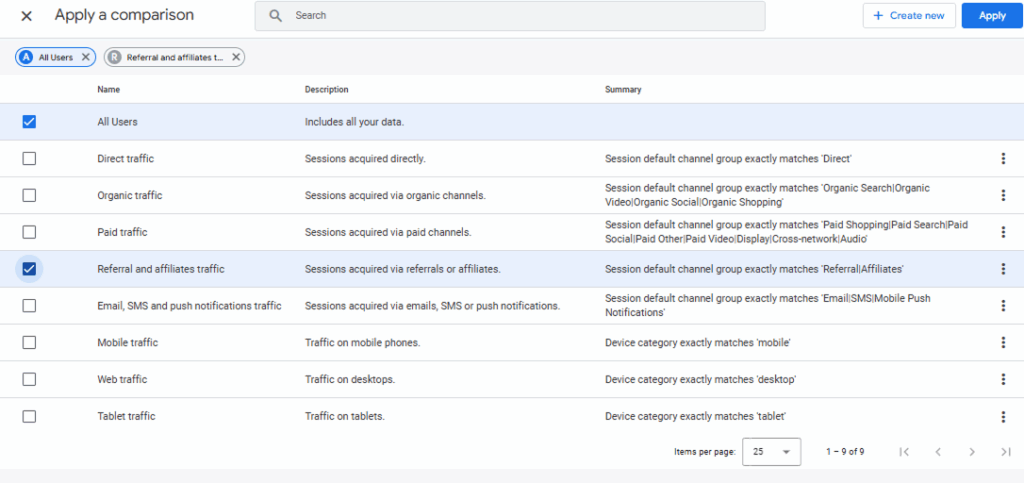
For example, comparing conversion rates month-over-month highlights campaign effectiveness, while benchmarking cost per lead against industry averages shows competitiveness. This is one of the dashboard’s best practices that makes insights more useful.
8. Customize for Audience (Marketer vs. Executive View)
Different audiences care about different details. Marketers often focus on numbers like click-through rates, bounce rates, or funnel drop-offs, while executives are more interested in broader KPIs such as ROI and revenue impact.
That’s why it helps to adjust your Marketing KPI dashboard for each audience.
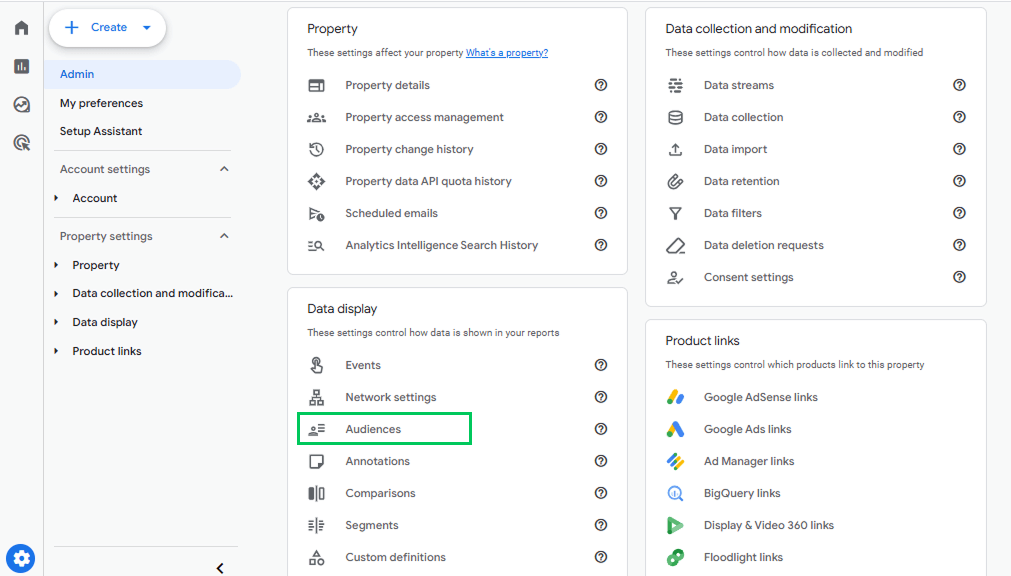
Create two versions of the dashboard: a detailed one for the marketing team and a high-level summary for leadership. Each audience then gets the insights it needs without feeling overwhelmed.
9. Automate Data Collection (Reduce Manual Work)
Manual reporting can be time-consuming and prone to errors. Automating data collection ensures your Marketing KPI dashboard always reflects accurate, up-to-date insights without extra effort.
By integrating your CRM, ad platforms, and analytics tools directly into the dashboard, you reduce repetitive tasks and free up more time for strategy.
Automation also strengthens consistency in marketing KPI reporting, since updates happen automatically at set intervals. This marketing dashboard tip saves hours of work while improving accuracy.
10. Use Drill-Down Options (Overview + Details)
Static dashboards provide only basic information. A key dashboard best practice is to enable filters and drill-downs, letting users explore performance by date, channel, or campaign. This interactivity helps to find insights that really matter.
For example, a spike in traffic might look good, but drilling down could reveal it came from a low-converting channel.
This dashboard best practice keeps the main view clean while still offering flexibility for detailed investigation, helping your reporting deliver stronger clarity and value.
11. Highlight Conversion Funnels
Conversion funnels are one of the most essential elements of a Marketing KPI dashboard. They visually show where users drop off in the journey from first click to purchase or sign-up.
Highlighting these funnels helps marketers identify weak points and optimize them for higher conversion rates. Adding funnels to your marketing KPI reporting is a dashboard best practice because it connects traffic and engagement metrics directly to revenue impact. This gives you a complete picture of overall performance.
12. Review and Update Dashboard Regularly
Review and update your KPI dashboard regularly. Strategies evolve, new campaigns launch, and business priorities change, so a static dashboard loses value.
Remove outdated metrics, add new KPIs, and refine visuals to keep reporting relevant.
Regular updates keep your marketing KPI dashboard aligned with business goals.
13. Ensure Data Accuracy and Reliability
A dashboard is only useful if the data is accurate. If your data sources are unreliable, even the best-looking dashboard can give you the wrong results and lead to poor decisions.
Make sure your tracking setup, integrations, and attribution models are properly configured. Regularly audit your analytics tools to confirm that KPIs are being captured correctly. Reliable data builds trust in your dashboard and ensures every decision is based on facts.
How Businesses Use Marketing KPI Dashboards
E-commerce brands, local businesses, and B2B SaaS companies each track different KPIs on a marketing dashboard:
E-commerce Brand
An e-commerce marketing dashboard should track total revenue, return on ad spend (ROAS), and cart abandonment rate.
By tracking these KPIs, you can see how your ads turn into actual purchases. You’ll also spot where shoppers are dropping off and identify which campaigns bring in the most profit.
For example, a clothing brand might notice a high cart abandonment rate on mobile devices. With that insight, they could simplify the checkout process and recover more sales.
Local Business
For local service-based companies, every marketing effort counts. That’s why your KPI dashboard should focus on what matters most: leads, phone calls, and cost per acquisition.
These metrics reveal how effectively your campaigns are driving real customer actions, rather than just clicks or impressions.
For instance, a home cleaning service might find that Facebook ads generate a high volume of leads, but Google Search delivers higher-quality calls. Insights like these help you spend your budget where it actually works, instead of guessing.
B2B SaaS
For software companies, dashboards center around free trials, marketing-qualified leads (MQLs), and churn rate. This type of marketing KPI reporting tracks both acquisition and retention.
It makes it easier to see if campaigns are attracting quality leads and whether customers are sticking around long enough to drive recurring revenue.
For example, a project management SaaS might see that LinkedIn ads drive lots of free trials, but email campaigns are what turn those trials into long-term customers.
In each case, dashboard best practices like customization, real-time updates, and clear visuals make the data easier to interpret so that teams can refine campaigns faster and with more confidence.
Marketing Dashboard Best Practices
Five practices keep a marketing dashboard accurate and actionable:
1. Keep It Visual
Use charts, graphs, and visual indicators instead of dense spreadsheets. A visual-first approach helps teams spot patterns, trends, and anomalies at a glance.
2. Prioritize Clarity
The best dashboards avoid clutter. Instead of tracking dozens of metrics, focus on 5–7 core KPIs tied to your business goals. This ensures your KPI dashboard for marketers highlights what truly matters, whether that’s conversions, ROI, or customer acquisition.
3. Consistency
Consistency is essential for long-term insight. Use the same metrics, formats, and update cycles so data comparisons remain meaningful over time. Regular reviews also help refine KPIs as strategies evolve, ensuring your dashboard stays aligned with company objectives.
4. Segment by Channel
Breaking data down by PPC, SEO, social media, or email gives marketers a clear view of which channels drive results. This segmentation is one of the most practical marketing dashboard tips for improving resource allocation.
5. Automate Where Possible
Automating data collection from analytics platforms saves time and reduces errors. This ensures marketers always have up-to-date numbers without manual effort.
Built-In Marketing KPI Dashboards with Analytify
Join 50,000+ beginners & professionals who use Analytify to simplify their Google Analytics!
Analytify adds a marketing KPI dashboard inside WordPress. GA4 dashboards can be complex to customize. That’s where Analytify makes the difference.
Analytify, a WordPress plugin that connects Google Analytics to your WordPress dashboard, provides a clear marketing KPI dashboard.
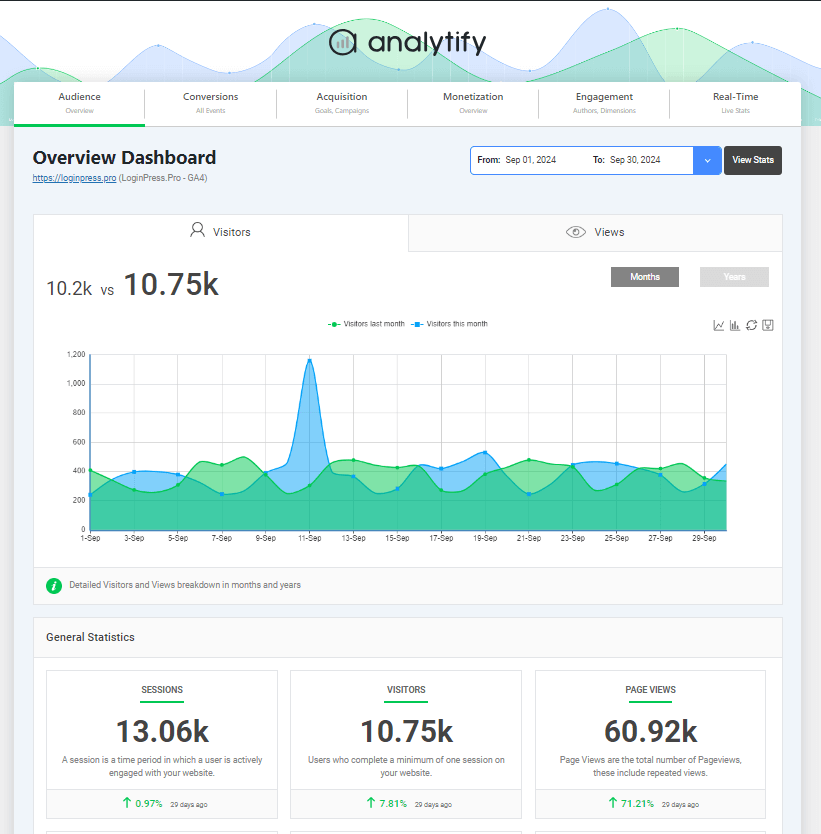
With Analytify, you can see essential KPIs like traffic, conversions, and campaign performance in one place without jumping between tools. Here’s how Analytify helps streamline marketing KPI reporting:
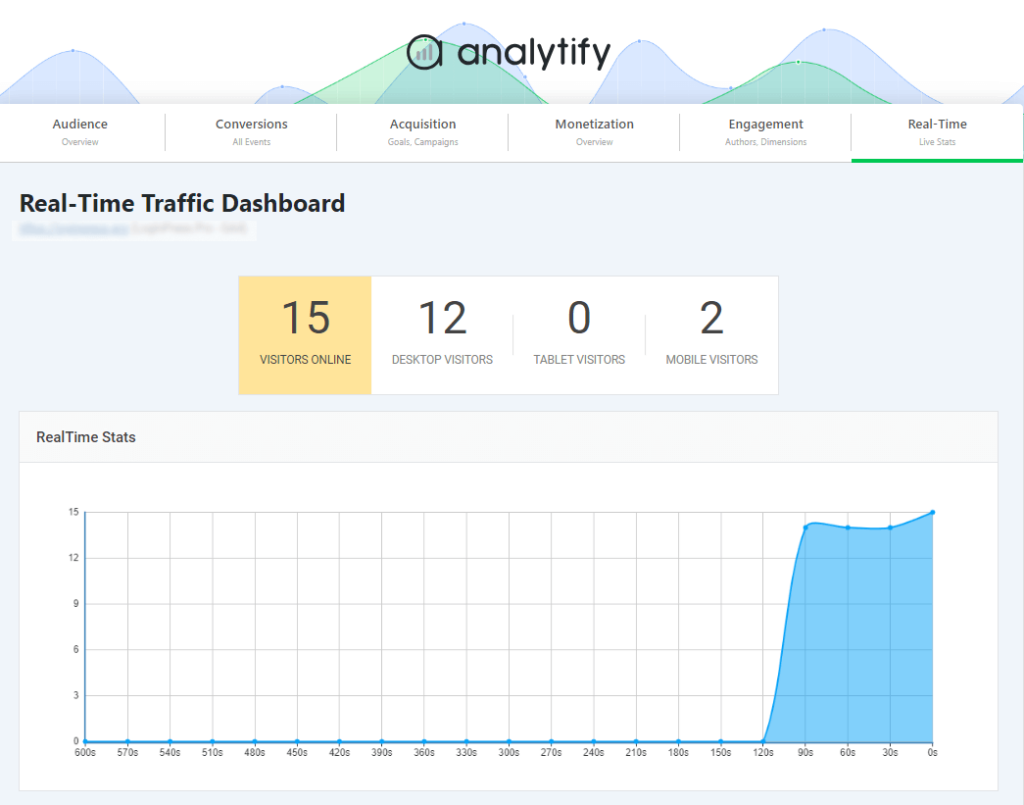
Real-Time Dashboard
Track how visitors interact with websites instantly, without leaving WordPress. This makes it easy to monitor campaigns, landing pages, or design updates and immediately measure their impact on user journeys.
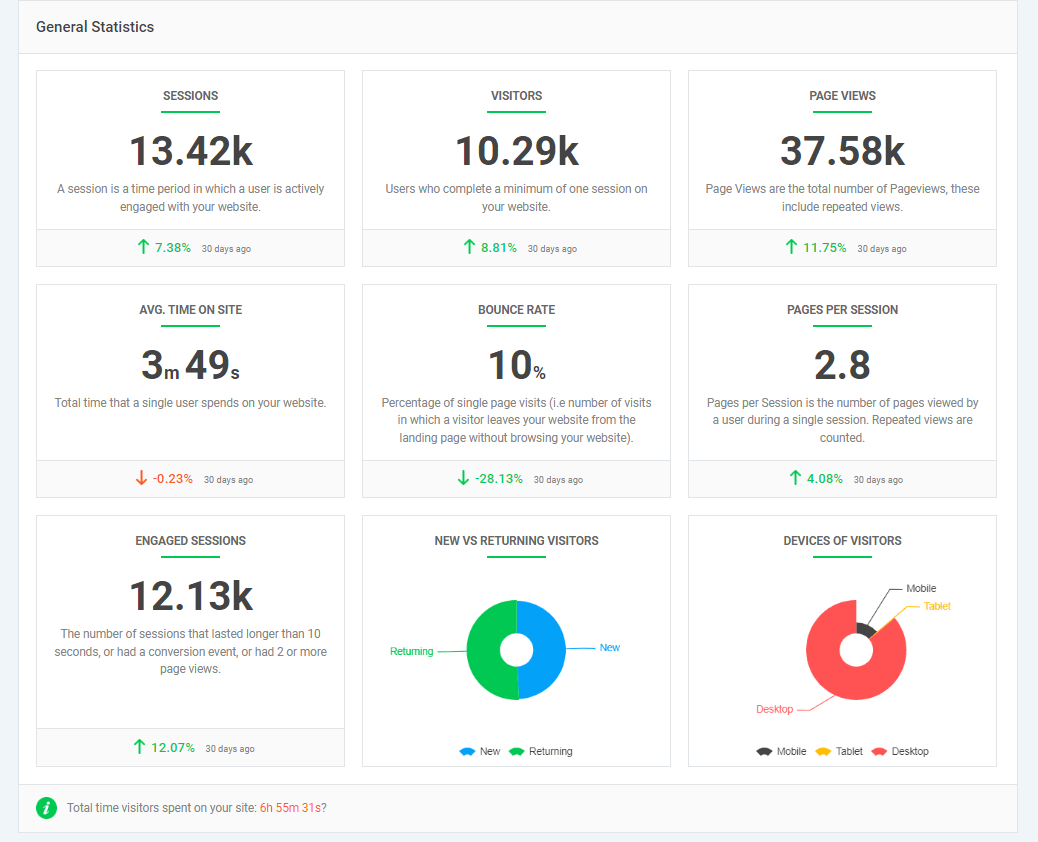
General Statistics
Quickly view sessions, users, bounce rate, and time on site in one place. These KPIs provide a snapshot of performance that you can share with clients.
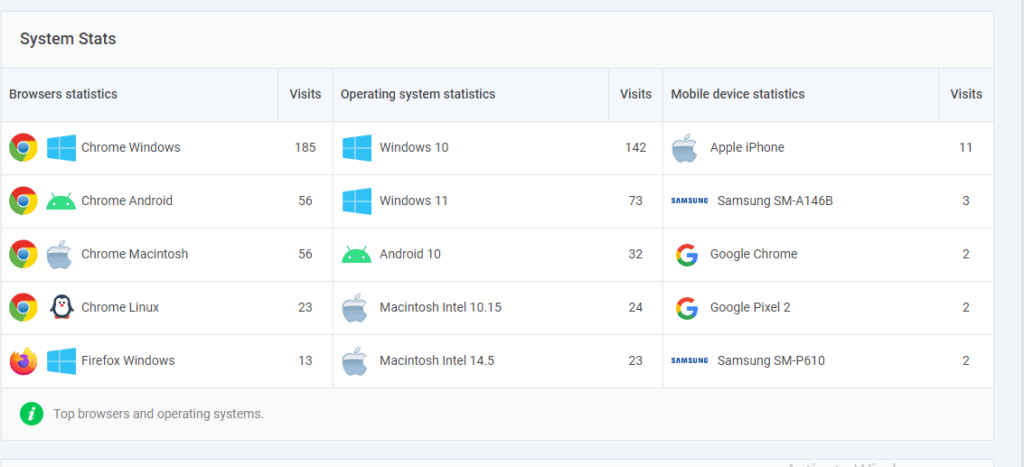
System Stats
See which devices, browsers, and operating systems visitors use. This helps identify technical issues that may affect engagement and ensures clients’ websites deliver a smooth user experience.
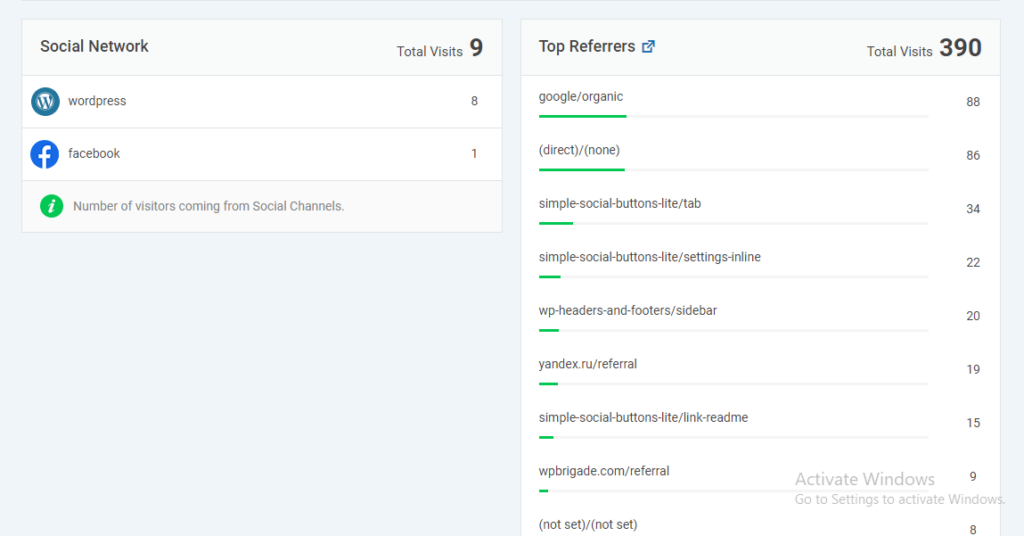
Traffic Sources & Referral Report
Highlight where traffic is coming from: organic, social, referral, or paid campaigns. Analytify makes it simple to showcase the top-performing channels that bring in qualified leads.
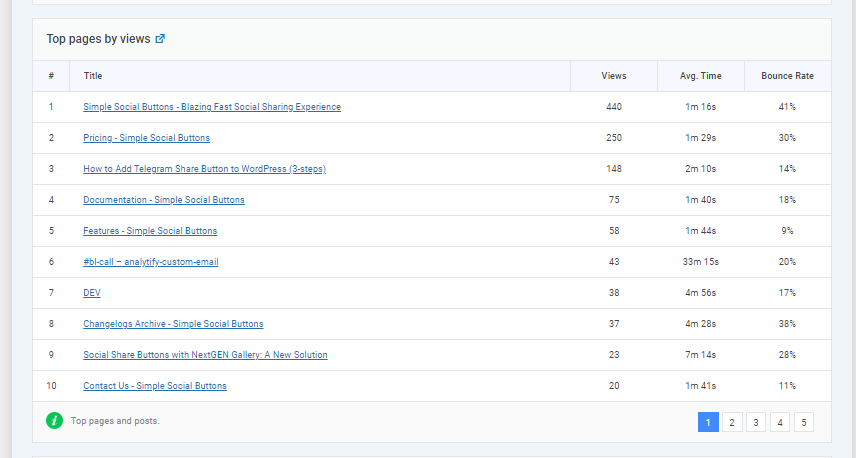
Top Pages by Views Report
Discover which landing pages or blog posts drive the most engagement. Use this data to refine content strategies and demonstrate where clients are gaining traction.
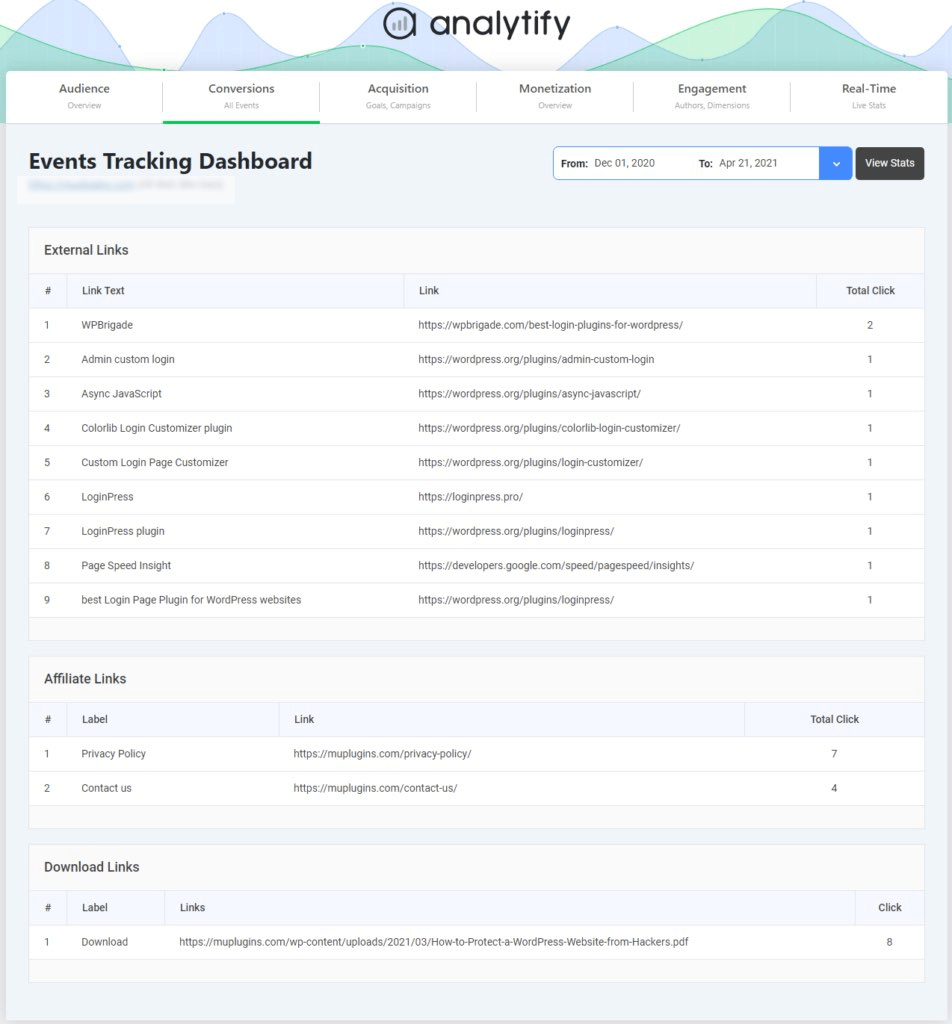
Event Tracking
Measure key actions like form submissions, downloads, or button clicks directly in WordPress.
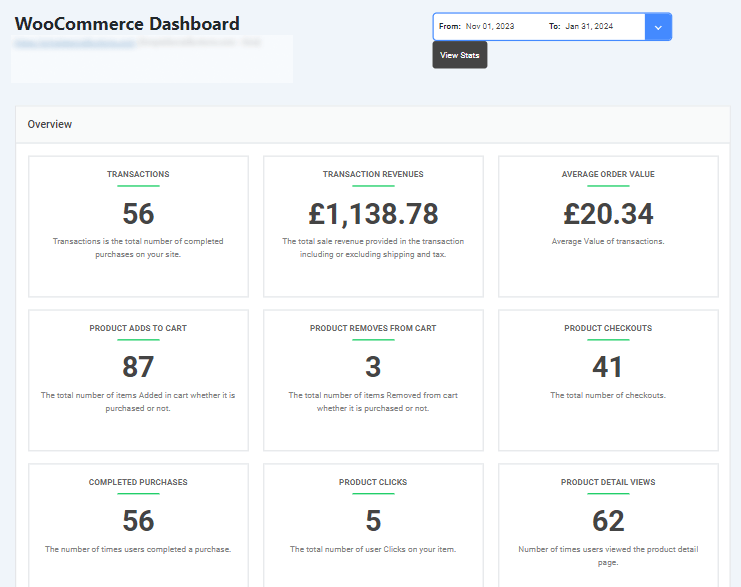
For eCommerce sites, track sales, revenue, and product performance in easy-to-read reports. Agencies can present store KPIs without navigating GA4’s complex setup.
Monitor the effectiveness of email, social, and ad campaigns. Analytify’s campaign tracking makes it clear which efforts generate conversions and justify ad spend.
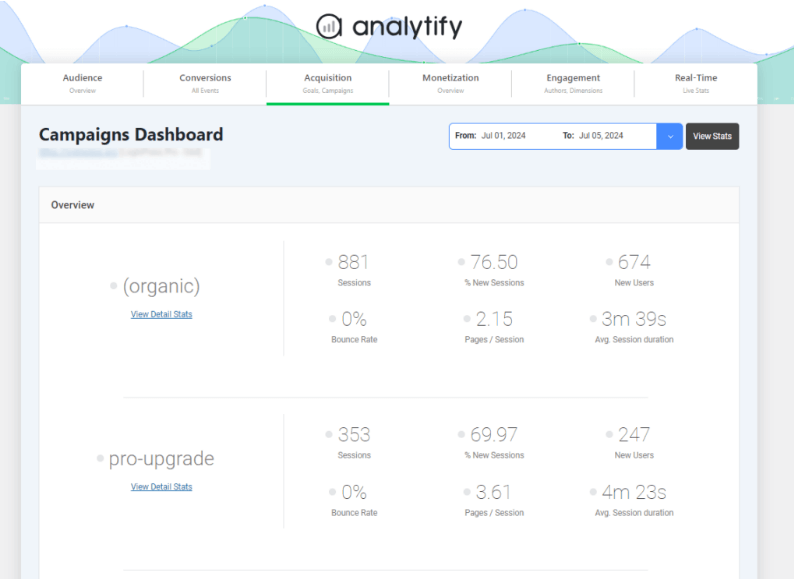
Together, these Analytify reports show your GA4 data as a KPI dashboard inside WordPress that you can share with clients.
Frequently Asked Questions
1. What should be included in a marketing KPI dashboard?
A marketing KPI dashboard should include core metrics like traffic, conversions, ROI, cost per acquisition, and engagement by channel. The goal is to track the numbers that directly reflect marketing performance.
2. What is the best way to create a KPI dashboard for marketers?
The best way is to define goals, select relevant KPIs, and use tools that integrate data automatically. Keep the design visual, simple, and tailored to the intended audience.
3. How do you choose KPIs for a marketing dashboard?
Choose KPIs that align with your business objectives, such as lead generation, sales, or retention. Avoid vanity metrics and focus on actionable data that drives strategy.
4. What are the three essential elements of a marketing dashboard?
The essentials are clear goals, relevant KPIs, and a visual layout. These ensure the dashboard delivers meaningful insights instead of overwhelming users with data.
5. What is the best way to display KPI?
KPIs are best displayed using charts, graphs, and visual indicators. This makes performance trends easy to interpret at a glance.
6. How many KPIs should be on a dashboard?
Aim for 5–7 core KPIs. Too many metrics create clutter, while a focused dashboard ensures clarity and better decision-making.
Final Thoughts
A marketing KPI dashboard works when it ties 5 to 7 KPIs to clear goals, segments data by channel, automates data collection, and is reviewed regularly. Analytify shows traffic, conversions, and campaign performance KPIs inside WordPress.
For further guidance, you can read :
What KPIs do you find most valuable to track on your own dashboard? Share your thoughts in the comments below. We would love to hear from you!