

Google Analytics for Beginners (Updated Guide)

Google Analytics is a free tool from Google. It shows who visits your website, where they come from, and what they do. To start, create a Google Analytics 4 account and install the tracking code. Then verify that data is flowing and explore the reports.
This Google Analytics for Beginners guide covers the basics: setting up your account, understanding the Google Analytics interface, and exploring essential reports. With easy-to-follow steps and clear explanations, you’ll quickly grasp what does Google Analytics do and how to use it.
Analytify shows these GA4 reports inside your WordPress dashboard. Beginners can read them without learning the GA4 interface first.
Curious how it compares to other tools? Read our Microsoft Clarity Vs Google Analytics breakdown to see the differences.
Once you’re tracking data, check How Quickly Should A Website Page Load – Analytify. It shows how speed affects your results.
And if you want the bigger marketing picture, see our guide on Digital Marketing Analytics For Beginners.
Curious what it costs as your needs grow? See our breakdown of Google Analytics Pricing (Free Vs 360) – Analytify.
Planning a marketing campaign next? Our comparison of Microsite Vs Landing Page can help you choose the right format.
Google Analytics for Beginners (TOC):
What is Google Analytics?
Google Analytics is a powerful web analytics tool offered by Google that tracks and reports website traffic. It helps you understand how users interact with your website. It delivers information on user behavior, traffic sources, and overall performance.
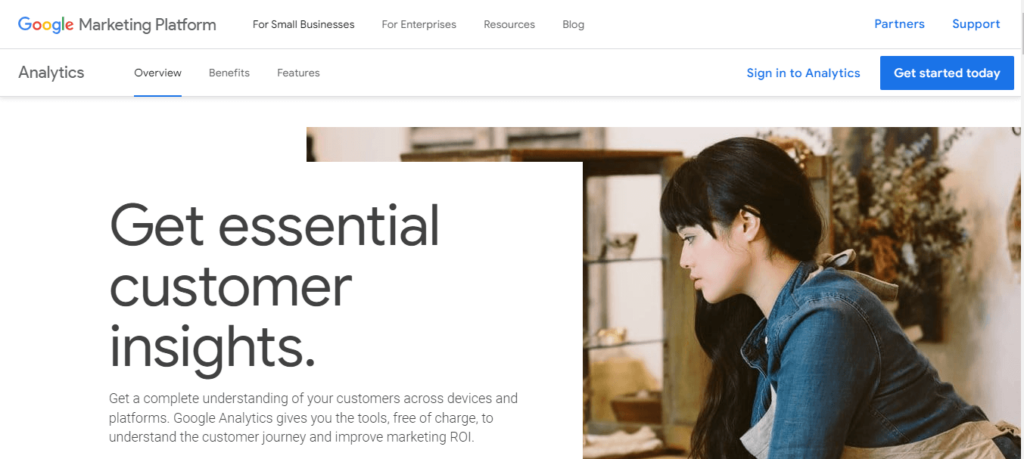
Universal Analytics (UA) is the previous version of Google Analytics. It was designed around session-based tracking, which measured user activity within set timeframes and was primarily focused on websites. However, UA’s limitations became apparent with the rise of multi-platform user journeys (web, mobile apps, etc.).
In response, Google introduced Google Analytics 4 (GA4), a significant evolution from UA. GA4 is built on an event-based model. It tracks user interactions in more detail across platforms, devices, and channels.
To make GA4 even more accessible, Analytify integrates with GA4, offering an easy-to-use interface for WordPress users. It simplifies data analysis, allowing you to view your analytics directly from your dashboard without any technical complexity.
Join 50,000+ beginners & professionals who use Analytify to simplify their Google Analytics!
Key Benefits of Using Google Analytics
Google Analytics shows how visitors find and use your website. Use it to improve your content and decide where to spend. Here are some of the key benefits of using Google Analytics:
- Comprehensive User Behavior Tracking
Google Analytics for Beginners gives a detailed view of how users interact with your website or app. It tracks key metrics like page views, bounce rates, session duration, and conversions. You can see what content resonates and where to improve. - Analyze Traffic Source
After learning the basics, you can analyze your traffic by source: organic search, social media, email campaigns, or paid ads. This will allow you to identify the most effective channels and allocate marketing resources accordingly. - Conversion Tracking
Set up goals and track conversions such as purchases, sign-ups, or downloads. This helps measure the success of marketing efforts. - Audience Segmentation
Segmentation tools group users by demographics, device, location, and behavior patterns. This feature enables you to refine your strategies to effectively target specific audience segments. - SEO and Content Optimization
Google Analytics tracks which keywords, landing pages, and content drive traffic to your site. This data helps you to analyze SEO strategy, identify high-performing content, and improve underperforming pages. - Customizable Reports and Dashboards
Understanding Google Analytics allows you to create custom reports and dashboards according to your specific needs. It enables quick access to the most important metrics. - Real-Time Data Monitoring
With real-time tracking, you can see how visitors interact with your website at any moment. This feature is useful for monitoring traffic spikes during campaigns or events and quickly addressing any issues. - Cost-Effective
Google Analytics is free for most websites, offering a wealth of data and functionality without expensive subscriptions. Google Analytics for beginners is very budget friendly. - Integration with Other Google Tools
Google Ads and Search Console integrations help you measure campaign effectiveness. They also help you optimize ad spend and track SEO performance.
For WordPress users, integrating Google Analytics is easier with plugins like Analytify. This plugin offers a simplified dashboard directly within your WordPress interface. It provides all the key features of GA4 without the complexity, making data tracking effortless.
How to Use Google Analytics 4 (Step-by-Step Guide)
Google Analytics 4 (GA4) offers powerful tools to monitor site traffic, user behavior, and other critical metrics. Set up an account and install the GA4 tracking code. You will gather meaningful information that helps optimize your site.
You can explore professional Google Analytics consulting services offered by our GA4 experts at Analytify.
The first step in using Google Analytics is creating an account. It lets you gather valuable information about how visitors interact with your website. Following Google Analytics guidelines builds a deeper understanding of Google Analytics.
Step 1: Creating a Google Analytics Account
Setting up an account is simple. It is the foundation for tracking and analyzing your website’s performance.
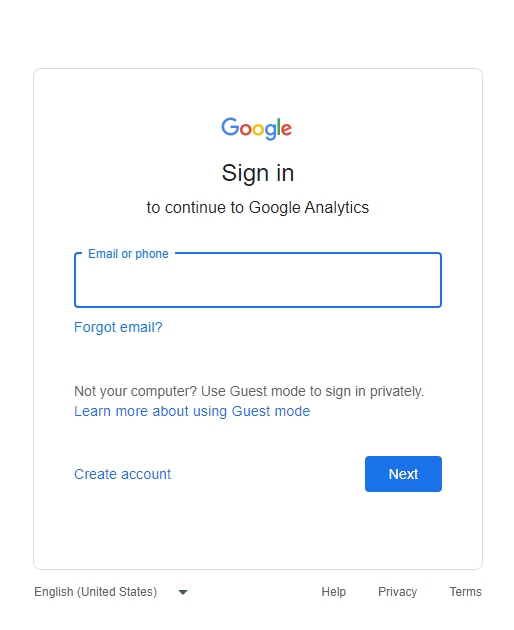
- Sign in to Google Analytics: Go to Google Analytics and sign in using your Google account. If you don’t have one, you must create a Google account first.
For a detailed guide, visit this article: How to Login to Google Analytics.
- Set Up a New Account: Once logged in, click the Start Measuring button to begin the account creation process.
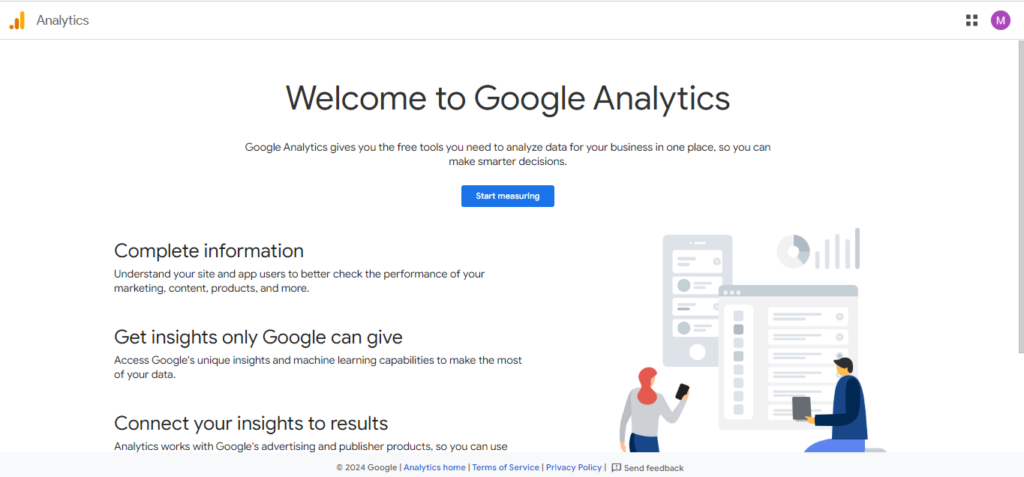
Check out our article here for a detailed guide on setting up a Google Analytics account.
Step 2: Install GA4 Tracking Code
After setting up your account, install the GA4 tracking code on your website to collect data. There are two ways to do this: using a plugin called Analytify or manually adding code to your website.
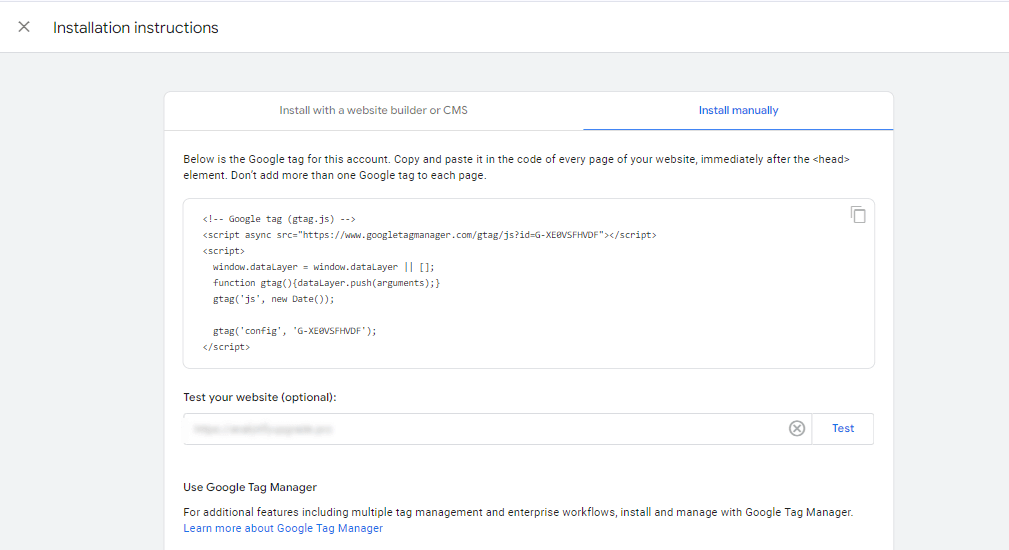
Follow our guide to complete the setup, add the tracking code, and start tracking: How to add Google Analytics to a WordPress site.
Step 3: Verify and Confirm
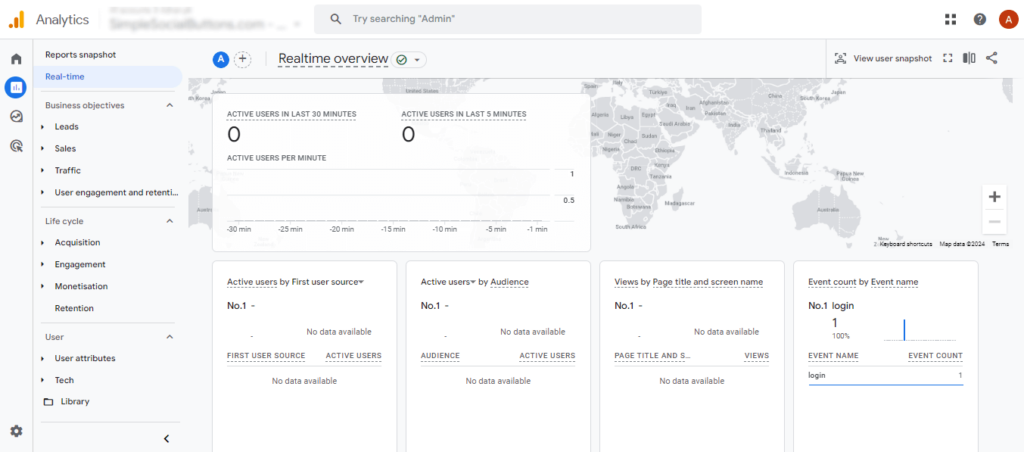
Once the tracking code is installed, go back to Google Analytics. Check the Real-Time report to confirm data is being collected. This confirms that your setup is working correctly.
Step 4: Explore and Configure
Explore the various features and settings in Google Analytics to tailor the platform to your needs. Set up conversions, customize reports, and integrate with other tools like Google Ads for enhanced tracking.
Note: The next section covers the Google Analytics interface in detail, so you can navigate its features.
Set up Key Events/Conversions
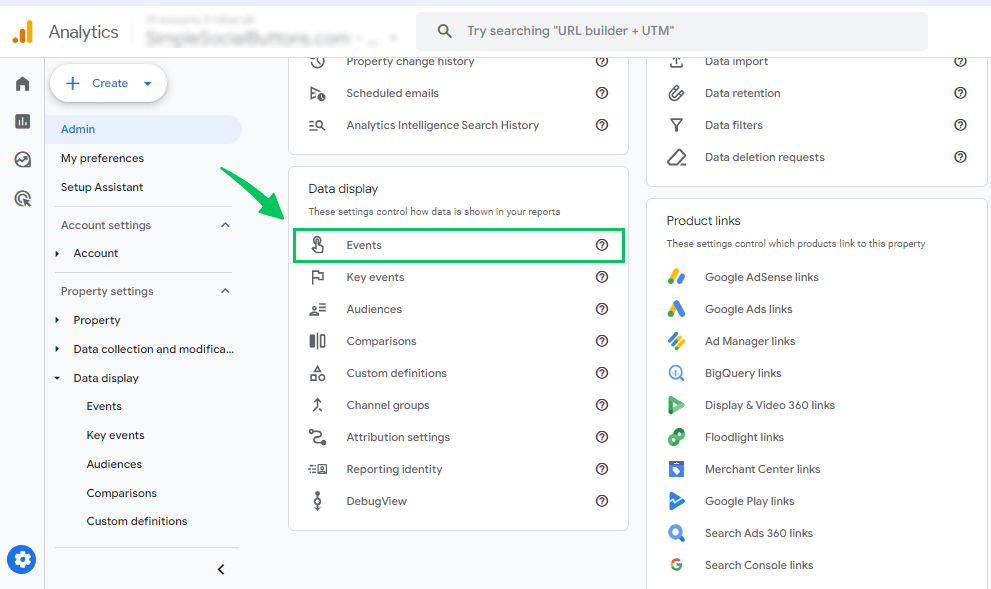
You can now designate any event you want to track as a conversion in Google Analytics. This means that when someone completes a selected action, like downloading a file or submitting a form, GA4 records a conversion. In Google Analytics 4, these conversions are called “key events.”
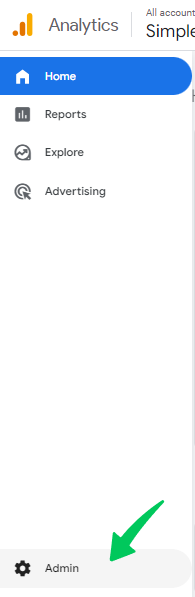
To set this up, go to the “Admin” section and click “Events.” Then toggle the switch to mark an event as a key event. GA4 counts it as a conversion.
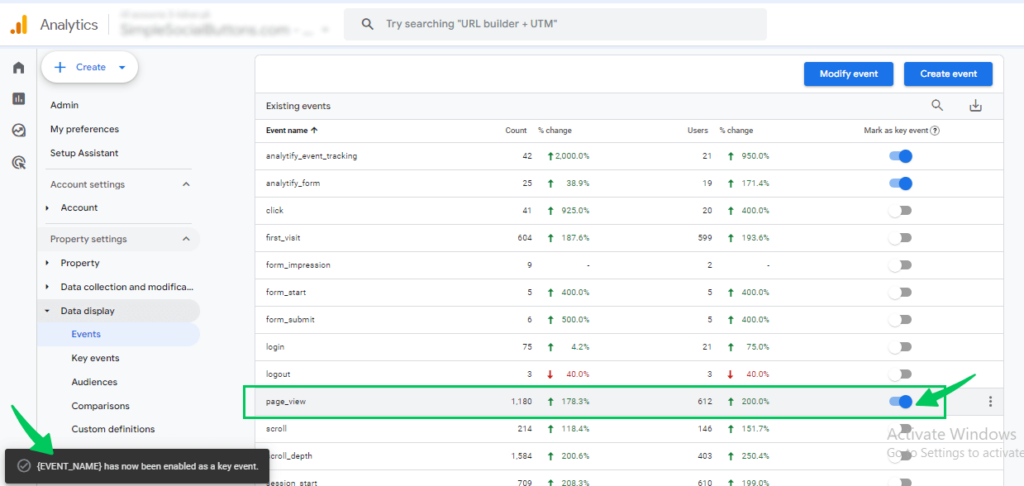
Follow these steps to get a Google Analytics account up and running. It then reports on your website’s performance.
A Beginner’s Guide to the GA4 Interface
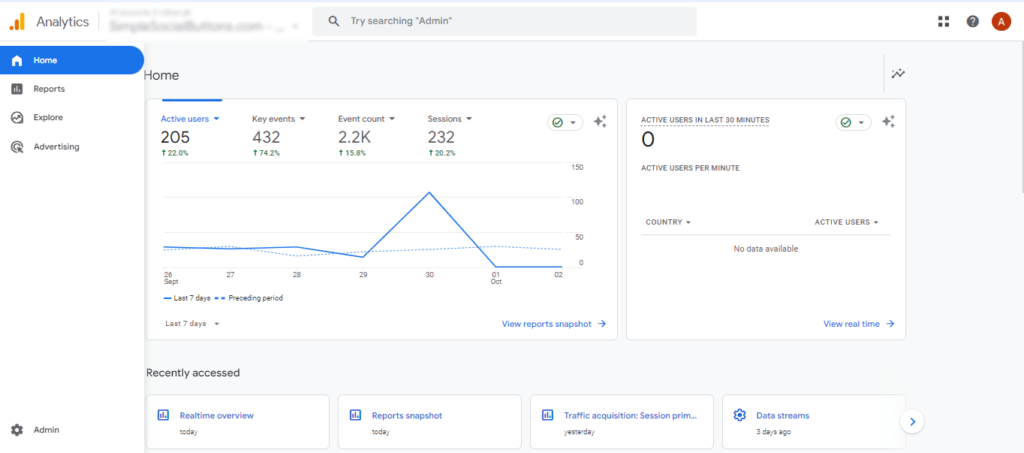
Google Analytics 4 (GA4) is a significant update to Google’s web analytics platform. It gives a more comprehensive, accurate view of user behavior. The GA4 interface is structured to allow users access essential data and reports. Here are the key components:
Key Components of the GA4 Interface:
There are the following two key components of the GA4 interface:
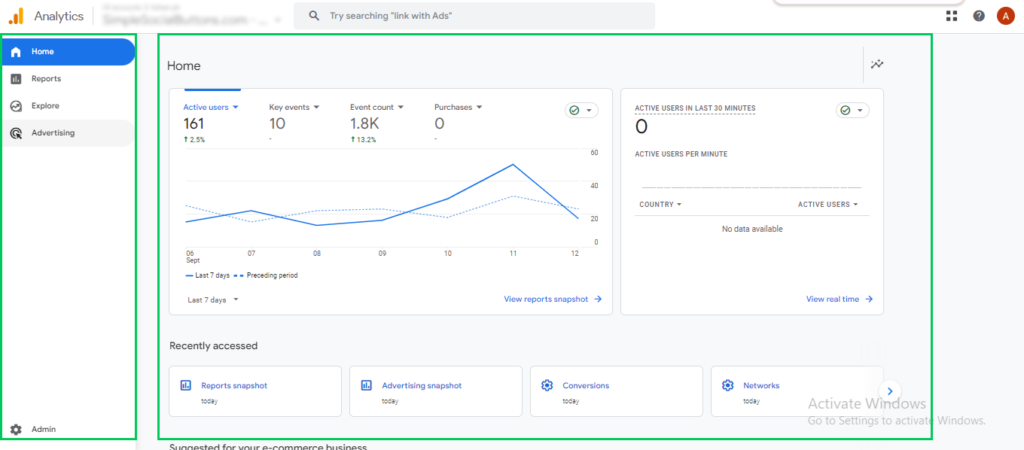
1) Navigation Menu:
It is located on the left side of the screen. This menu provides access to the main sections of GA4, including:
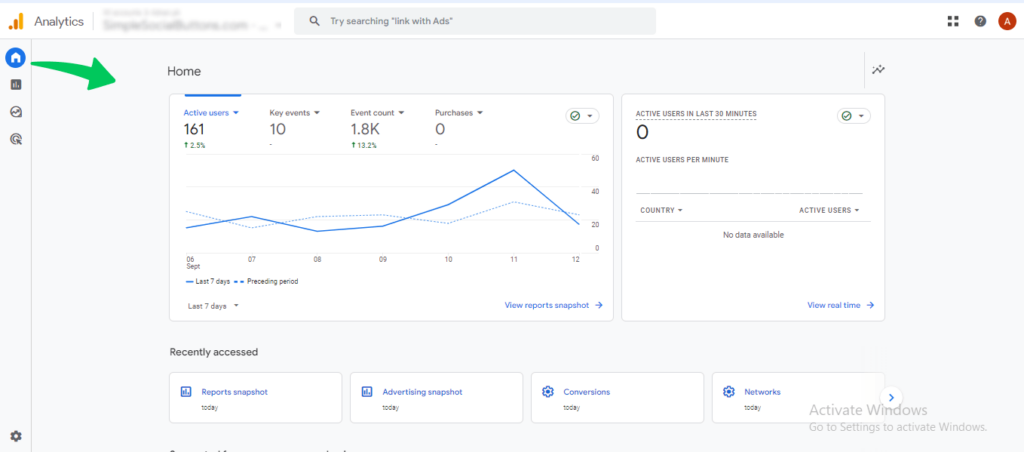
- Home: This section summarizes your website’s performance.
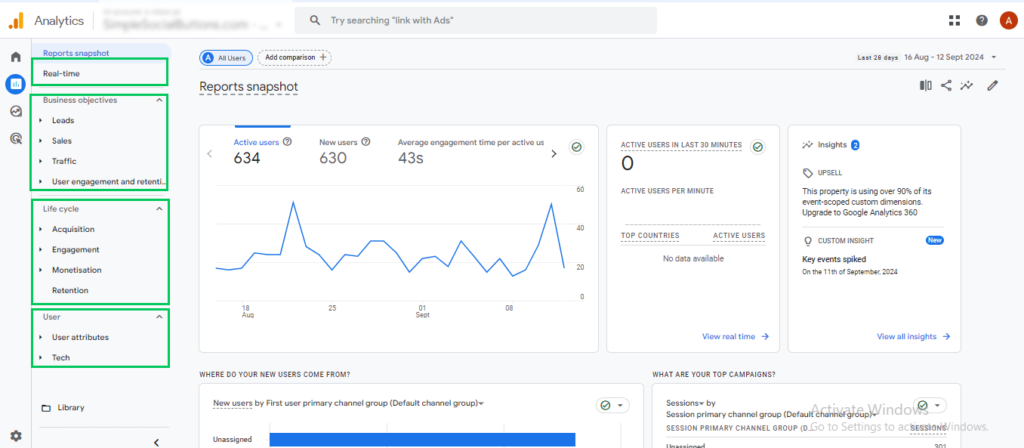
- Reports: This section offers pre-built reports and the ability to create custom reports. It includes subcategories like:
- Real-time
- Business Objectives (Leads, Sales, Traffic)
- Lifecycle (Acquisition, Monetization, Engagement, Retention)
- Users (User Attributes, Tech)
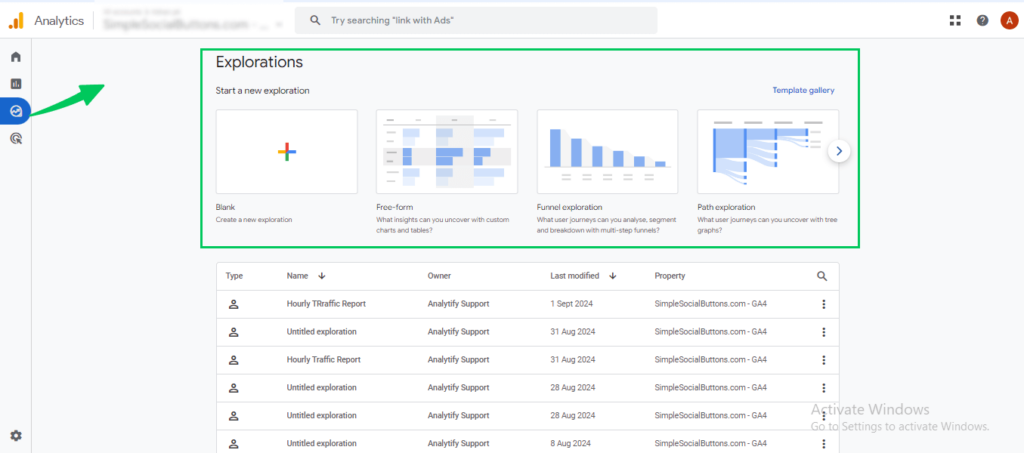
- Explore: The Explore section allows you to create custom reports for deeper analysis. It offers features like funnel exploration, path analysis, and segment comparisons. You can analyze data in ways that suit your needs.
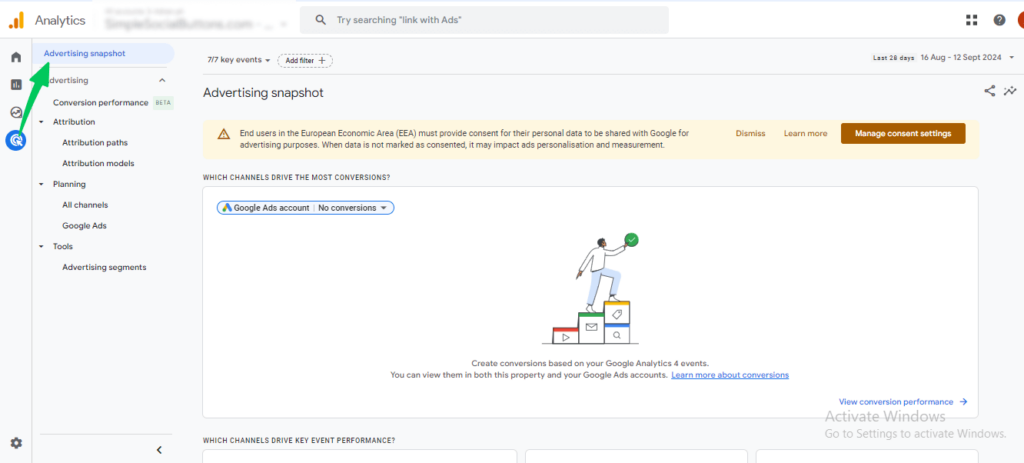
- Advertising: This section helps you assess campaign success. It tracks user acquisition through ads and measures ROI across marketing channels.
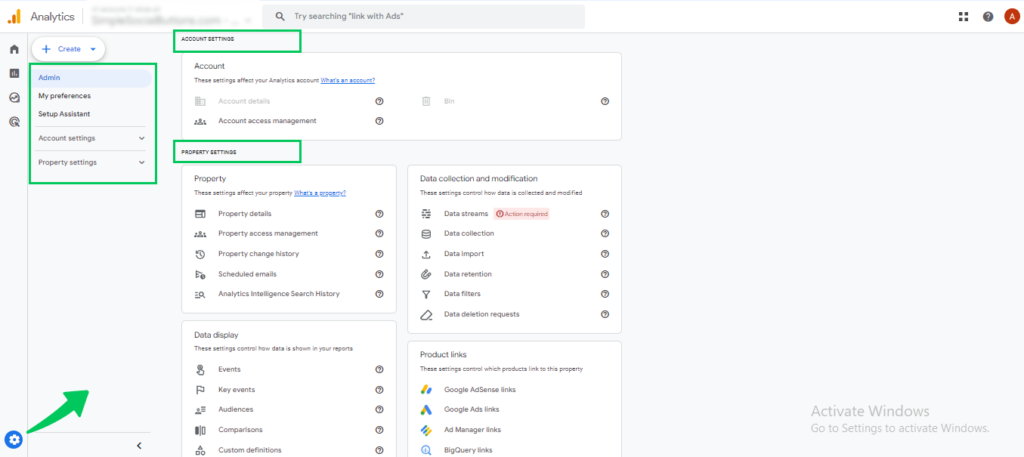
- Admin: The Admin panel manages account settings, property configurations, and integrations with Google products, such as Google Search Console. It also controls data settings and user permissions.
2) Dashboard:
The central area of the interface displays a dashboard with key metrics and visualizations.
Important Reports of GA4
The important GA4 reports are Real-Time, Acquisition, Engagement, Monetization, and Search Console. GA4, as a reporting tool, offers several reports that are crucial for understanding user behavior and performance, such as:
Real-Time Report:
The Real-Time Report in GA4 provides an immediate view of current user activity on your site or app. It allows you to monitor live interactions, including:
- Active Users: See how many users are on your site or app at this moment.
- Current Events: Track the specific actions users are taking in real-time, such as page views, button clicks, or transactions.
- Traffic Sources: Identify where current users come from, whether through direct visits, search engines, or referral links.
- Geographic Locations: View the geographical distribution of your current users.
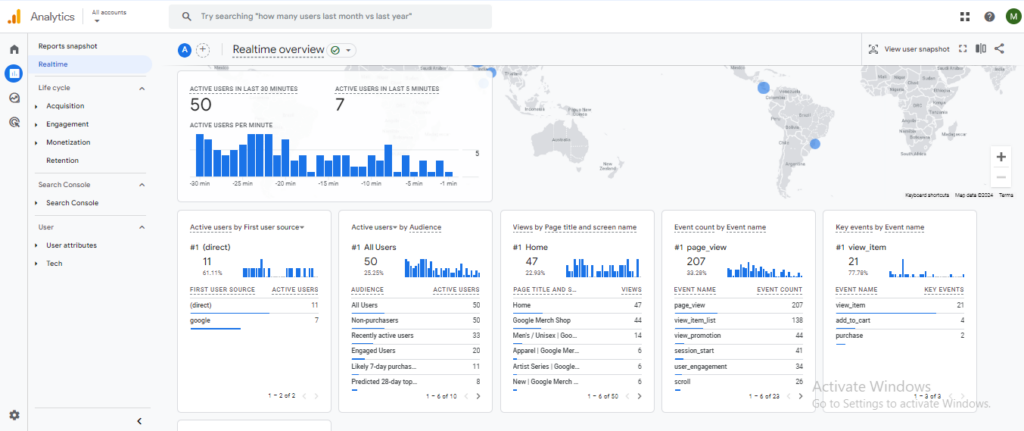
This report helps you gauge ongoing campaign performance. It shows sudden traffic spikes or drops and user behavior as it happens.
If the Real-Time Report is not working correctly, this guide offers solutions: How to Fix Google Analytics Real-Time Not Working?
Acquisition Report
The Acquisition Report in GA4 explains how users find and arrive at your site or app. It details various traffic sources and the effectiveness of different marketing efforts. It helps analyze the performance of other channels and campaigns in driving traffic and user engagement.
- Traffic Acquisition Report: The Traffic Acquisition Report shows the sources and channels that bring traffic (new & returning users) to your site.
- User Acquisition Report: This specifically looks at how new users discover your site and their characteristics.
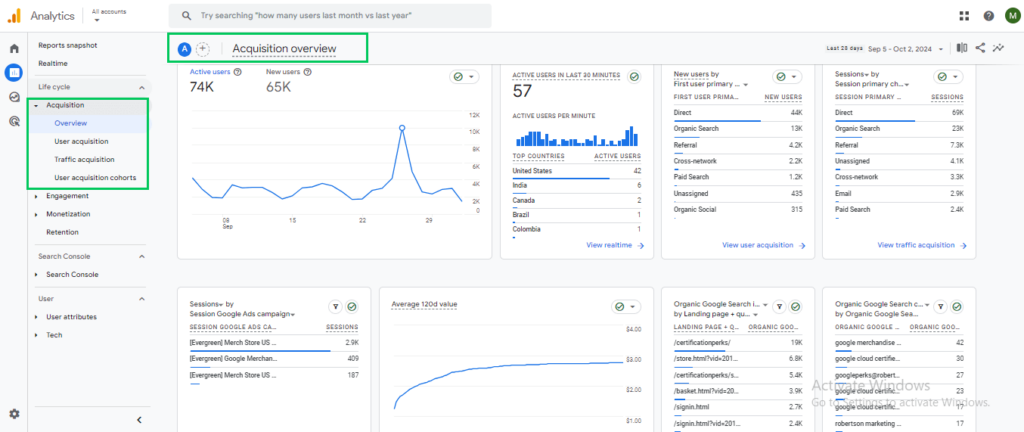
There are the following sources/medium through which traffic arrives:
- Organic Search: Traffic coming from unpaid search engine results.
- Paid Search: Traffic from paid search ads (e.g., Google Ads).
- Social: Traffic from social media platforms (e.g., Facebook, Twitter).
- Direct: Traffic from users directly entering your URL or using bookmarks.
- Referral: Traffic from other websites linking to your site.
- Email: Traffic from email marketing campaigns.
However, some traffic may appear unassigned in GA4, meaning the traffic source or medium isn’t identified. This guide provides more details on resolving this issue: How to fix unassigned traffic in GA4?
When analyzing your acquisition report, focus on key metrics. These include session, new user, returning user, total users, Average Session Duration, bounce rate, pages per session, key events, engaged session, and conversion rate.
Engagement reports:
The Engagement Report in GA4 provides knowledge about how users interact with your website or app. It tracks crucial metrics that help you understand user behavior and the quality of their interactions. This report focuses on:
- Engaged Sessions: The number of sessions where users actively engaged with your content, for example by clicking, scrolling, or spending more time on pages.
- Engagement Rate: A percentage showing how many sessions were considered engaged versus total sessions.
- Average Engagement Time: The average time users spend interacting with your content during a session.
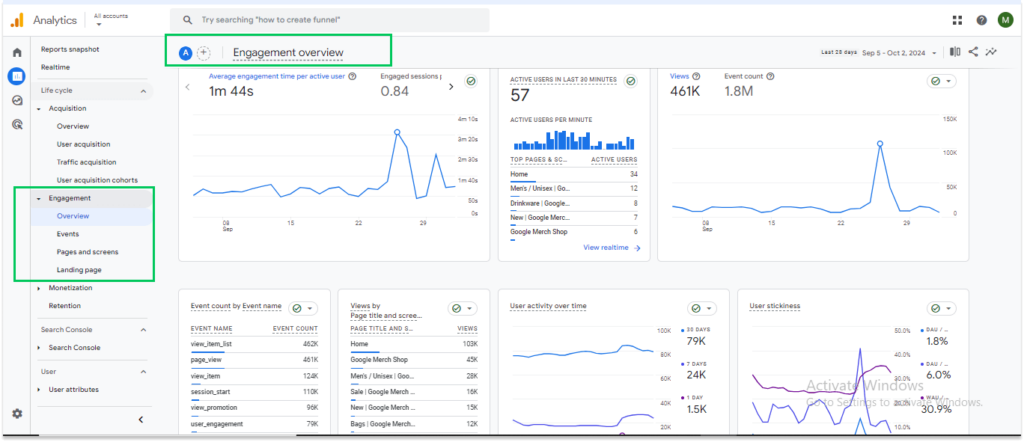
The Engagement Report is critical for understanding how effectively your content resonates with users and whether they engage meaningfully.
Pages and Screen Report
The Page and Screen Report tracks user interactions with specific pages (for websites) or screens (for apps). It provides details about:
- Top Pages/Screens: Shows the most visited pages or screens, helping you identify which content attracts the most attention.
- Page Views/Screen Views: Tracks how many times each page or screen is viewed.
- Average Engagement Time per Page/Screen: This measures the average time users spend engaging with each page or screen.
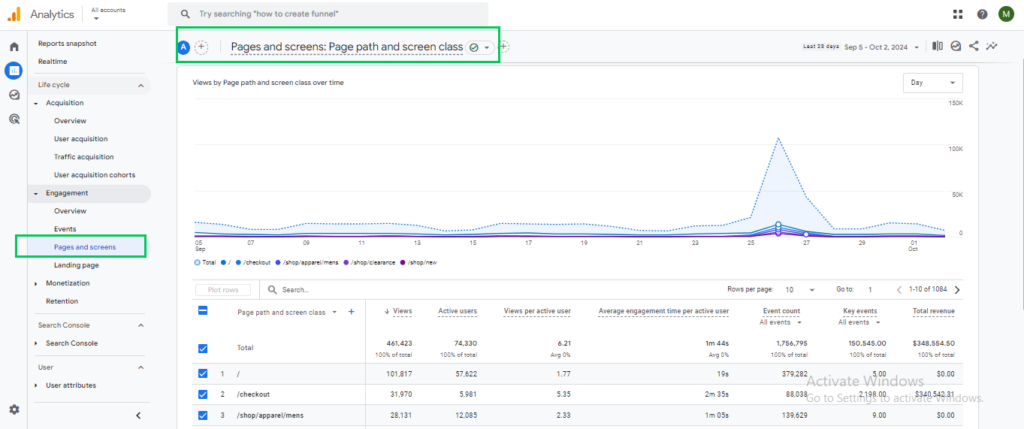
This report is useful for identifying high-performing content and optimizing user experience on both web and mobile platforms.
Landing Page Report
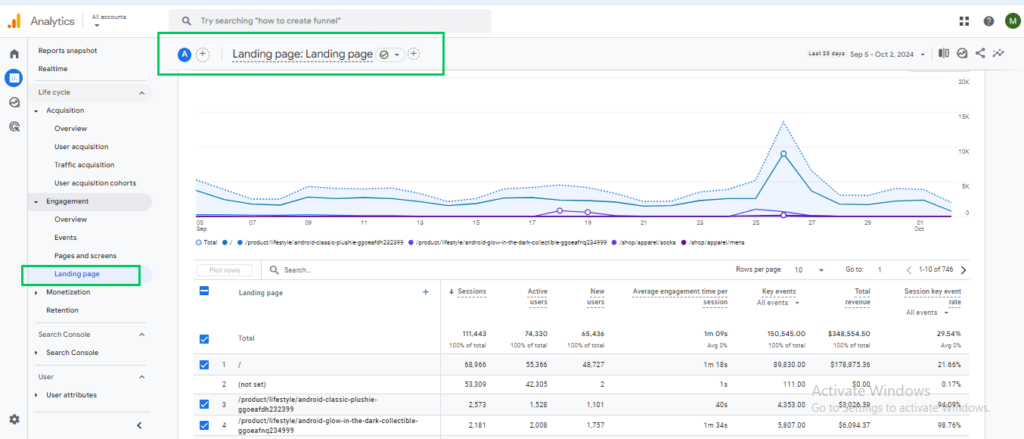
The Landing Page Report focuses on the first page a user interacts with when arriving at your site. It shows:
- Top Landing Pages: Shows the pages where users first enter your site. It tells you which pages attract the most traffic.
- Engagement Metrics: Tracks bounce rate, engagement time, and conversions for each landing page.
This report helps optimize users’ first impressions of your site and ensures that landing pages perform effectively.
Events Report
The Event Report in GA4 provides detailed information on user actions on your site or app. Events can be anything from clicking a button, submitting a form, or playing a video. It analyzes:
- Event Count: The total number of times specific events occurred.
- Top Events: Highlights your site or app’s most frequently triggered events.
- Event Parameters: Lets you analyze extra details about each event, such as the transaction’s value or the event’s category.
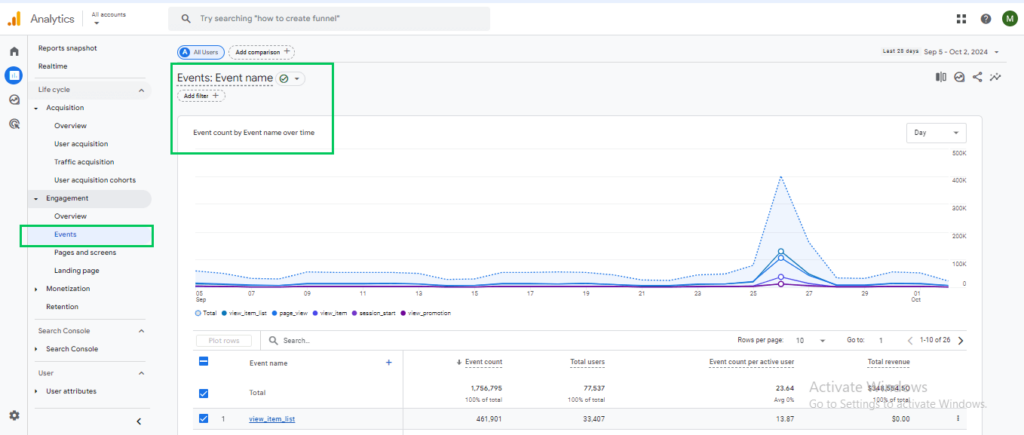
The Events Report in GA4 tracks two types of events. Custom events are based on specific user interactions. Recommended events are predefined by Google for common actions like purchases or form submissions.
Using DebugView, you can ensure that the events appearing in the Event Report are accurately set up. If you encounter any issues with DebugView, check this guide: How to Fix GA4 Debug View Not Working? (2024)
Monetization Report
The Monetization Report in GA4 provides insights into revenue-related activities on your website or app. It tracks how users contribute to your business’s income, including purchases, subscriptions, in-app purchases, and revenue.
This report helps businesses see which products or services generate the most revenue. They can then optimize strategy to increase profitability.
- Ecommerce Purchases Report: Tracks revenue generated through product purchases, including product performance and transaction details.
- In-App Purchases Report: Measures revenue from purchases made within mobile apps.
- Transaction Report: The Transaction Report in GA4 tracks total revenue, transaction count, and product performance.
- Promotion Report: The Promotion Report measures the effectiveness of promotions through impressions, clicks, and conversion rates.
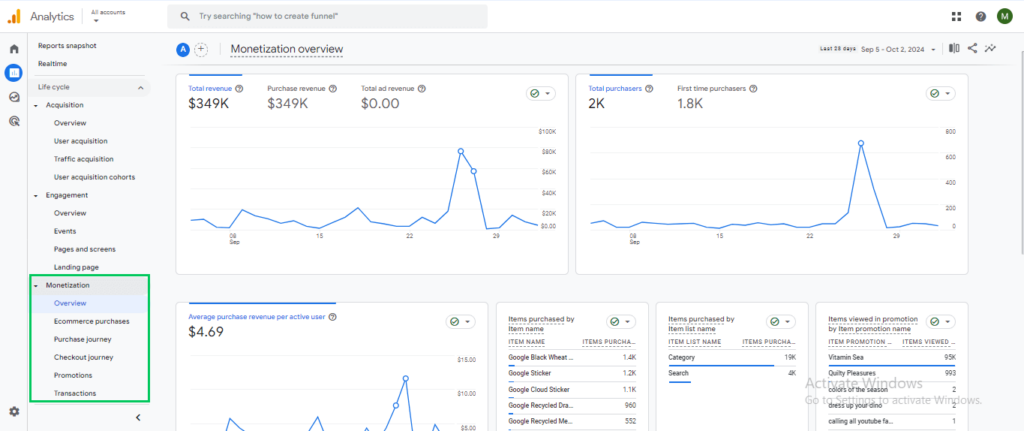
Ecommerce metrics in GA4 track key performance indicators: Revenue, Purchases, Average Purchase Value, Conversion Rate, Product Performance, Cart-to-View Rate, and Refunds.
These metrics show sales performance, customer spending, product success, and sales funnel effectiveness. Businesses use them to optimize monetization.
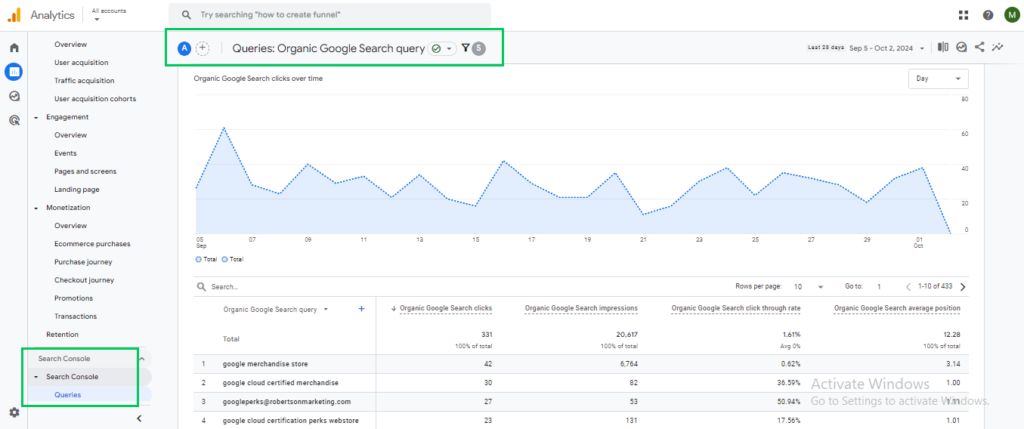
Google Search Console Report
The Google Search Console Report in Google Analytics provides knowledge about how your website performs in Google Search results. This report shows how users find your website through organic search. It also shows how your pages rank in search results.
A Google Search Console report analyzes your website’s search performance. Metrics include impressions, clicks, click-through rate (CTR), average position, search queries, and landing pages.
Most common issues of GA4 and their Solutions
The most common GA4 problems are duplicate events and DebugView not working. Others are unassigned traffic, missing custom events, and not set values. Each one has a fix guide below:
- Duplicate Events: Duplicate event tracking issues can be resolved by following this fixing GA4 duplicate events guide.
- DebugView Not Working: Trouble with real-time event monitoring? See how to fix if debugview is not working.
- Unassigned Traffic: When traffic sources are labeled as “unassigned,” refer to this guide to fix unassigned traffic in GA4.
- Custom Events Not Showing Up: Try this guide if custom events are not appearing in your reports.
- Google Analytics Not Working: For general GA4 issues, follow the How to fix if Google Analytics not working guide.
- Not Set Values: Resolve issues with “not set” values in your reports by following this guide.
- Real-Time Data Issues: Refer to this guide if your real-time reports are not working correctly.
These guides provide detailed solutions to common GA4 issues, ensuring your analytics run smoothly.
Analytify Makes Google Analytics Easier
Analytify simplifies Google Analytics 4 (GA4) by providing an accessible and intuitive interface, especially for WordPress users. Analytify organizes key reports like Real-Time, Acquisition, Engagement, and Ecommerce into easy dashboards in your WordPress. You skip GA4’s complex setup. You no longer need to navigate GA4’s separate platform to access essential metrics.
Join 50,000+ beginners & professionals who use Analytify to simplify their Google Analytics!
Install Analytify Plugin for GA4
For the WordPress crowd, Analytify streamlines the entire process. No coding is required; just a few clicks and Google Analytics is running. Analytify is a popular WordPress plugin that simplifies the installation process for GA4.
Here’s how to do it:
- Navigate to WordPress Dashboard >> Plugins >> Add New.
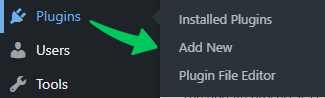
- Search Analytify and install the plugin.
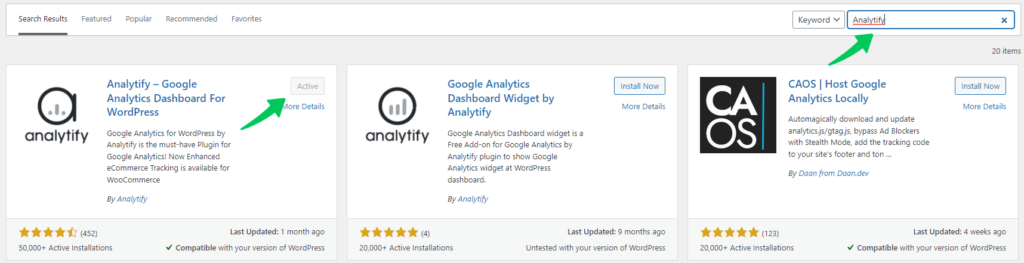
- Once the plugin is installed, go to Plugins >> Analytify and click on the Settings tab.
- Follow the instructions on the Settings tab to connect Analytify to your GA4 property.
For more details, read How to Integrate Google Analytics 4 with Analytify.
Reports Covered by Analytify:
Here’s how Analytify simplifies GA4:
Overview Report:
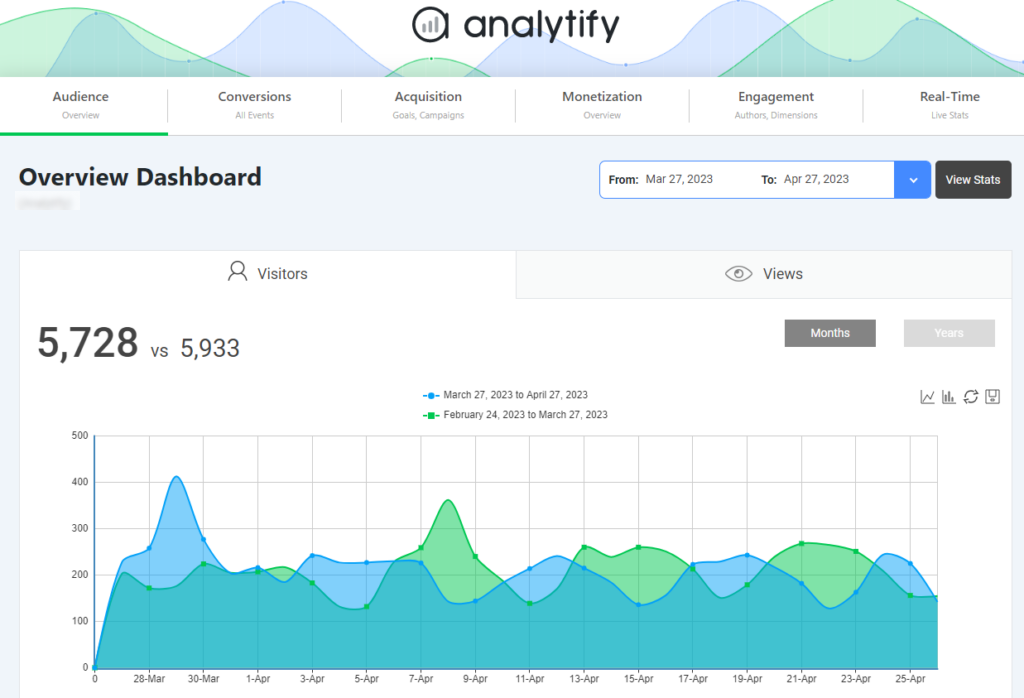
The Overview Dashboard in Analytify provides a comprehensive snapshot of your site’s performance. It presents
- User Details: This section displays detailed visitors and views for months and years.
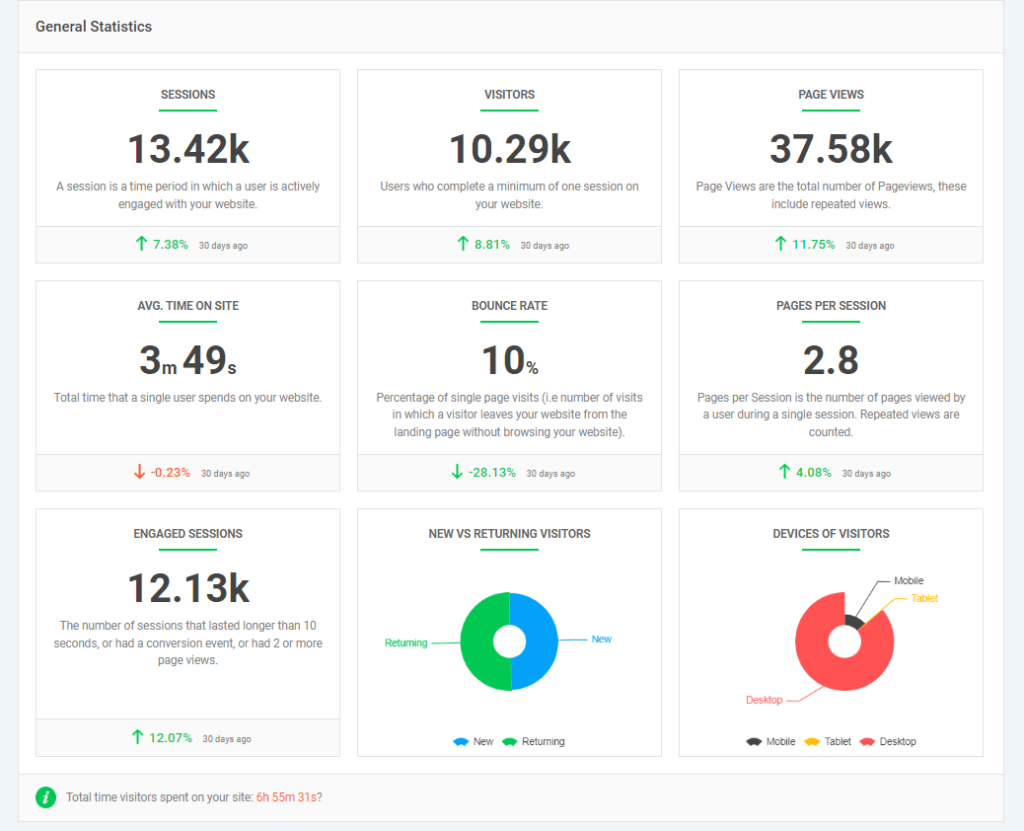
- General Statistics: This section displays key metrics, including bounce rate, engaged sessions, total sessions, pages per session, visitors, and new vs. returning users. It gives a clear view of user activity on your site. It also shows traffic across mobile, tablet, and desktop devices. Use it to optimize your site for the most popular platforms.
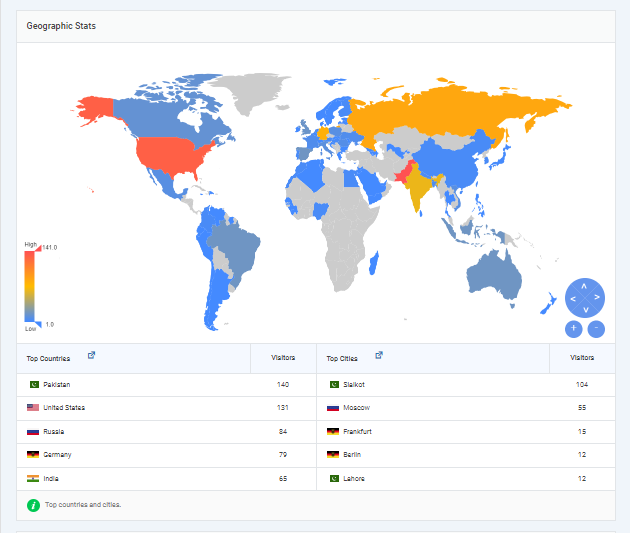
- Geographic Details: This provides insights into your visitors’ locations, allowing you to tailor your content to different regions.
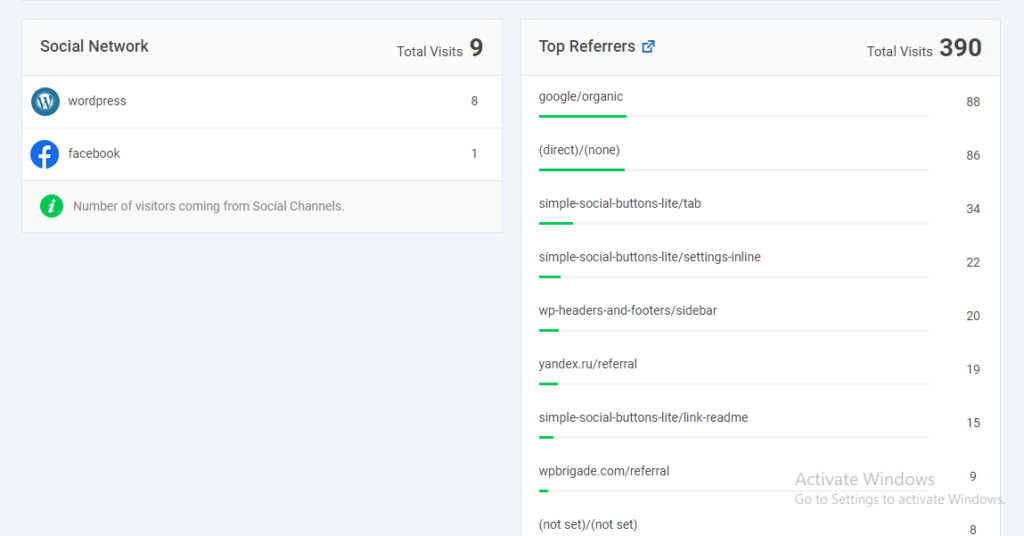
- Referral Reports: These reports track where your traffic comes from, such as search engines, social media, or direct visits. They make it easier to identify your top traffic sources.
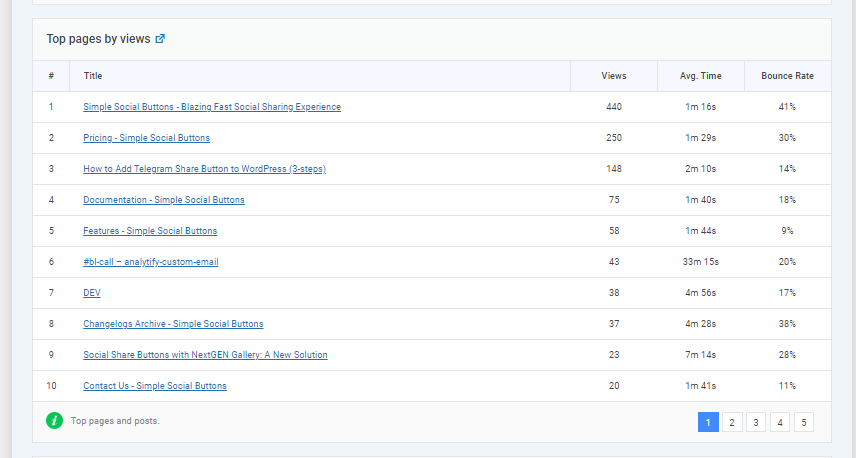
- Top Pages by Views: Lists your most popular pages by user views. It shows which content drives the most engagement.
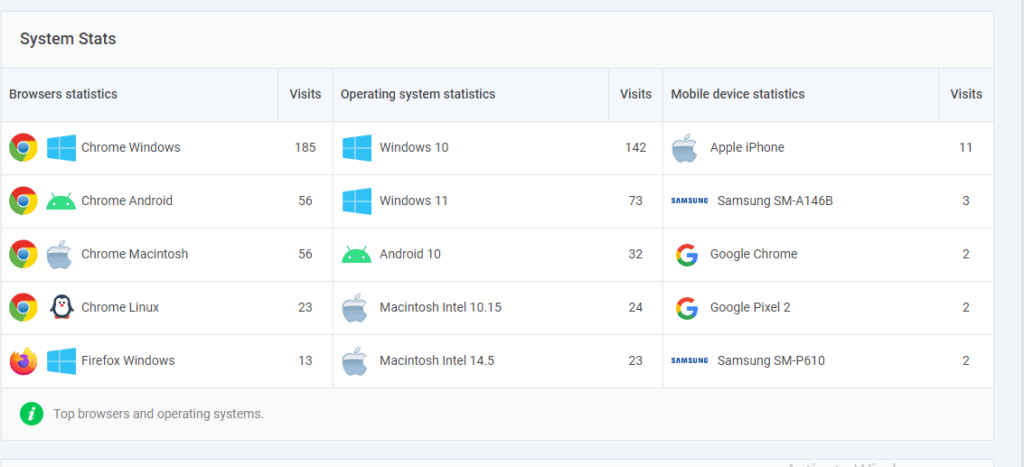
- System Stats: Shows user operating systems and browsers. Use it to ensure compatibility and performance across platforms.
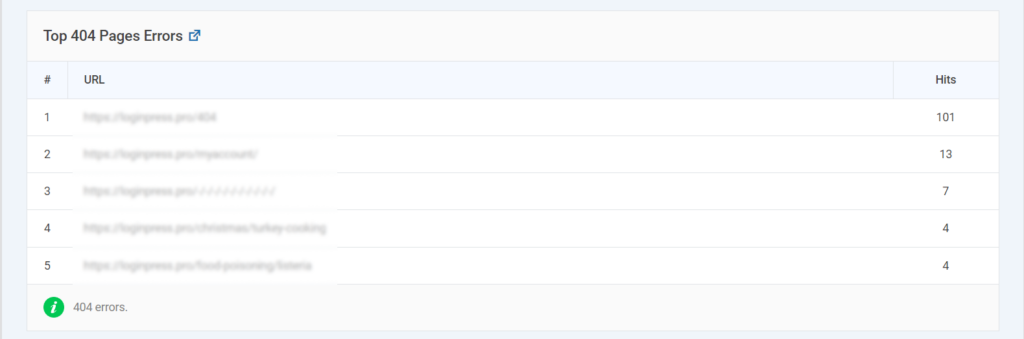
- 404 Error Report: This report identifies pages that return a 404 error (Page Not Found). It shows the URL, referrer, and user sessions so you can fix broken links and improve user experience.
Real-Time Reports:
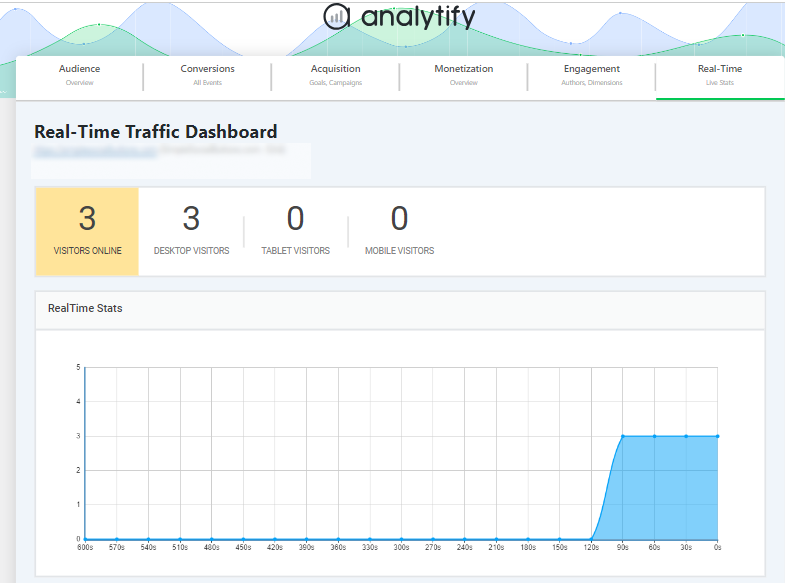
The Real-Time Report in Analytify shows the number of active visitors on your site. It breaks users down by device type, such as mobile, tablet, and desktop. This helps you monitor which platforms visitors use to access your site in real-time.
- Email Notification Addon
Stay informed with real-time updates on your website’s performance via email, using the Email notification add-on. This feature keeps you updated on critical metrics without constantly logging in, enhancing the auditing process.
Acquisition Reports:
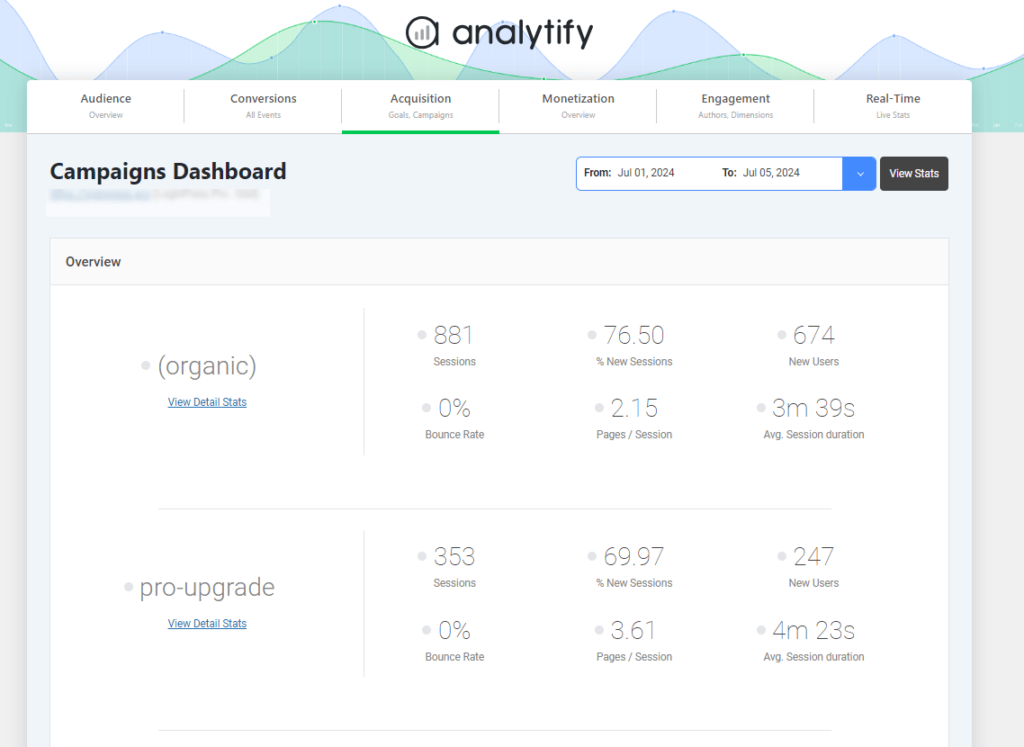
Tracks how users find your site, detailing traffic sources, campaigns, and mediums in a simplified format.
- Campaign Tracking with Analytify UTM Tracking Addon: Track the performance of your marketing campaigns by adding UTM parameters to URLs. The UTM Tracking Addon in Analytify helps you monitor and analyze the success of each campaign within your reports.
- Goal Tracking with Analytify Goal Tracking Addon: Set and monitor specific goals, such as form submissions, product purchases, or newsletter signups. The Goal Tracking Addon simplifies setting and tracking conversions. You measure success from your WordPress dashboard.
Monetization Reports:
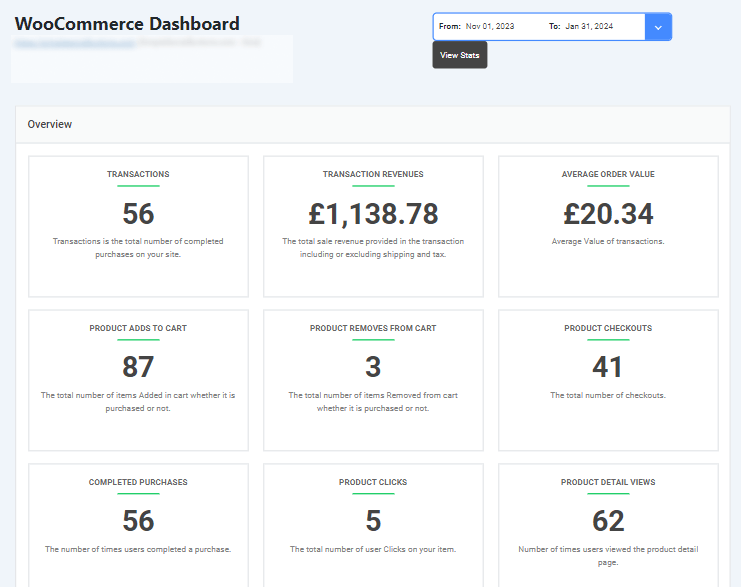
Analytify provides a detailed understanding of your site’s revenue and ecommerce performance, allowing you to track key financial metrics. These reports help you understand how your products and services are performing.
- Ecommerce Tracking
For e-commerce websites, the WooCommerce add-on provides integration, allowing you to track revenue, product performance, and transactions effortlessly. Analytify displays these metrics, making tracking their sales easier for online stores.
Engagement Reports:
In Analytify, these reports give you a deeper understanding of user interactions. It helps you understand user actions, allowing you to pinpoint which content drives engagement:
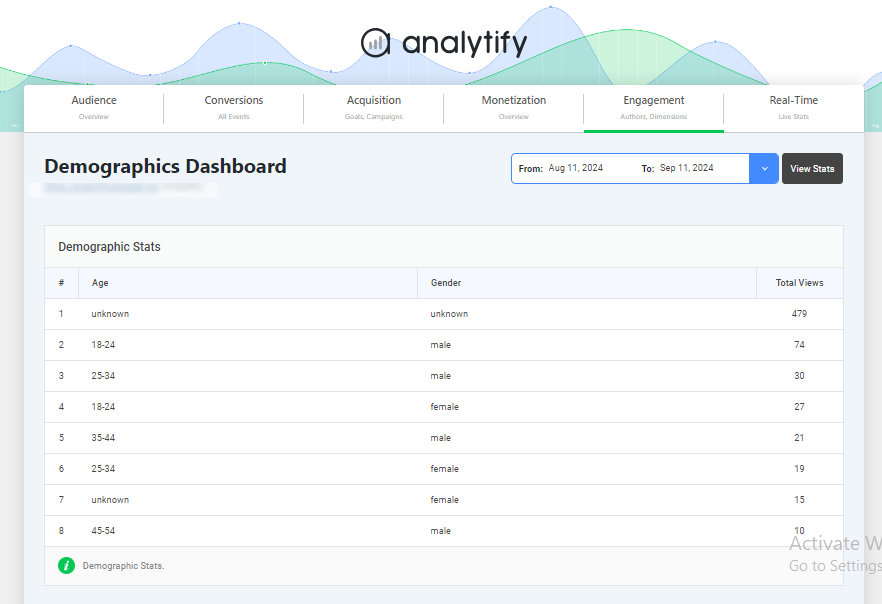
- Demographic Reports: These reports show user age, gender, and interests. They help you create more targeted content and campaigns.
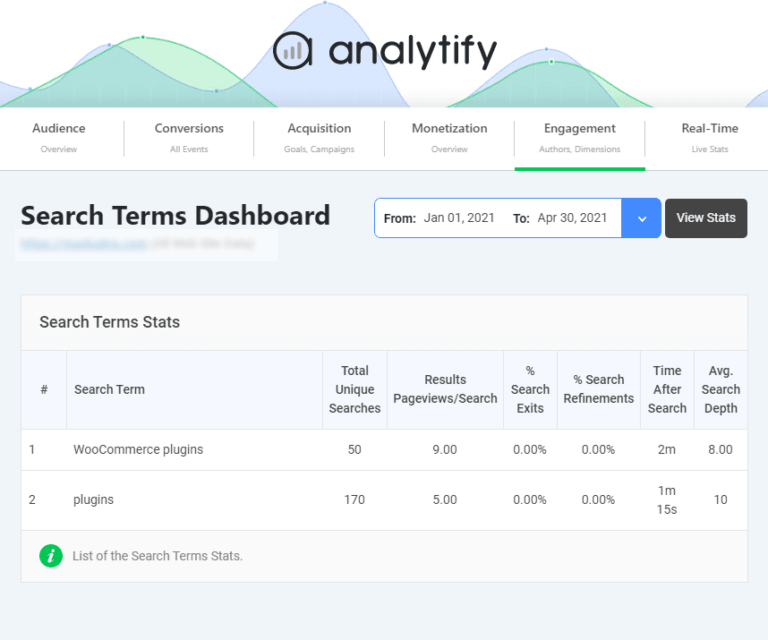
- Search Term Reports: Tracks the search queries users enter on your site. It shows what users look for, which guides content optimization.
- Custom Dimensions Reports: Track unique business-specific metrics, such as user roles or content categories. This gives a more tailored view of user behavior.
Conversions Reports:
Analytify shows what users do on your site. It helps you measure how well your goals and marketing strategies work.
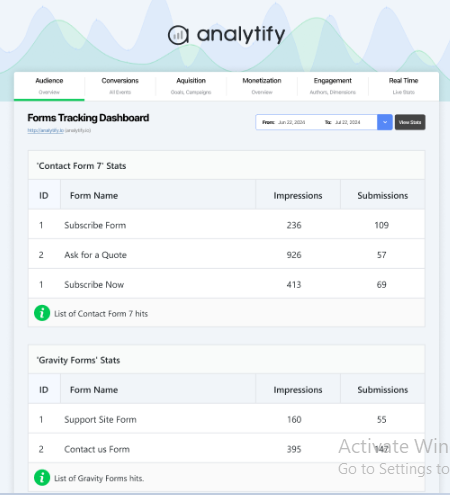
- Forms Tracking in WordPress: Easily track form submissions, including contact forms, sign-ups, and surveys. The Form Tracking Addon helps you monitor conversions and evaluate the performance of various forms on your site.
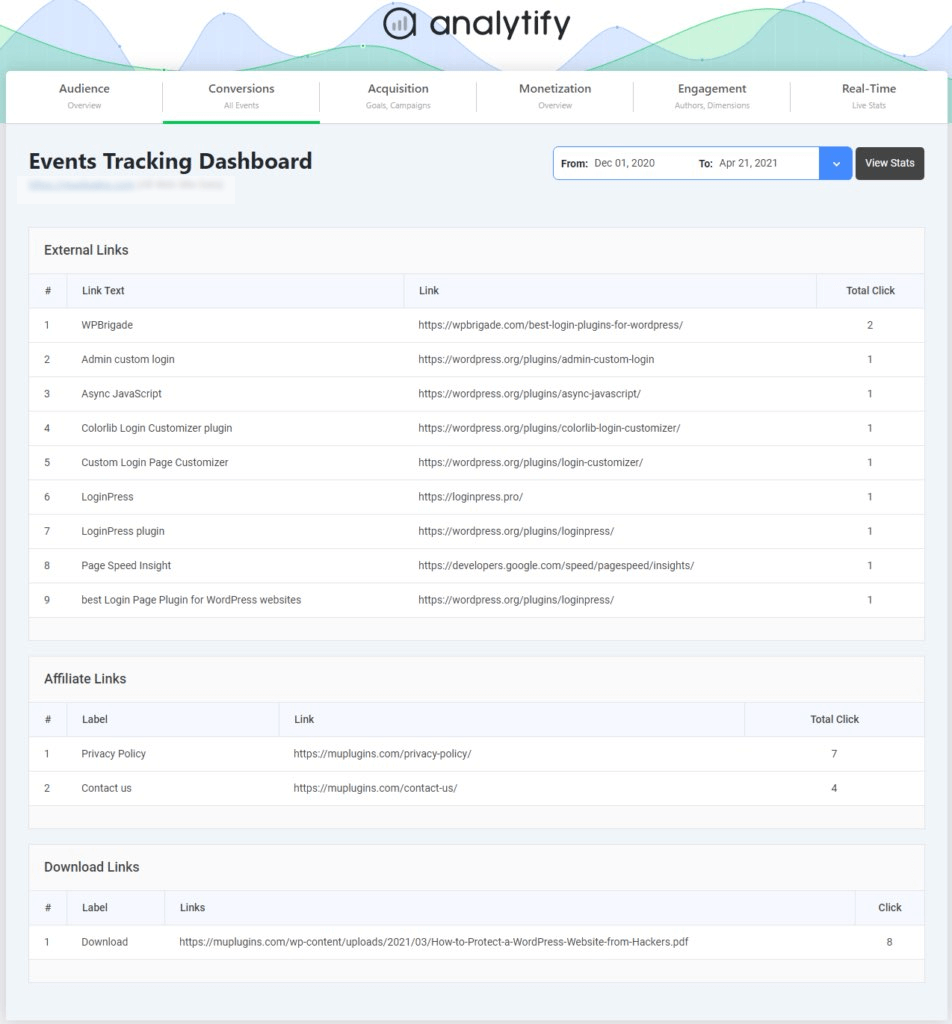
- Events Tracking in WordPress: The Event Tracking Addon tracks clicks, downloads, and video plays. It lets you set up and measure custom events, giving detailed information about specific user actions.
Analytify integrates these GA4 reports and features. It removes the complexity of data analysis, so Google Analytics is easier and more efficient to use.
Google Analytics 4 Glossary
For a deeper understanding of GA4 terms and concepts, read our GA4 Glossary. It defines the basic terms.
Google Analytics for Beginners FAQ
Is Google Analytics free?
Yes. Google Analytics 4 is free for most websites. Google also sells Google Analytics 360, a paid version for large businesses that need higher limits. A free property is enough for most WordPress sites and stores.
How long does it take for Google Analytics to show data?
Real-time reports usually show activity within a few minutes. Standard reports can take 24 to 48 hours to finish processing. Numbers in your reports may change during that time.
Why is Google Analytics not showing data?
Google Analytics shows no data when the tag is missing, wrong, or blocked. Check four things. First, confirm the Measurement ID on your site matches the ID in your web data stream. Second, open the Real-Time report and visit your site in another tab. Third, turn off ad blockers and test again. Fourth, wait 24 to 48 hours for standard reports. If data is still missing, follow our step-by-step fix for Google Analytics not working.
How do I find my Google Analytics Measurement ID?
Open Admin, then click Data streams under Data collection and modification. Select the Web tab and click your web data stream. The Measurement ID sits in the first row of the stream details. It starts with G- followed by letters and numbers.
Can I see Google Analytics reports inside WordPress?
Yes. Analytify shows your GA4 reports inside the WordPress dashboard. Connect your GA4 property once in the Analytify settings. Then open the Real-Time, Acquisition, Engagement, and Ecommerce reports without leaving WordPress.
How long does Google Analytics keep my data?
GA4 keeps event-level data for 2 months by default. You can change the setting to 14 months in the property data retention settings. Standard aggregated reports are not affected by this setting.
Final Thoughts: Google Analytics Beginners Guide
In conclusion, Google Analytics, especially GA4’s advanced features, can significantly improve how you track, analyze, and optimize your website’s performance. This beginner guide to Google Analytics covered the essentials, from creating an account to understanding key reports.
With the integration of Analytify, GA4 becomes even more accessible, especially for WordPress users. Analytify streamlines setup and shows key reports in a simplified interface. It covers user activity, campaign performance, and revenue metrics inside the WordPress dashboard.
To deepen your analytics skills, check out the articles Top 10 Google Analytics Tips and Tricks (2024) and Google Analytics Top Selling Products. These resources offer actionable tips to help you get the most out of your Google Analytics.
We’d love to hear from you! Share your thoughts, questions, or tips about Google Analytics. What challenges have you faced? Let’s discuss this in the comments below!




Thanks a lot for sharing the blog. the information you shared is just awesome and very helpful.
Finally, something concrete about Google Analytics, thanks for your share Zainab.
Thank you for sharing the awesome article with us. that’s very useful. Provides much-needed knowledge.
WOw this is a great thorough article on how to get the analytics set up in Google. I love search console as one of the most powerful tools to see what’s going on with your site. It’s amazing that more people don’t use it so they can make real improvements to their project.
Thank you for your appreciation.