
What are Core Web Vitals and Why They Matter for Your Website?
What are Core Web Vitals, and how to optimize them? If you’re looking for web performance metrics, you’re at right place
Many websites fail Core Web Vitals not because their content is weak or irrelevant, but because they optimize the wrong performance signals. Chasing perfect PageSpeed scores or one-time fixes often overlooks how real users experience a site across devices, networks, and interactions.
Core Web Vitals are designed to measure consistency in real-world performance, not isolated test results.
Google increasingly favors pages that load fast, respond quickly to user interactions, and remain visually stable during loading. When performance falls short, users abandon pages early, engagement drops, and search visibility suffers. Core Web Vitals play a key role in how Google evaluates these experience signals, especially when competing pages offer similar content.
In this guide, I’ll explain what Core Web Vitals are, why they matter for SEO and user experience, how Google assesses them, and how to measure, improve, and track them effectively using PageSpeed Insights, Google Search Console, and Analytify inside WordPress.
Core Web Vitals (TOC):
What are Core Web Vitals?
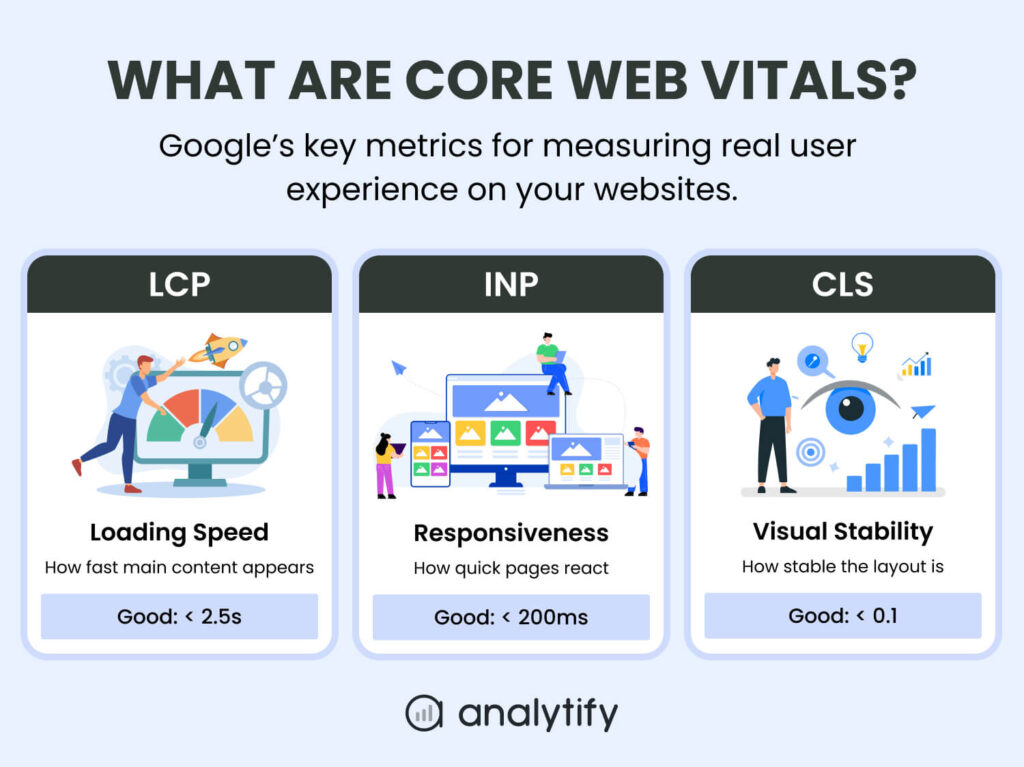
Core Web Vitals are a set of standardized performance metrics Google uses to measure real-world user experience on a website. They focus on how fast a page loads, how quickly it responds to user interactions, and how stable the layout remains while content is loading. These metrics are based on field data, meaning they reflect how real users experience your site, not just lab simulations.
Google introduced Core Web Vitals in 2020 to create a consistent way of evaluating page experience across the web. In 2021, they officially became part of Google’s ranking systems through the Page Experience Update. Since then, the metrics have evolved to better reflect modern browsing behavior.
Most notably, Interaction to Next Paint (INP) replaced First Input Delay (FID) as the official responsiveness metric, offering a more accurate view of how responsive a page feels throughout a user’s session.
Google Core Web Vitals consist of three key metrics:
Largest Contentful Paint (LCP)
LCP measures how long it takes for the largest visible element on a page, usually a hero image, banner, or main heading, to load. It represents perceived loading speed from a user’s perspective. Poor LCP is commonly caused by slow servers, unoptimized images, render-blocking CSS, or heavy JavaScript.
From a user perspective, LCP directly affects first impressions. Slow LCP increases bounce rates and makes a page feel heavy before users even start reading or interacting.
Interaction to Next Paint (INP)
INP measures how quickly a page responds to user interactions such as clicks, taps, or keyboard input. Instead of evaluating only the first interaction, INP assesses responsiveness throughout the entire page lifecycle. High INP values are often linked to excessive JavaScript execution, third-party scripts, or inefficient event handlers.
High INP values make a website feel sluggish and unresponsive, increasing frustration during key actions like form submissions, navigation, or checkout steps.
Cumulative Layout Shift (CLS)
CLS measures visual stability by tracking unexpected layout shifts while a page loads. Elements moving suddenly, such as buttons shifting position or text jumping, create a frustrating user experience. Common CLS issues come from images without defined dimensions, dynamically injected ads, or late-loading web fonts.
Poor CLS reduces trust and usability by causing accidental clicks, disrupted reading flow, and visual instability that signals a low-quality experience to users.
Core Web Vitals Thresholds
| Metric | What It Measures | Good | Needs Improvement | Poor |
| LCP | Main content load time | ≤ 2.5s | 2.5–4s | > 4s |
| INP | Page responsiveness | ≤ 200ms | 200–500ms | > 500ms |
| CLS | Visual stability | ≤ 0.1 | 0.1–0.25 | > 0.25 |
Pages that consistently meet these thresholds are considered to provide a good page experience and are more likely to pass Google’s Core Web Vitals assessment.
How Google Assesses Core Web Vitals
Google does not evaluate Core Web Vitals based on a single test or one-time score. Instead, it uses real-world user data collected over time to determine whether a page provides a good page experience.
Field Data vs Lab Data
Google primarily relies on field data, which comes from real Chrome users who visit your site. This data is collected through the Chrome User Experience Report (CrUX) and reflects how your pages perform under actual network conditions and devices.
Lab data, such as results from PageSpeed Insights or Lighthouse, is useful for debugging and testing changes, but it does not directly influence rankings. Rankings are based on field data.
The 28-Day Rolling Window
Core Web Vitals scores are calculated using a rolling 28-day window. This means:
- Improvements take time to appear in reports
- Short-term optimizations won’t instantly change your CWV status
- Consistent performance matters more than one-off fixes
The 75th Percentile Rule
Google evaluates Core Web Vitals at the 75th percentile of page loads.
In simple terms, this means:
- At least 75% of real user visits must meet the “Good” threshold
- A page fails CWV if too many users have poor experiences, even if average scores look fine
URL-Level vs Origin-Level Assessment
Google assesses Core Web Vitals at two levels:
- URL level: Individual page performance
- Origin level: Overall site performance (domain-wide)
In Google Search Console, URLs with similar issues are grouped together. If enough pages fail, the entire site’s Page Experience signal can be affected.
It’s important to note that a single fast or well-optimized page does not mean a site passes Core Web Vitals. Google evaluates performance consistency across similar URLs and real users, so widespread issues can affect the overall Page Experience signal even if a few pages perform well.
Mobile-First Evaluation
Core Web Vitals are assessed using mobile data by default, even for desktop-heavy sites. If your mobile performance is weak, desktop improvements alone won’t help you pass the Core Web Vitals assessment.
What “Passed Core Web Vitals” Means
A page is considered to have passed Core Web Vitals when all three metrics, LCP, INP, and CLS, meet Google’s “Good” thresholds based on field data. Failing even one metric means the page does not pass the assessment.
Why Core Web Vitals Matter for Your Website
Core Web Vitals influence how Google evaluates the overall experience of a page. While they are not the most powerful ranking factor on their own, they often act as a tie-breaker when multiple pages offer similar relevance and content quality. In competitive search results, even small performance differences can determine which page ranks higher.
Impact on Search Visibility
Core Web Vitals are part of Google’s Page Experience signals, alongside mobile-friendliness, HTTPS, and safe browsing. Pages that consistently meet Core Web Vitals thresholds are more likely to pass the Page Experience assessment, giving them an advantage over slower or less stable competitors. This becomes especially important for sites competing in saturated niches where content quality is already comparable.
Impact on Conversions and Revenue
Performance directly affects user behavior. Faster load times and responsive interactions reduce friction, keeping users engaged and moving through conversion paths. Real-world case studies from companies like Vodafone, Rakuten, and redBus have shown that improving loading speed and responsiveness leads to higher engagement, lower abandonment rates, and increased revenue.
Impact on User Experience
Poor Core Web Vitals create frustration. Slow Largest Contentful Paint makes pages feel heavy, delayed interactions caused by high INP make sites feel unresponsive, and unexpected layout shifts from high CLS disrupt reading and clicking. Over time, these issues erode trust and reduce repeat visits, even if users initially find your content through search.
Why This Matters for WordPress Sites
For WordPress site owners, Core Web Vitals issues often come from themes, plugins, hosting limitations, or third-party scripts. Without proper measurement and prioritization, it’s easy to focus on the wrong fixes. Improving Core Web Vitals helps ensure your WordPress site delivers a smoother experience that supports both SEO performance and business goals.
How Performance Improvements Translate Into Revenue
Core Web Vitals improvements influence user behavior in measurable ways. Faster Largest Contentful Paint reduces early exits and encourages users to stay on the page. Better Interaction to Next Paint improves form completion, navigation flow, and checkout responsiveness. Stable layouts with low Cumulative Layout Shift reduce misclicks and build trust. Together, these improvements help move users smoothly through conversion paths, increasing engagement and revenue without changing content or traffic sources.

How to Measure Core Web Vitals?
Measuring Core Web Vitals correctly is essential before making any optimizations. Google uses multiple data sources to evaluate performance, and each tool serves a different purpose.
Below are some ways for core web vitals assessment:
1. Measuring Core Web Vitals Inside WordPress with Analytify
Join 50,000+ beginners & professionals who use Analytify to simplify their Google Analytics!
For WordPress site owners, Core Web Vitals data often lives outside the dashboard in tools like PageSpeed Insights or Search Console. While these tools are essential, constantly switching between platforms makes it harder to connect performance issues with real user behavior on your site.
Analytify bridges this gap by surfacing Core Web Vitals insights directly inside the WordPress dashboard and placing them alongside GA4 traffic and engagement data. This allows site owners to understand not just whether a page fails Core Web Vitals, but which pages matter most from a business and traffic perspective.
Analytify brings Google PageSpeed Insights performance data into your WordPress dashboard, including metrics that relate to Core Web Vitals. While this PageSpeed integration helps you see how your pages perform in Google’s lab and field data via the PSI API, Analytify gives you centralized access to PageSpeed‑derived CWV metrics alongside GA4 traffic and engagement data for easier analysis within WordPress.
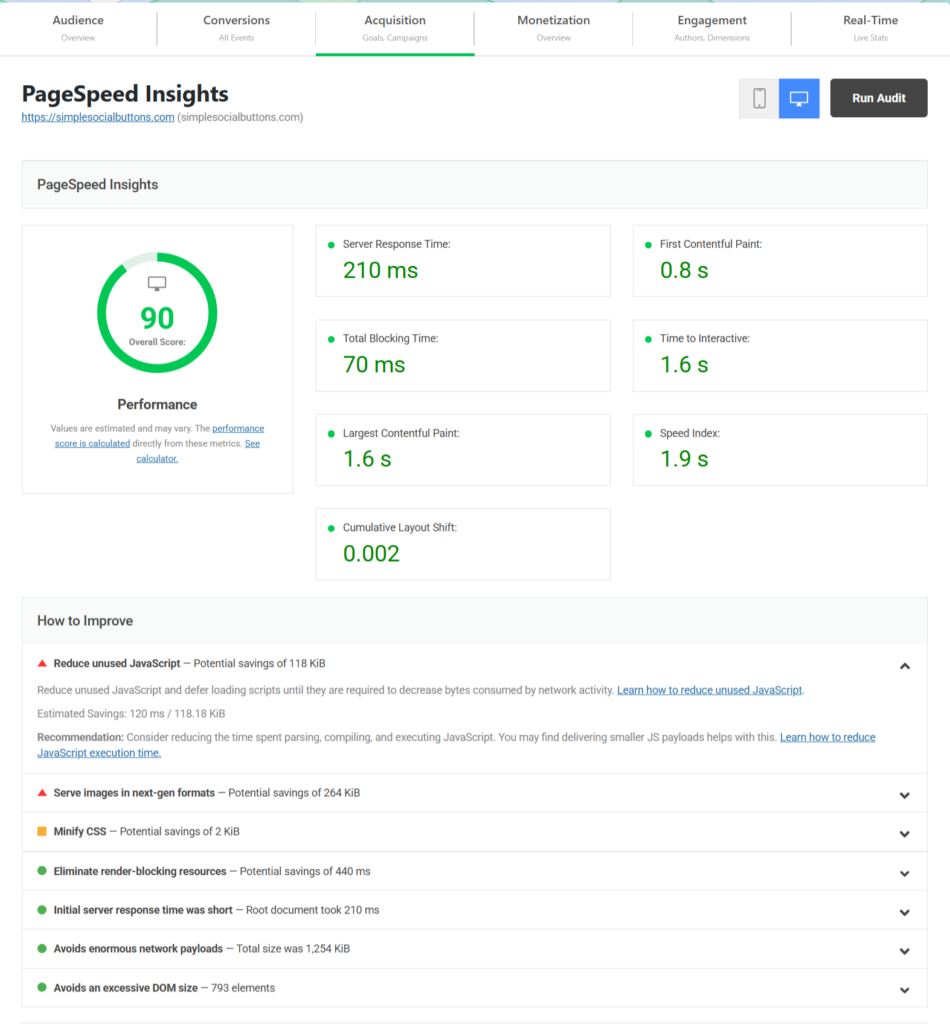
Let’s break down the above Analytify report to help you easily understand how to read and evaluate your website’s Web Vitals.
When you open the PageSpeed Insights report inside Analytify, you can see a clear breakdown of how your page performs in terms of speed, stability, and user experience.
Here’s how to understand each part of this report.
Overall Performance Score
At the top of Analytify’s report, you can see an overall performance score.
This score is calculated using multiple loading and experience metrics and gives you a quick idea of how well your page performs.
- A score above 90 means your page is well-optimized
- This page shows a 90 score, which indicates strong performance
Largest Contentful Paint (LCP)
In Analytify’s report, you can see Largest Contentful Paint listed as 1.6 seconds.
This shows how long it takes for the main content of the page, such as a hero image or headline section to fully load.
- Lower LCP means visitors see the important content faster
- An LCP under 2.5 seconds is considered good
This result indicates that the page’s primary content loads quickly.
Cumulative Layout Shift (CLS)
You can also see Cumulative Layout Shift with a value of 0.002.
This metric shows whether the page layout shifts unexpectedly while loading.
- A low CLS means the page stays visually stable
- Scores below 0.1 are ideal
This very low CLS value shows that elements on the page do not jump or move as users view it.
Total Blocking Time (TBT)
Analytify’s PageSpeed report shows Total Blocking Time as 70 milliseconds.
This tells you how long the browser is blocked by JavaScript and unable to respond to user interactions.
- Lower TBT means better responsiveness
- Values under 200 ms are considered good
A low blocking time suggests that scripts on the page are not slowing down user interactions.
First Contentful Paint (FCP)
You can see First Contentful Paint at 0.8 seconds.
This shows how quickly the first visible content appears on the screen.
A fast FCP reassures users that the page is loading and contributes to a better perceived experience.
Time to Interactive (TTI)
In the same report, Time to Interactive is shown as 1.6 seconds.
This metric tells you when the page becomes fully interactive, meaning users can click buttons and use forms without delay.
A lower TTI means visitors can start interacting with your site sooner.
Speed Index
The Speed Index in Analytify’s report is 1.9 seconds.
This reflects how quickly the visible parts of the page are displayed during load.
Lower values indicate that content appears smoothly and progressively.
Server Response Time
You can also see Server Response Time listed as 210 ms.
This shows how quickly your server responds to the initial page request.
A fast server response helps all other performance metrics load efficiently.
How to Improve Section
At the bottom of Analytify’s report, you can see a “How to Improve” section.
This area highlights:
- Unused JavaScript
- Image optimization opportunities
- Render-blocking resources
- Minor CSS optimizations
These are suggested improvements, even when the overall performance is already good.
What This Report Tells You
By reviewing this report in Analytify, you can quickly see:
- How fast your main content loads
- Whether your layout stays stable
- How responsive your page feels
- Where small performance improvements are possible
This makes it easier to monitor Core Web Vitals–related performance directly from your WordPress dashboard without needing technical tools.
- View Core Web Vitals data in context with page-level traffic and engagement
- Compare performance trends against user behavior without leaving WordPress
Instead of treating Core Web Vitals as isolated technical scores, Analytify helps you evaluate them as part of the broader user experience. This makes it easier to prioritize optimizations that improve real user outcomes, not just performance metrics.
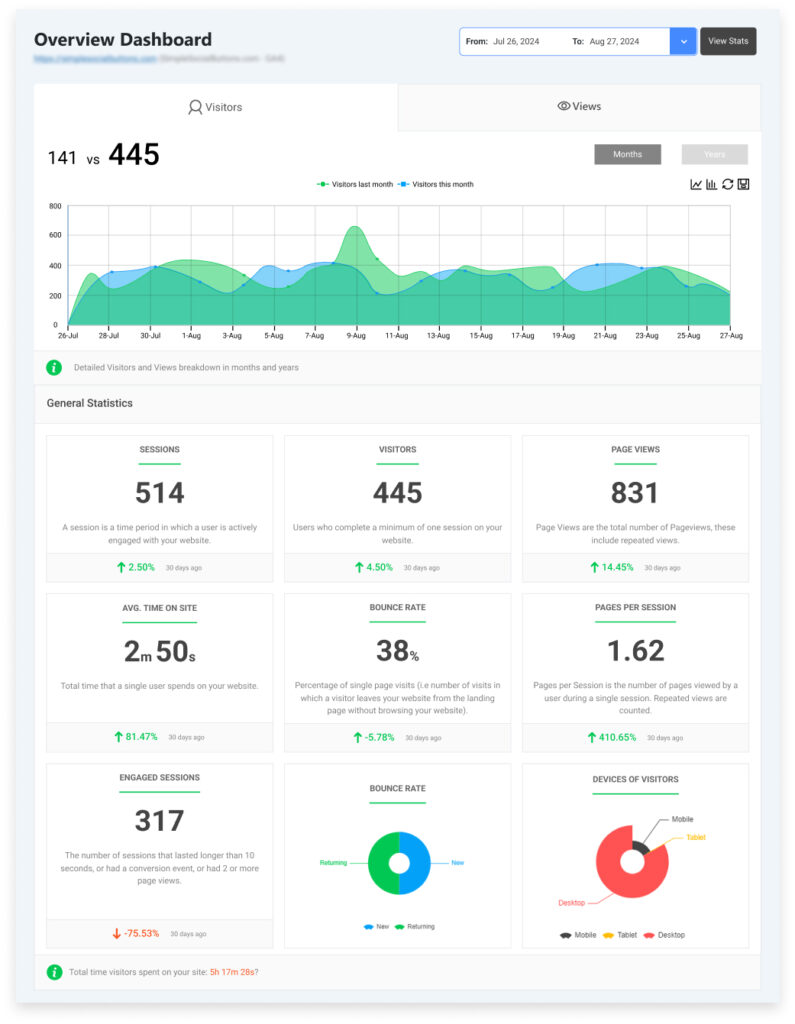
You can also see your GA4 essential web analytics right from your WordPress site in Analytify dashboard:
2. Google PageSpeed Insights
PageSpeed Insights is another commonly used tool for checking Core Web Vitals at the URL level. It combines field data from the Chrome User Experience Report with lab data from Lighthouse.
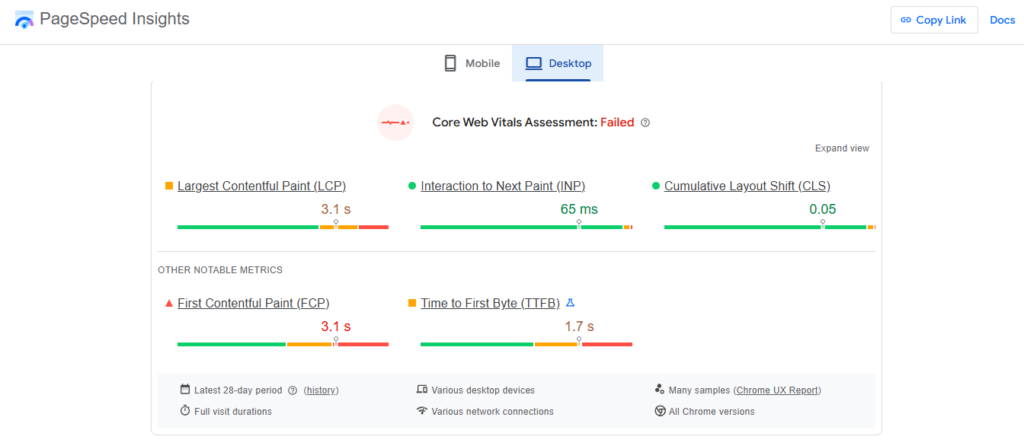
How to use it effectively:
- Enter a page URL and review mobile and desktop results.
- Check whether field data is available and whether the page passes Core Web Vitals.
- Use lab data to identify specific performance issues to fix.
- Compare mobile and desktop results to spot device-specific problems.
Lab data helps diagnose issues, but only field data determines whether a page passes the Core Web Vitals assessment.
Screenshot placeholder: PageSpeed Insights report for a WordPress page
3. Google Search Console
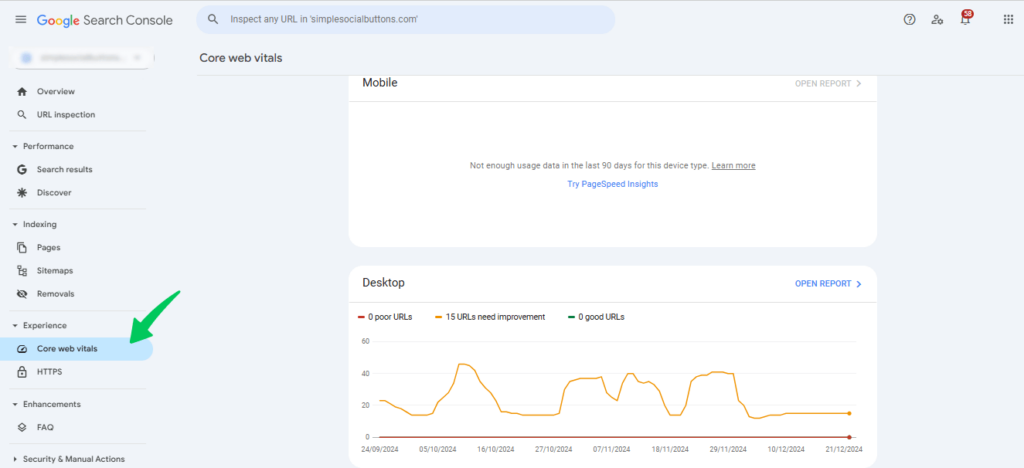
Google Search Console provides site-wide Core Web Vitals reporting based entirely on real user data. Instead of individual URLs, it groups pages with similar performance issues.
Use Search Console to:
- Identify URL groups failing LCP, INP, or CLS
- Track improvements or regressions over time
- Understand whether issues affect a few pages or your entire site
Search Console is the best tool for monitoring Core Web Vitals at scale.
How to Improve Core Web Vitals (Step-by-Step)
Improving Core Web Vitals works best when you follow a structured process instead of applying random performance fixes. The most effective approach is measure first, optimize next, and track continuously. This ensures your efforts target the metrics and pages that actually impact user experience and SEO.
Helpful Tip: If time or resources are limited, prioritize fixes strategically. Start by improving Largest Contentful Paint on high-traffic or entry pages, then address Interaction to Next Paint on pages with important user actions such as forms or checkouts. Tackle Cumulative Layout Shift last unless layout instability is severe. This approach delivers faster, more noticeable gains with less effort.
Before improving your web vitas, know these common Core Web Vitals Mistakes to Avoid:
Many Core Web Vitals issues persist due to misguided optimization efforts. Avoid installing multiple performance plugins without understanding their impact, chasing perfect PageSpeed scores instead of real user data, or relying solely on lab results. Sustainable improvements come from targeted fixes guided by field data and continuous monitoring.
Step 1: Apply Foundational Improvements (All Metrics)
Before optimizing individual metrics, address issues that affect overall performance.
- Use high-performance hosting
Fast, managed WordPress hosting improves server response time, which directly affects LCP and INP. - Choose a lightweight WordPress theme
Performance-optimized themes like Astra, GeneratePress, or Kadence reduce unnecessary CSS and JavaScript. - Clean up plugins
Remove unused or overlapping plugins to reduce script execution and resource load. - Enable a global CDN
A content delivery network improves load times for visitors across different locations.
Step 2: Optimize Largest Contentful Paint (LCP)
LCP is often the easiest metric to improve and usually delivers the most noticeable gains.
- Optimize images
Compress images, convert them to WebP, and keep critical visuals under 200 KB. - Improve caching and lazy loading
Use page caching and lazy load non-critical assets to speed up initial rendering. - Reduce render-blocking resources
Inline critical CSS and defer non-essential JavaScript files.
Step 3: Improve Interaction to Next Paint (INP)
INP reflects how responsive your site feels during real user interactions.
- Audit third-party scripts
Remove unnecessary trackers, ads, or widgets that block the main thread. - Optimize JavaScript execution
Defer or load non-critical scripts asynchronously. - Streamline interactive elements
Ensure buttons, menus, and forms respond quickly, especially on mobile devices.
Step 4: Reduce Cumulative Layout Shift (CLS)
CLS issues often come from layout instability during page load.
- Reserve space for dynamic elements
Define width and height for images, ads, and embedded content. - Avoid layout-shifting popups
Use overlays or slide-ins that don’t push content down. - Optimize font loading
Apply font-display: swap to prevent text jumps during loading.
Step 5: Track Progress and Prevent Regressions
Core Web Vitals require ongoing monitoring, not one-time fixes.
- Monitor performance after plugin, theme, or content updates
- Watch for seasonal traffic spikes that may impact INP
- Review rolling 28-day data to detect regressions early
Analytify tip: Analytify brings Core Web Vitals insights into the WordPress dashboard and connects them with GA4 traffic, engagement, and conversion data. This unified view helps site owners identify which performance issues affect real users, prioritize fixes on high-impact pages, and track whether optimizations lead to meaningful improvements, not just better scores.
Screenshot placeholder: Ongoing Core Web Vitals monitoring
Core Web Vitals Guidelines and Best Practices
Improving Core Web Vitals is not a one-time task. Google evaluates performance continuously using real user data, so maintaining good scores requires ongoing monitoring and incremental improvements.
Follow a Continuous Optimization Approach
Rather than chasing perfect scores in lab tools, focus on consistent real-world performance. Small, stable improvements across high-traffic pages often deliver better results than aggressive changes applied site-wide.
Prioritize Metrics in the Right Order
Not all Core Web Vitals have the same impact. A practical optimization order is:
- Largest Contentful Paint (LCP) – improves perceived loading speed
- Interaction to Next Paint (INP) – improves responsiveness and usability
- Cumulative Layout Shift (CLS) – improves visual stability
Fixing LCP first typically delivers the fastest visible gains.
Align With Google’s Page Experience Guidelines
Web Vitals are part of Google’s broader Page Experience signals, which also include mobile-friendliness, HTTPS, and safe browsing. Strong Core Web Vitals cannot compensate for poor content or weak relevance, but they can strengthen otherwise competitive pages.
Monitor and Adapt Over Time
Web Vitals performance can change after theme updates, plugin installations, content changes, or traffic spikes. Regular monitoring helps detect regressions early and ensures your site continues to meet Google’s recommended thresholds.
For WordPress site owners, using a tool like Analytify makes long-term tracking easier by keeping Core Web Vitals data connected to traffic and engagement insights inside the dashboard.
Frequently Asked Questions
What are Google Core Web Vitals?
Google Core Web Vitals are a set of performance metrics Google uses to measure real-world user experience on a website. They focus on loading speed, responsiveness, and visual stability using real user data.
Are Core Web Vitals a ranking factor?
Yes, Core Web Vitals are part of Google’s Page Experience signals. They do not override content relevance, but can act as a tie-breaker when competing pages offer similar quality and intent match.
What does “Passed Core Web Vitals” mean?
A page passes Core Web Vitals when all three metrics — LCP, INP, and CLS — meet Google’s “Good” thresholds based on field data collected over a rolling 28-day period.
What are good scores for LCP, INP, and CLS?
Good thresholds are:
LCP: 2.5 seconds or less
INP: 200 milliseconds or less
CLS: 0.1 or less
Scores outside these ranges may negatively affect page experience.
Is PageSpeed Insights enough to measure Core Web Vitals?
PageSpeed Insights is useful for URL-level checks and diagnostics, but it should be combined with Google Search Console for site-wide monitoring and trend analysis.
How long does it take to see Core Web Vitals improvements?
Because Google uses a rolling 28-day window, noticeable improvements usually appear after several weeks of consistent performance improvements.
Can I track Core Web Vitals in WordPress or GA4?
Yes. Core Web Vitals can be tracked using PageSpeed Insights and Google Search Console. Tools like Analytify also bring Core Web Vitals data into the WordPress dashboard alongside GA4 metrics.
Which Core Web Vital affects SEO the most?
Largest Contentful Paint (LCP) usually has the biggest impact because it directly affects perceived loading speed and user engagement.
Will fixing Core Web Vitals guarantee higher rankings?
No. Improving Core Web Vitals alone does not guarantee ranking improvements. However, it strengthens page experience and can improve performance when content relevance is already strong.
Final Thoughts
Core Web Vitals are essential for ensuring your website delivers a fast, responsive, and stable experience for visitors. While they are just one part of Google’s Page Experience signals, improving LCP, INP, and CLS can boost search visibility, user engagement, and conversion rates, especially when competing pages have similar content quality.
The best approach is step-by-step: measure, optimize, and track your Core Web Vitals regularly. Tools like PageSpeed Insights, Google Search Console, and Analytify make it easier to monitor performance, identify problem areas, and confirm that optimizations lead to real-world improvements.
Start by analyzing your high-traffic or conversion-critical pages, apply foundational improvements, and then optimize LCP, INP, and CLS in order of priority. With consistent tracking and incremental updates, your WordPress site can provide a better user experience, gain a competitive edge in search rankings, and increase engagement and revenue.
Take action today: measure your Core Web Vitals, implement targeted optimizations, and track progress with Analytify to ensure your website performs at its best for both users and search engines.
Further Readings:
- Google Core Web Vitals Becoming Ranking Signals
- How Quickly Should A Website Page Load
- GA4 Site Speed – (How to Track & Alternatives)
Now I’d love to hear from you. Which Core Web Vitals has been the hardest for you to improve on your site, LCP, INP, or CLS. And what’s been blocking progress so far?


