How to View WordPress Site Stats and Page Views (2026 Guide)
Ever wonder which of your WordPress pages your visitors love most and which ones they just scroll past?
You’re not alone. Every website owner wants to know what’s working, what’s not, and where people spend their time. That’s where WordPress site stats come in.
Tracking your WordPress statistics at the site and page levels helps you understand your audience. When you can see which blog posts attract visitors, how long they stay, and what leads them to convert, you can make smarter decisions that grow your site faster.
Google Analytics already does a fantastic job of collecting this data behind the scenes. But if you prefer seeing those insights right inside your WordPress dashboard in a more visual and easy-to-navigate way, Analytify has you covered.
In this guide, I will show you how to view your WordPress site stats and check page view stats.
WordPress Site Stats (TOC):
What Are WordPress Site Stats?
WordPress site stats show how your website is performing, who visits, what they read, and how they interact with your content. These stats come from tracking tools like Google Analytics, which collect data about your visitors and their behavior.
Some key metrics include:
- Visitors and Sessions: How many people visit your site and how often.
- Page Views: The total number of times your pages are viewed.
- Bounce Rate: The percentage of visitors who leave without taking action.
- Average Time on Page: How long people stay on a page.
- Top Pages and Traffic Sources: Which content gets the most attention, and where your visitors come from.
Understanding these WordPress traffic analytics helps you see what’s working, what needs improvement, and how your audience engages with your site.
Why Monitoring Your WordPress Site Stats Matters
Keeping track of your website stats helps you understand how people use your site and what’s working or not. When you know which pages attract the most visitors, how users move through your site, and where they leave, you can make better decisions to grow your audience and improve performance.
Here’s why your WordPress stats matter:
- Know your audience: See who visits your site, where they come from, and what content interests them most.
- Find top content: Identify the posts and pages that bring in the most traffic so you can create more of what works.
- Improve engagement: Learn how long visitors stay and what keeps them browsing longer.
- Boost conversions: Track which pages lead to sign-ups, purchases, or other key actions.
- Fix weak spots: Spot pages with high bounce rates or low engagement and improve them.
Common Ways to Check WordPress Site Stats
There are two main ways to check your WordPress site stats.
- One is using Google Analytics (GA4) directly.
- Another method is viewing them effortlessly inside your WordPress dashboard with Analytify, the best WordPress plugin.
How to View Your WordPress Site Stats & Page Statistics with Analytify (Step by Step)
Join 50,000+ beginners & professionals who use Analytify to simplify their Google Analytics!
Analytify connects your GA4 data directly to WordPress, showing all the key stats like page views, top posts, bounce rate, and engagement in one easy-to-read dashboard. You don’t have to leave WordPress or dig through multiple menus.
Here’s how you can set it up and see website stats in WordPress in just a few minutes.
Step 1: Install and Connect Analytify
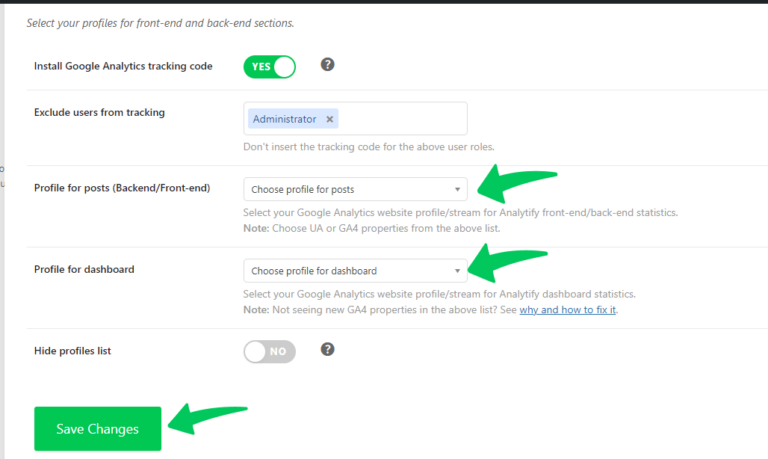
From your WordPress dashboard, go to Plugins >> Add New, search for Analytify, and click Install >> Activate. Read in detail How to Install Analytify.
Once activated, Analytify will ask you to connect with your Google Analytics 4 account.
You’ll go through a quick authorization process. Just follow the prompts and select the GA4 property you want to track.
That’s it! Your WordPress site is now connected to Google Analytics through Analytify.
Step 2: Explore Your WordPress Site Analytics
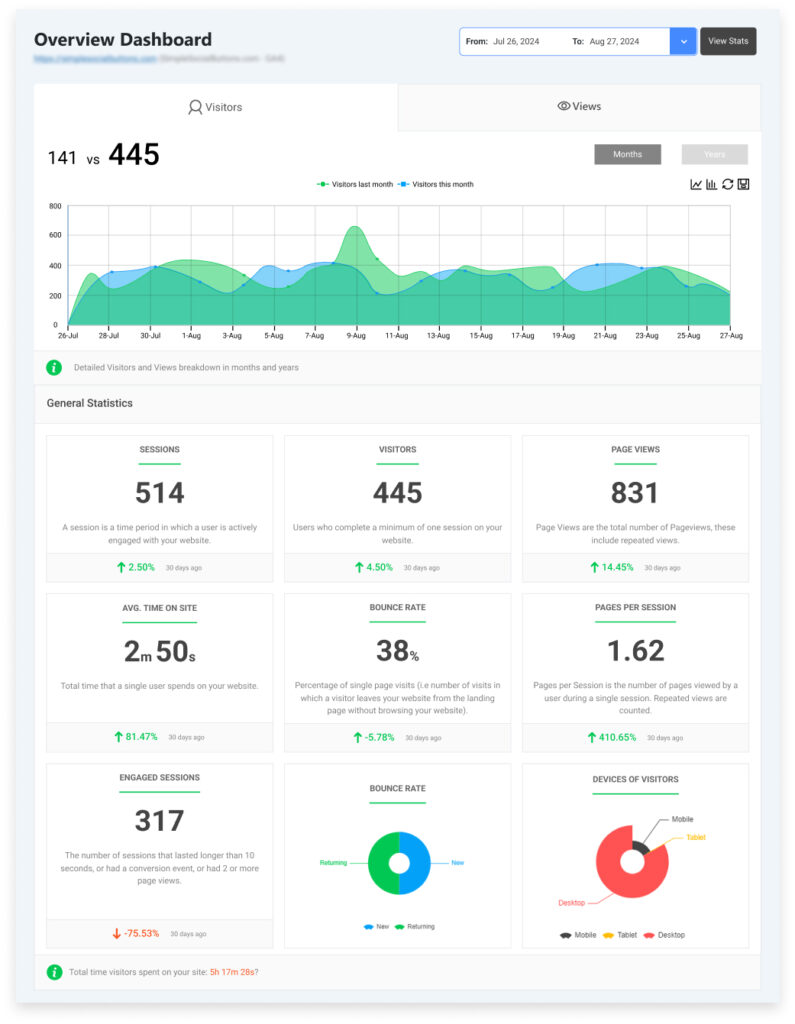
After setup, open Analytify >> Dashboard from the sidebar.
You’ll check WordPress traffic and key stats right inside WordPress.
There are no external tabs or confusing reports to track WordPress visitors.
Here’s what you’ll typically find:
- Visitors and Sessions – how many people visited and how often.
- Top Pages – your most-viewed posts or pages.
- Traffic Sources – where visitors are coming from (search, social, direct).
- Engagement Metrics – average time on page, bounce rate, and more.
Each section is displayed visually, so even beginners can understand what’s working and what’s not at a glance. That’s how to check site traffic on WordPress effortlessly using Analytify, the best Google Analytics plugin.
Step 3: Enable WordPress Analytics by Page and Post
Analytify can show stats right inside your Posts and Pages section, but you need to enable it first.
Here’s how:
- Go to Analytify >> Settings >> Admin.
- Scroll to the section Analytics under Posts/Pages.
- Enable these options one by one to view page stats WordPress:
- Enable analytics under posts/pages (wp-admin):
Activates post-level analytics boxes in your WordPress admin area. - Display analytics to roles (posts & pages):
Choose which user roles (e.g., Administrator, Editor, Author) can view these stats. This feature restricts visibility so only the chosen roles see the analytics data. - Analytics on post types:
Select which post types you want to track, for example, Posts, Pages, or Custom Post Types like Products or Portfolio Items. - Edit posts/pages analytics panels:
Customize which metrics appear in each post or page’s analytics panel (e.g., views, general stats, social media stats, bounce rate, average time on page). - Exclude analytics on specific pages:
- Enable analytics under posts/pages (wp-admin):
You can even exclude WordPress page views from specific pages, where you don’t find the need.
- Once done, click Save Changes.
Once this is done, you’ll see a small analytics summary under each post or page in the WordPress admin area.
Step 4: View Stats for Individual Pages or Posts
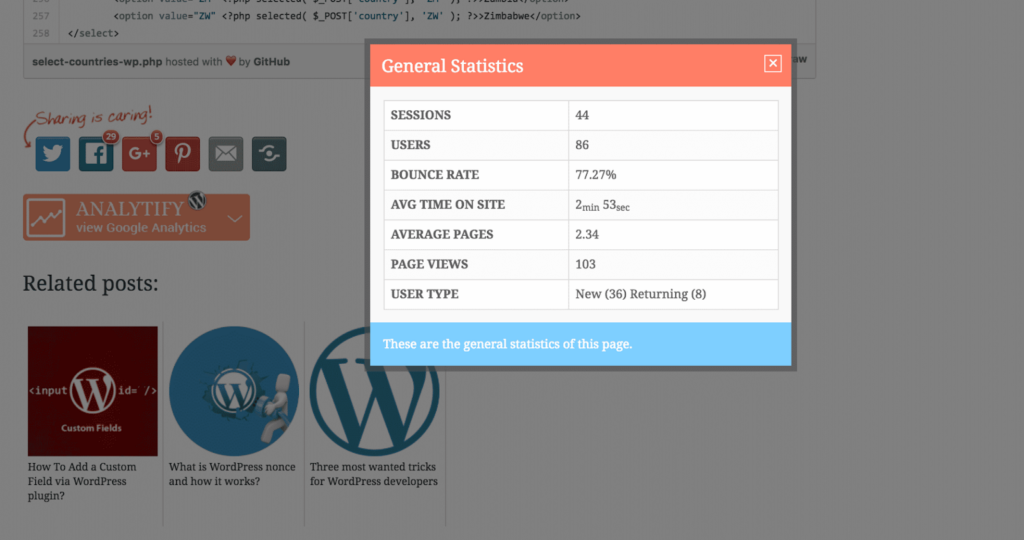
To view stats for individual pages or posts, you need to go to any page or post and scroll down to Analytify Stats Panel and click on View Stats.
It’ll show quick stats like:
- Sessions
- Visitors
- Page Views
- Average Time on Page
- Bounce Rate
This helps you understand which posts attract the most engagement and what type of content your audience prefers.
Step 5: (Optional) Display Stats on the Front End
Want your readers to see how popular your content is? Analytify lets you display page views on the front end of your website.
Here’s how to enable it:
- Go to Analytify >> Settings >> Front.
- Find the option Disable front end
- Make sure it’s enabled and not disablled.
- Choose where you’d like the stats to appear (e.g., below the post title or at the end of the post).
- Then, click on Save Changes.
This feature acts as social proof when visitors see a post with high views; they’re more likely to read and trust it.
Step 6: Verify and Customize
- Refresh your Posts or Pages list to make sure analytics are showing.
- If you still don’t see stats, double-check:
- Your GA4 property is correctly connected.
- You’re logged in as an Admin (stats may not appear for lower roles).
- Tracking has been running for a few hours (GA4 data isn’t instant).
- Your GA4 property is correctly connected.
Bonus: See Top Pages Stats
You can also check top pages stats in Analytify.
How to See Individual Post Views in Google Analytics (GA4)
While GA4 doesn’t show post-level views as directly as Universal Analytics used to, you can still view them using the “Pages and screens” report.
Using the “Pages and screens” Report
- Sign in to GA4.
- Go to Reports >> Engagement >>> Pages and screens.
- You’ll see a list of all your URLs under the “Page title and screen class” column.
- Use the search bar to type part of your post URL (e.g., /blog/how-to-start-a-wordpress-site/).
- The metrics shown include:
- Views (pageviews)
- Users
- Average engagement time
- Event count (interactions)
Site-Wide Stats vs. Individual Page Analytics: When to Use Each
When it comes to understanding your website’s performance, both site-wide and individual page analytics play an important role. It’s like seeing the big picture vs. zooming in on the details.
Let’s see a comparison table to better understand when to use WordPress site stats vs page stats.
| Metric Type | What It Shows | Best For | Where to Find in Analytify |
| Site-Wide Stats | Overall website traffic, sources, session duration, top referrers | Tracking growth, audience insights, campaign results | Dashboard >> Analytify >>Overview |
| Individual Page Stats | Page views, average time on page, bounce rate, entrances | Optimizing specific posts/pages, improving engagement | Under each Post/Page >> Analytify Stats Panel |
| Front-End Stats (Bonus) | Stats shown directly on your live post/page (for logged-in users) | Authors or admins who want to monitor performance instantly | Enable in Analytify >> Settings >> Front-End Stats |
Pro Tips: Use site-wide analytics to shape your overall strategy, and individual post insights to fine-tune the details. Together, they give you a full 360° view of your WordPress performance.
How Analytify and GA4 Work Together to Simplify WordPress Analytics
Google Analytics 4 (GA4) is the foundation of website tracking. It collects powerful data about how people find, use, and engage with your WordPress site from page views to user journeys.
Analytify builds on top of GA4 to make those insights easier to access and understand. Instead of switching between dashboards or digging through GA4’s complex reports, you can view everything right inside WordPress clearly and visually.
Once you connect GA4 to Analytify, your data flows directly into your WordPress dashboard. You can see traffic trends, engagement metrics, and top-performing posts without leaving your site.
While GA4 handles data collection and measurement, Analytify focuses on presentation and simplicity. It organizes your analytics into meaningful views, site-wide summaries, page-level stats, and front-end insights. This is all in a format anyone can understand.
Together, they form a perfect pair:
- GA4 gathers accurate data.
- Analytify turns it into clear, actionable insights.
Pro Tips to Get the Most Out of WordPress Site Stats and Page Views
- Review site stats weekly to track growth trends.
- Use Comparison Mode to analyze progress over time.
- Identify top-performing pages and replicate their success.
- Monitor traffic sources to refine marketing efforts.
- Check engagement metrics like bounce rate and time on page.
- Enable Front-End Stats for authors and contributors.
- Export or share reports for quick performance reviews.
FAQs About WordPress Site Stats
1. Can I check my WordPress site stats without leaving my WP dashboard?
Yes! With Analytify, you can view detailed Google Analytics (GA4) reports right inside your WordPress dashboard. No need to open multiple tabs or log into GA4 separately.
2. Do I need Google Analytics to use Analytify?
Yes. Analytify connects directly to your Google Analytics 4 property and displays your data in a simplified, easy-to-understand format within WordPress.
3. Can I see stats for individual posts and pages?
Absolutely. Analytify, the Google Analytics plugin, lets you view page- and post-level analytics directly under each post or page in your WordPress admin area.
4. Can I display analytics on the front end of my website?
Yes. You can choose to show front-end analytics on your posts and pages and even control which user roles (like editors or admins) can view them. For this, you need to install the Analytify Google Analytics plugin on your WordPress site.
5. How often does Analytify update my stats?
Analytify pulls fresh data from Google Analytics in near real-time, so you always have up-to-date insights about traffic, engagement, and conversions.
Recap: What You’ve Learned About WordPress Site Stats
Here’s a quick rundown before you go:
- WordPress site stats show how your audience interacts with your content, from page views to user behavior.
- While GA4 gives you detailed insights, it can be complex for beginners and requires switching between platforms.
- Analytify simplifies that by bringing your GA4 data straight into WordPress visually, clearly, and in real time.
- You can even view stats on the front end or under individual posts and pages, helping you understand what works best at a glance.
- With just a few clicks, you can track traffic, engagement, and performance all without leaving your dashboard.
I hope this detailed post helped you to view WordPress site stats and page views effortlessly.
You may also like to read:
Now over to you: Which Analytify feature do you find most useful for understanding your site’s performance? The page-level stats or the front-end analytics? Share your thoughts in the comments below!


