How to Fix GA4 Debug View Not Working? (2025)
GA4 Debug View Not Working? It’s a common difficulty many people face when using Google Analytics 4.
Whether you’re a digital marketer or a web owner, understanding why DebugView in Google Analytics 4 is not working can save you a lot of frustration.
In this article, we’ll explore why is your debug view not showing anything and, most importantly, how to fix Google Analytics DebugView.
GA4 Debug View Not Working (TOC):
What is DebugView Report in Google Analytics 4
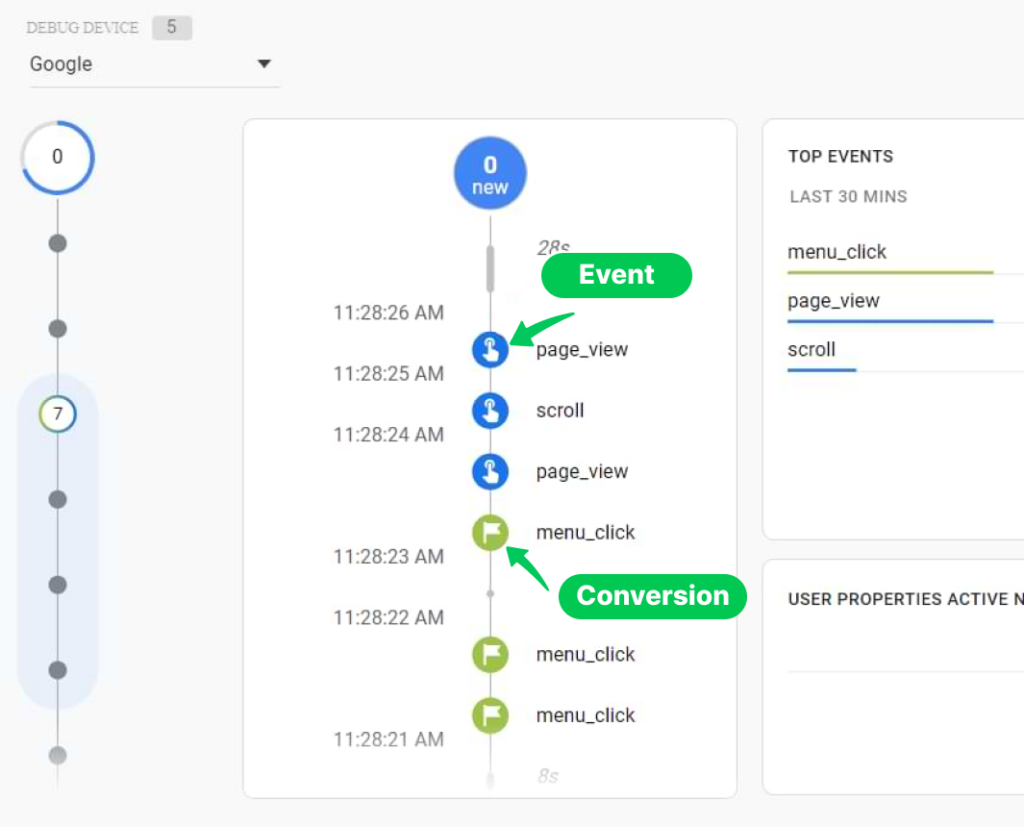
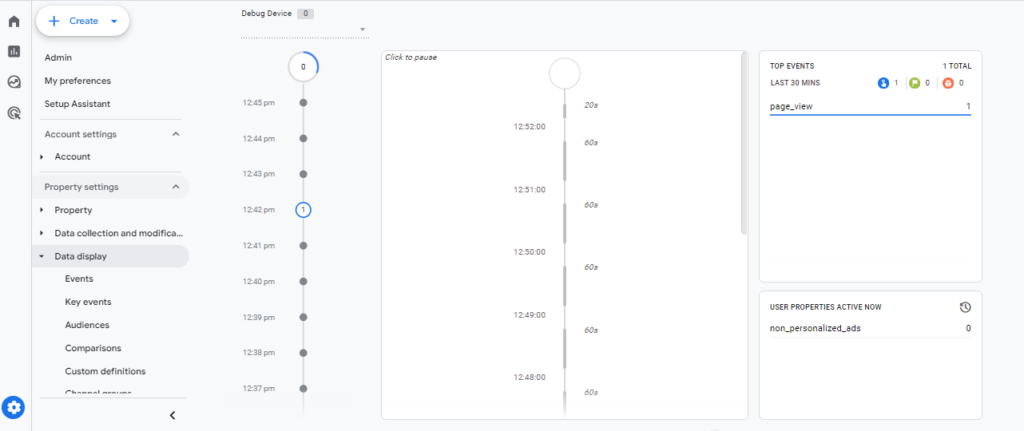
DebugView in Google Analytics 4 is a powerful feature designed to help you test and debug your tracking implementation in real time. It provides a moment-by-moment snapshot of the events fired from your app or website, ensuring that everything tracks as expected.
DebugView in Google Analytics 4 (GA4) is accessed through the GA4 interface. To use it, ensure your Google Analytics account is set up with Debug mode enabled on your testing device or browser. Debug mode can be activated by installing the Google Analytics Debugger extension for browsers or using a specific debug configuration in mobile apps. Once
DebugView report is essential for developers and marketers who need to ensure the accuracy of their Google Analytics tracking. It allows for immediate feedback and troubleshooting, saving time and reducing the risk of data errors.
However, if you find the debug view not showing anything, you might be missing out on the necessary insights needed to optimize your user’s journey.
Now that we have a basic understanding of GA4 DebugView, let’s explore the common issues that might be keeping it from working properly.
15 Reasons for GA4 DebugView Not Working (With Solutions)
There can be a lot of reasons behind the GA4 Debug View Not Working. Here, we’ve identified 15 possible problems why your Debug View not working along with their fixes to help you troubleshoot effectively.
Let’s break down each issue one by one:
1. Incorrect Configuration & Improper Tagging
One of the most frequent reasons for debugview in Google Analytics 4 not working is incorrect configuration settings, including improper tagging.
If this is the case, your GA4 real-time report will also not be working.
Ensure that your tracking code is correctly installed
Implementing the correct tracking code is important for GA4 to collect data properly. An incorrect or improperly implemented tracking code can result in no data being recorded in the DebugView.
How to Fix Improper Tracking
Here’s how to identify and fix issues related to an incorrect tracking code:
Steps to Fix:
- Verify the Correct Tracking Code:
- Get the GA4 Tracking Code:
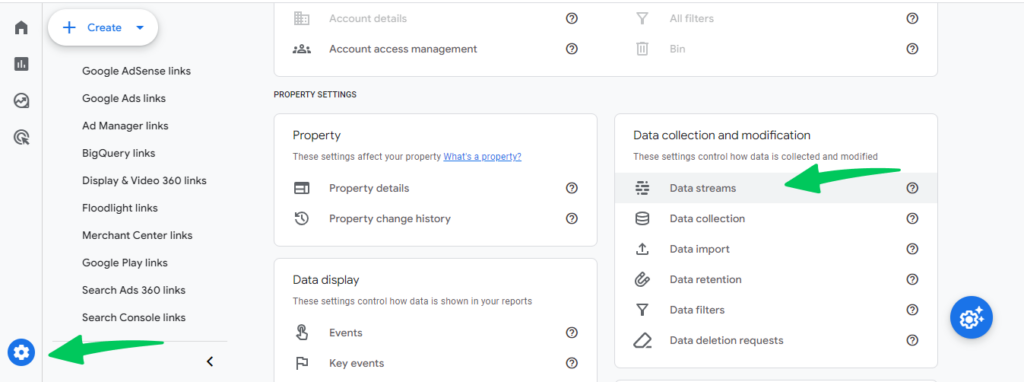
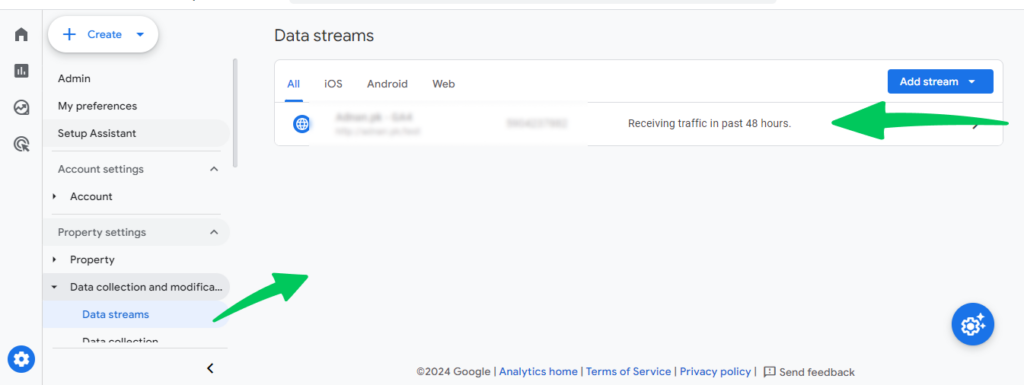
- Go to your GA4 property in Google Analytics.
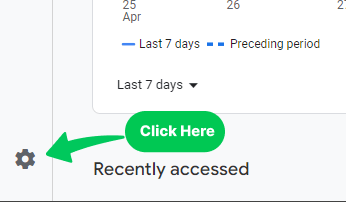
- Click on Admin (gear icon) in the lower-left corner.
- In the “Property” column, click on “Data Streams.”
- Get the GA4 Tracking Code:
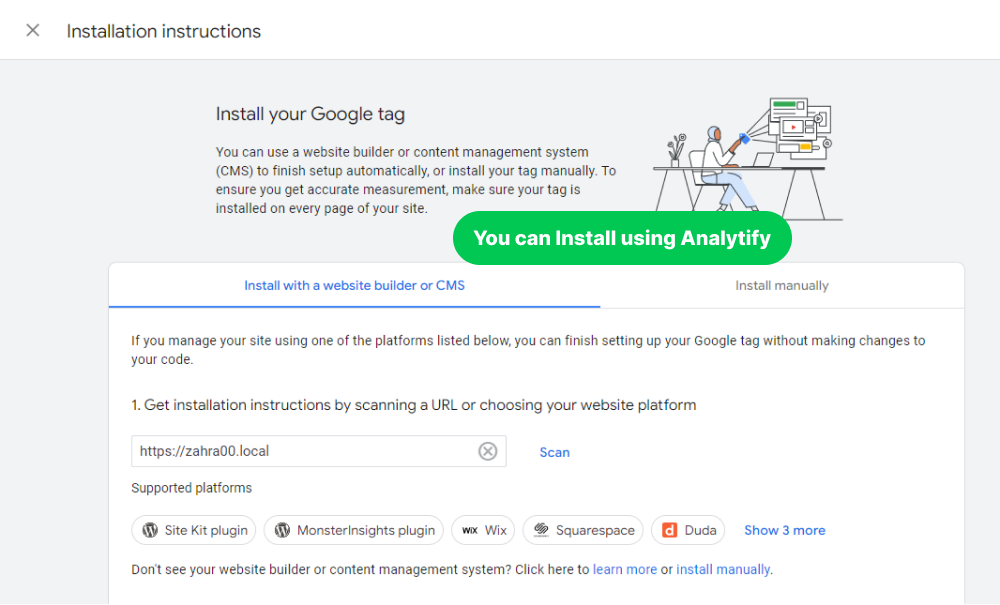
- Select the relevant data stream (Web, iOS, or Android).
- Copy the tracking code snippet provided under the “Tagging Instructions” section.
Use Analytify to avoid tracking code issues. Analytify will automatically handle it.
However, if you have implemented the tracking code manually, you would need to verify, if it’s implemented right or not. Read our complete guide on How to Add Google Tags Manually.
Locate Your Website’s Source Code:
Open the HTML source code of your website or the template file where the tracking code is implemented.
Verify the Placement:
The GA4 tracking code should be placed in the <head> section of your HTML document.
Double-check your GA4 tag setups in Google Tag Manager or your website’s HTML to ensure they’re implemented correctly.
2. Debug Mode Not Enabled
Enabling Debug Mode in Google Analytics 4 (GA4) is essential for viewing real-time data in DebugView. If Debug Mode is not enabled, you won’t see any data in DebugView.
Here’s how to ensure Debug Mode is enabled and functioning correctly.
- No data appearing in GA4 DebugView.
- Unable to troubleshoot and validate analytics setup in real-time.
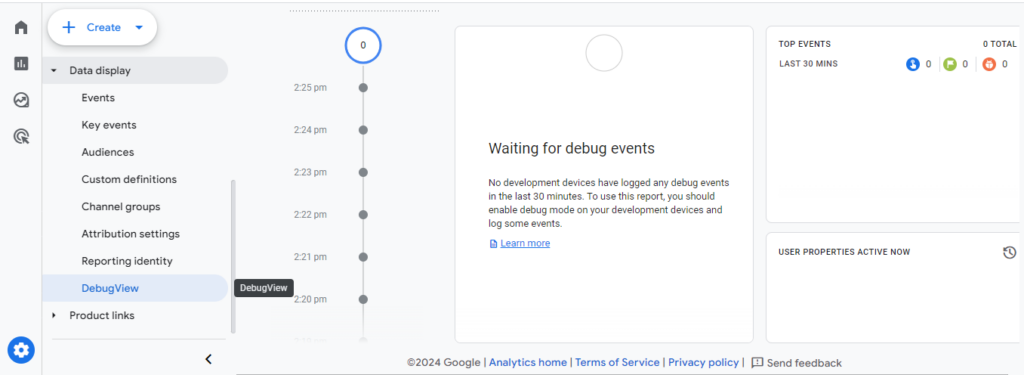
- You will see the below note while clicking on GA4 DebugView.
How to Enable DebugView
There are 3 ways to Enable DebugView.
- Using GA Debugger Chrome Extension
- Enabling DebugView in GA4 Using GTM Preview and Debug Mode
- Using Google Tag Assistant to Enable GA4 DebugView
Read our complete guide on How to Enable GA4 DebugView.
3. Browser Issues (Including Cache & Cookies)
Sometimes, the debug view not showing anything can be due to browser issues, such as outdated versions or incompatible extensions.
Factors such as browser settings, extensions, and compatibility can prevent data from being collected or displayed correctly.
Here’s how to troubleshoot and fix issues related to browser settings affecting GA4 DebugView:
- Clear Browser Cache and Cookies:
- Clear Cache:
- Clear your browser’s cache and cookies to remove any stored data that might interfere with tracking.
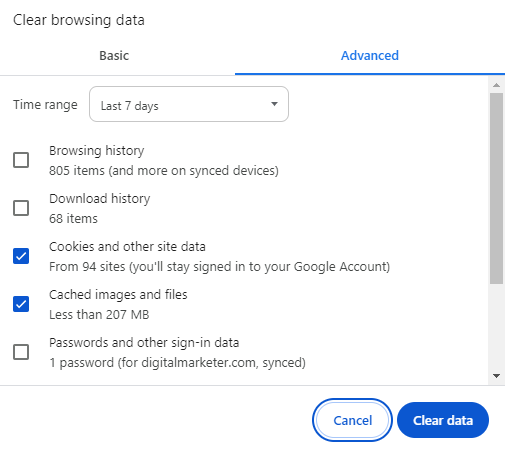
- In Chrome: Go to Settings>>Privacy and security>>Clear browsing data.
- Select “Cookies and other site data” and “Cached images and files,” then click Clear data.
- Clear Cache:
- Use Incognito Mode:
- Open Incognito Window:
- Open an incognito or private browsing window to avoid potential conflicts with cached data and extensions.
- In Chrome: Click on the three-dot menu in the top-right corner and select “New Incognito Window.”
- Open Incognito Window:
- Verify Browser Compatibility:
- Check Supported Browsers:
- Ensure that you are using a browser supported by GA4 (e.g., Chrome, Firefox, Safari).
- Update your browser to the latest version to avoid compatibility issues.
- Check Supported Browsers:
4. Filters Blocking Data
You have enabled DebugView, but you still cannot find data in it. Don’t worry.
This is because Filters in GA4 or your browser can prevent certain data from appearing in DebugView, making it seem like your debug view is not showing anything.
Sometimes, filters blocking the data can be a reason behind GA4 Debug View Not Working.
How to Fix it?
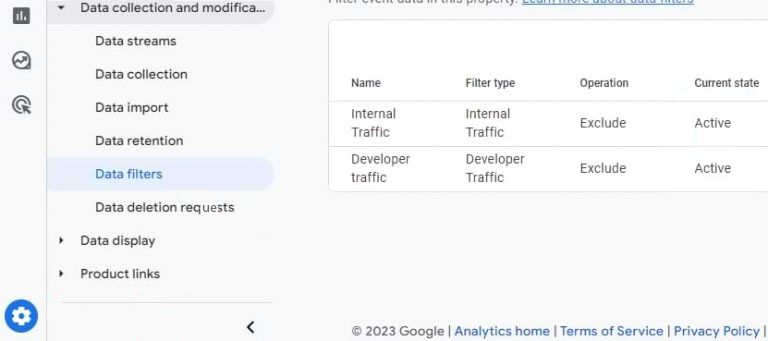
Check GA4 Filters: Start by examining any filters you have set up in Google Analytics 4. Ensure that these filters do not exclude data from specific IPs, geographies, or environments that you are using for testing. If necessary, adjust these filters temporarily or create a new view without them for debugging purposes.
In your GA4 account, navigate to Admin >> Data Settings >> Filters, and check which filters are active.
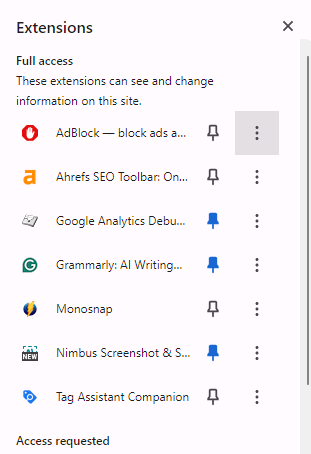
Browser Configuration: Additionally, browser settings or extensions can act as filters. For example, some privacy-focused extensions may block scripts or cookies that are essential for sending data to GA4. Ensure that your browser allows data to be sent to Google Analytics by checking the privacy settings and disabling any extensions that might interfere with this process.
Network-Level Blocking: Sometimes, corporate networks or firewalls can filter out tracking data sent to analytics platforms. If you suspect this might be the case, try accessing DebugView from a different network or consult with your IT department to ensure that analytics tracking is permitted through the network.
This is how you can fix if GA4 debug mode not working.
5. No Active Users
One of the most common reasons GA4 Debug View not showing anything is that there are no active users. This can be caused by various factors, such as incorrect tracking implementation, lack of user activity, or other configuration issues.
You’ll face:
- No active users appearing in GA4 DebugView.
- Inability to see real-time data for user activity.
Here’s how to troubleshoot and fix issues related to having no active users in GA4 DebugView:
- Open your website in a new browser tab or window.
- Navigate through different pages to generate user activity.
- Open an incognito or private browsing window and visit your website to rule out issues with cached data.
- Then, look for user activity and events appearing in real-time.
6. Ad Blockers
Sometime, ad blockers can be a reason behind GA4 debug view not working. Ad blockers and certain browser extensions can interfere with GA4’s proper functioning. They prevent data from being collected and displayed in DebugView.
Here’s how to troubleshoot and fix issues related to ad blockers and browser extensions:
How to Fix Ad Blocker Issue
- Identify the Interfering Extension:
- Disable Ad Blockers:
- Temporarily disable any ad blockers (e.g., AdBlock Plus, uBlock Origin) you have installed in your browser.
- Disable Ad Blockers:
- Disable Other Extensions:
- Disable other browser extensions that might interfere with GA4, such as privacy-focused extensions (e.g., Ghostery, Privacy Badger).
- Restart Browser:
- Restart your browser after disabling the extensions to ensure changes take effect.
- Test DebugView:
- Navigate to GA4 DebugView and check if data is now appearing.
7. Data Layer Issues
The data layer serves as a critical foundation for tracking and analytics on many websites, especially those utilizing Google Tag Manager alongside GA4. Issues within the data layer, such as incorrect formatting, missing values, or timing issues in event triggers, can lead to GA4 Debug View Not Working properly.
How to Fix Data Layer Issues?
Verify Data Layer Setup: First, ensure that your data layer is correctly implemented on your site. It should be initialized before any tags are fired. This setup is important for ensuring that all necessary data is available when events are triggered.
Check Event Triggering: Make sure that events are being pushed to the data layer at the correct times. If events are pushed too early (before the data layer is ready) or too late (after the relevant tags have fired), it can prevent the proper tracking of those events in GA4.
Consistency in Data Structure: Consistency is key in the naming and structure of variables within the data layer. Inconsistencies can lead to mismatches in your GA4 configuration, which can stop data from appearing in DebugView. Ensure that the structure of the data pushed to the data layer matches what your GA4 tags expect to receive.
Debugging the Data Layer: Use tools like the browser’s developer console to inspect the data layer and monitor what data is being pushed and when. This practice can help identify issues related to timing or missing data. Additionally, Google Tag Manager’s Preview mode allows you to see in real-time how tags interact with the data layer and whether they fire correctly.
Validate with Tag Manager: If you’re using Google Tag Manager, make sure that your tags, triggers, and variables are configured to correctly interact with the data layer. Any misconfiguration here can lead to errors in data reporting.
8. Network Issues
Network issues can also be a possible reason behind GA4 debug view not working.
Network problems can interrupt the communication between your site and GA4 servers. Check your network settings, use network debugging tools to trace where the data transmission fails, and ensure your server is properly configured to allow data transfer to GA4.
How to Fix Network Issues?
- Check Internet Connectivity:
- Ensure that the device used to monitor GA4 has a stable internet connection. Perform a speed test to check for adequate bandwidth.
- Check Firewall and Security Settings:
- Ensure that firewalls, both on the network and device levels, are not blocking outgoing connections to GA4 domains.
- Temporarily disable these firewalls to test if they are the cause of the issue, and adjust settings accordingly.
- Disable VPNs or Proxy Servers:
- If you’re using a VPN or proxy, it might interfere with the routing of data to GA4. Disable these services and try accessing GA4 directly to see if the problem persists.
- Switch Networks:
- If possible, switch to a different network (e.g., from Wi-Fi to a wired connection or to a mobile network) to determine if the issue is related to a specific network.
9. GA4 Property Settings
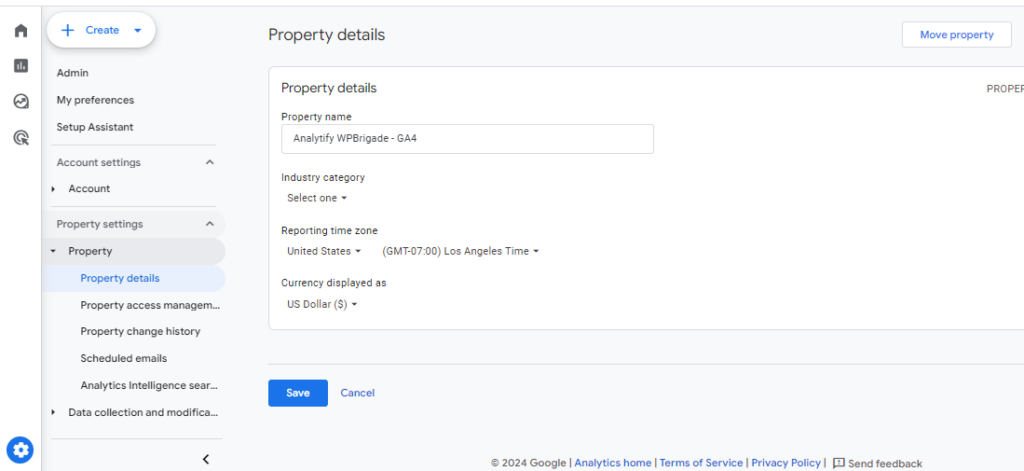
Incorrect property settings in GA4 can sometimes lead to data not appearing in DebugView. Review your GA4 property configuration, ensure that the correct data stream is selected, and that there are no restrictions limiting data flow.
How to Access and Modify GA4 Property Settings:
- Access GA4 Property Settings:
- Sign in to your Google Analytics account.
- Navigate to the property you wish to configure.
- Click on the Admin gear icon at the lower left corner of the GA4 interface to access the Admin panel.
- Navigate to Property Settings:
- In the “Property” column of the Admin panel, you will find various settings including “Property Settings,” “Data Streams,” “Data Settings,” and others.
- Click on “Property Settings” to open the configuration options for the selected property.
- Modify Property Settings:
- Reporting Time Zone: Set the time zone that will affect how your reports display data based on time and date. It’s crucial for accurate data reporting, especially for time-sensitive data like sessions and events.
- Currency: Choose the currency for monetary values in your reports. This should align with the primary currency used in your transactions to avoid conversion discrepancies.
- Data Retention: Configure how long your user and event data are stored before being automatically deleted.
- User Management: Here, you can manage who has access to the property and what level of access they have, from basic viewer permissions to full administrative rights.
- Additional Settings:
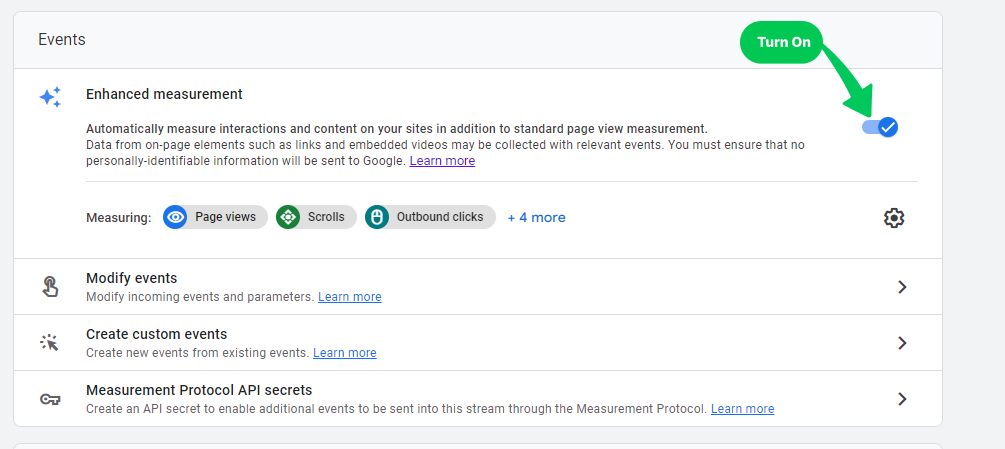
- Enhanced Measurement: Toggle and configure settings for automatic measurement of certain types of interactions, such as scrolls, outbound clicks, site search, video engagement, and file downloads.
- Test Configuration:
- After adjusting settings, it’s wise to test the configuration to ensure that data flows as expected. Use the Real-Time report and DebugView to verify that events and data are being captured according to the new settings.
10. User Permissions
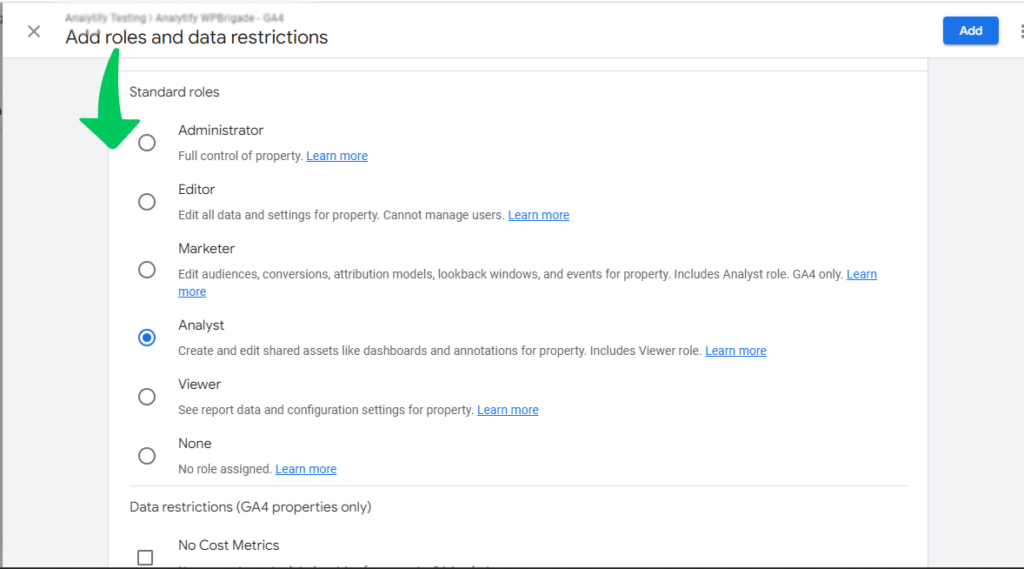
User permissions in the GA4 property can prevent users from accessing DebugView.
Check that your user account has the necessary permissions (Editor or higher) to access DebugView features.
Below are the Key Permission Levels in GA4 Account:
- Viewer: Can view reports and configuration settings but cannot make changes.
- Editor: Has rights to create, edit, and delete data streams, events, and other configurations.
- Administrator: Full access, including managing users, settings, and all data and configuration modifications.
How to Manage User Permissions:
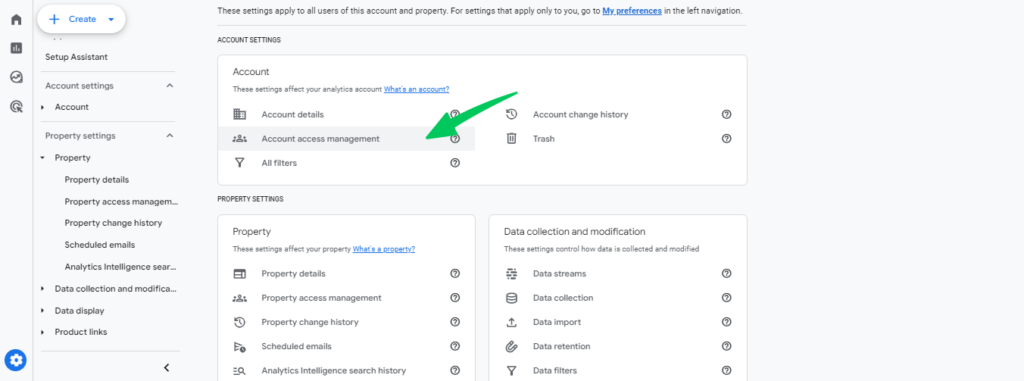
- Access User Management:
- Sign in to your Google Analytics account.
- Navigate to the Admin section at the lower left of your dashboard.
- Under the “Account” or “Property” column (depending on how broadly you want to apply permissions), click on “Access Management.”
- Add or Remove Users:
- Click on “+ Add users” to invite new users to the property. Enter their email addresses and select the appropriate permissions.
- To remove users or change permissions, click on the user’s email in the list and adjust their permissions or remove them from the property.
If you’re not the administrator of a GA4 account or property, you can ask the administrator to grant you a role to see the reports.
11. Event Naming Issues
Incorrectly named events or parameters can be reasons behind GA4 Debug View not working.
It causes data not to appear in DebugView as expected.
Ensure that all events and parameters are named correctly according to Google Analytics’ naming conventions.
Below are the Common Problems of Events in GA4:
- Inconsistent Naming: Using different naming conventions across events can confuse users and complicate analysis.
- Non-descriptive Names: Event names that do not clearly describe the action or the context of the interaction.
- Duplicate Names for Different Events: Using the same name for different actions leads to misleading data aggregation.
- Typos and Errors: Simple spelling mistakes can create multiple entries for what should be a single event type.
Read our complete guide on GA4 Custom Events to properly set the events.
How to Fix Events Issues in GA4 for Proper DebugView?
- Establish a Naming Convention:
- Develop a consistent naming convention for events across your website or app. This should be documented and accessible to everyone involved in event tracking.
- Common practices include using underscores or dashes to separate words (e.g., video_start or add-to-cart), using consistent case formatting (e.g., all lowercase), and including clear identifiers that describe the action and context (e.g., signup_form_submit).
- Audit Existing Events:
- Conduct a thorough review of all existing events in your GA4 property to identify any inconsistencies or errors in naming.
12. Time Zone and Data Latency
If you have verified GA4 debug mode is working fine but Debug view not showing anything. It can be because of time zone issue or data latency.
Discrepancies in time zone settings or data processing latencies can cause GA4 Debug view not working.
Allow some time for data to appear in DebugView and ensure that your GA4 property’s time zone aligns with your local time zone.
DebugView in GA4 can also sometimes exhibit a time lag, causing data to appear delayed. Understanding and addressing time lag issues can help ensure accurate real-time data analysis. Here’s how to deal with DebugView time lag:
- Understand DebugView Limitations:
- Real-Time Data Processing:
- Recognize that there may be a slight delay in processing and displaying data in DebugView.
- Expected Delay:
- Expect a delay of a few seconds to a couple of minutes, depending on server load and data processing.
- Real-Time Data Processing:
- Verify Network Speed:
- Check Internet Connection:
- Ensure that your internet connection is stable and fast to minimize delays.
- Test Connection Speed:
- Use online tools (e.g., Speedtest) to check your connection speed and stability.
- Check Internet Connection:
13. JavaScript Errors
JavaScript errors on your website can prevent the execution of analytics scripts, thus affecting data transmission to GA4.
JavaScript errors can block data collection entirely or cause incomplete/incorrect data being sent to GA4.
Common Causes:
- Syntax Errors: Mistakes in the code, such as typos or incorrect command usage.
- Loading Issues: Problems with the order in which scripts load, potentially causing dependencies to fail.
- Conflicts: JavaScript conflicts between different scripts or libraries, such as jQuery versions conflicting.
- Browser Compatibility: Code that doesn’t work across all browsers, affecting users on unsupported versions.
How to Fix?
- Identify JavaScript Errors:
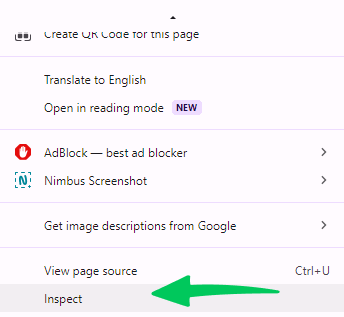
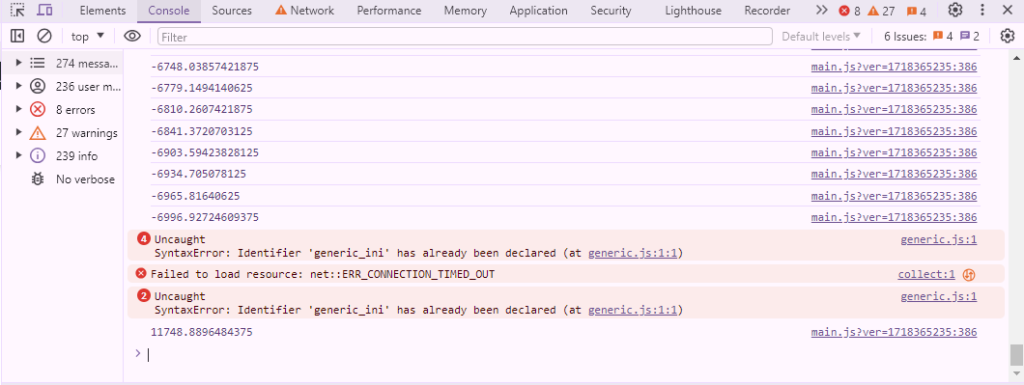
- Open your web browser’s Developer Tools (typically accessed with F12 or right-click > “Inspect”).
- Navigate to the “Console” tab to view JavaScript errors as they occur.
- Look for errors related to the GA4 tracking script or related integration scripts.
You can contact your web developer for any issues to ensure that GA4 scripts run smoothly.
14. Firebase Integration Issues
For those using GA4 through Firebase, issues with the integration can lead to GA4 debug mode not working.
Verify that your Firebase and GA4 accounts are properly linked and that the data streams are correctly configured.
Verify Integration: First, ensure that your Firebase project is correctly linked to your GA4 property. You can check this in the Firebase console under Project Settings. Make sure that the GA4 property ID listed matches the one you are trying to debug.
Check Data Streams: In GA4, navigate to the Admin section and verify your data streams. Each app or web stream from Firebase should be properly set up here. If any streams are missing or misconfigured, you’ll need to address these issues to ensure data is being sent correctly.
Otherwise, use Analytify for firing tags automatically to reduce such errors.
15. Cookie Consent Issues
Cookie consent issues can also be a problem behind GA4 Debug view not working.
Cookie consent settings on your website can significantly impact the functionality of GA4. If users do not consent to analytics cookies, data might not be collected or sent to GA4, resulting in no data appearing in DebugView. Here’s how to address cookie consent issues:
- Review Cookie Consent Settings:
- Understand Consent Requirements:
- Familiarize yourself with the legal requirements for cookie consent in your region (e.g., GDPR in the EU, CCPA in California).
- Check Consent Management Platform (CMP):
- Ensure that your CMP is correctly configured to allow GA4 cookies when users consent.
- Ensure Clear Options:
- Provide clear options for users to accept or decline analytics cookies.
- Set Default States:
- Set the default state of analytics cookies to ‘disabled’ until the user consents, if required by law.
- Enable Google Consent Mode:
- Use Google’s Consent Mode to adjust how Google tags behave based on user consent.
- Understand Consent Requirements:
Each of these issues comes with a straightforward fix that can help you fix Debug View in Google Analytics 4.
Bonus: Analytify to Fix DebugView Issues for WordPress Users
If you manage your website through WordPress and use Google Analytics 4, you’ve got a fantastic tool to simplify your analytics experience: Analytify. This plugin makes Google Analytics straightforward and accessible right from your WordPress dashboard, enhancing your ability to monitor and react to your website’s data effectively.
Join 50,000+ Beginners & Professionals who use Analytify to Simplify their Google Analytics!
Using Analytify to Diagnose DebugView Issues:
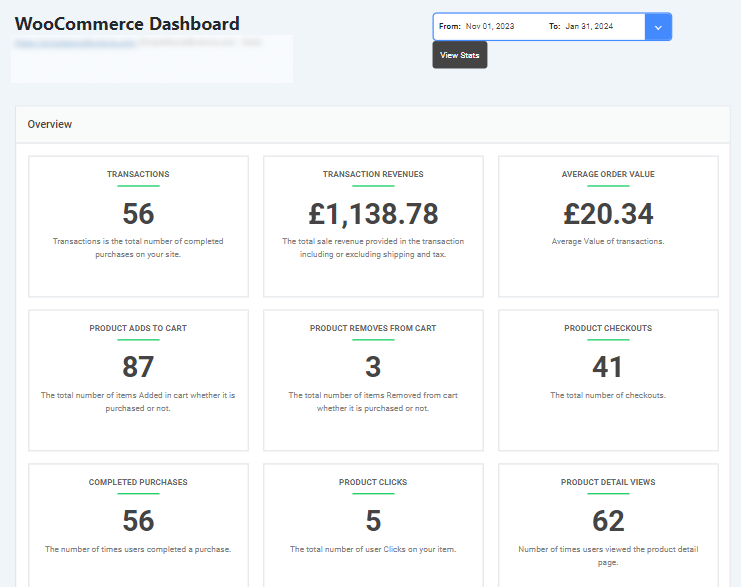
If you’re struggling to fix Google Analytics DebugView, Analytify can help by providing clearer insights into what’s being tracked. This helps in diagnosing and resolving issues related to event tracking, which often impacts DebugView’s functionality.
Integrating Analytify with GA4:
- Why Analytify? It’s not just about easier access; it’s about making sense of your data. With Analytify, you can see detailed reports directly on your WordPress dashboard without diving deep into Google Analytics. Read How to Install Analytify pro.
- Enhanced E-commerce Tracking: Get detailed insights into your e-commerce metrics.
- Custom Post Type Tracking: Track the performance of different post types beyond just posts and pages.
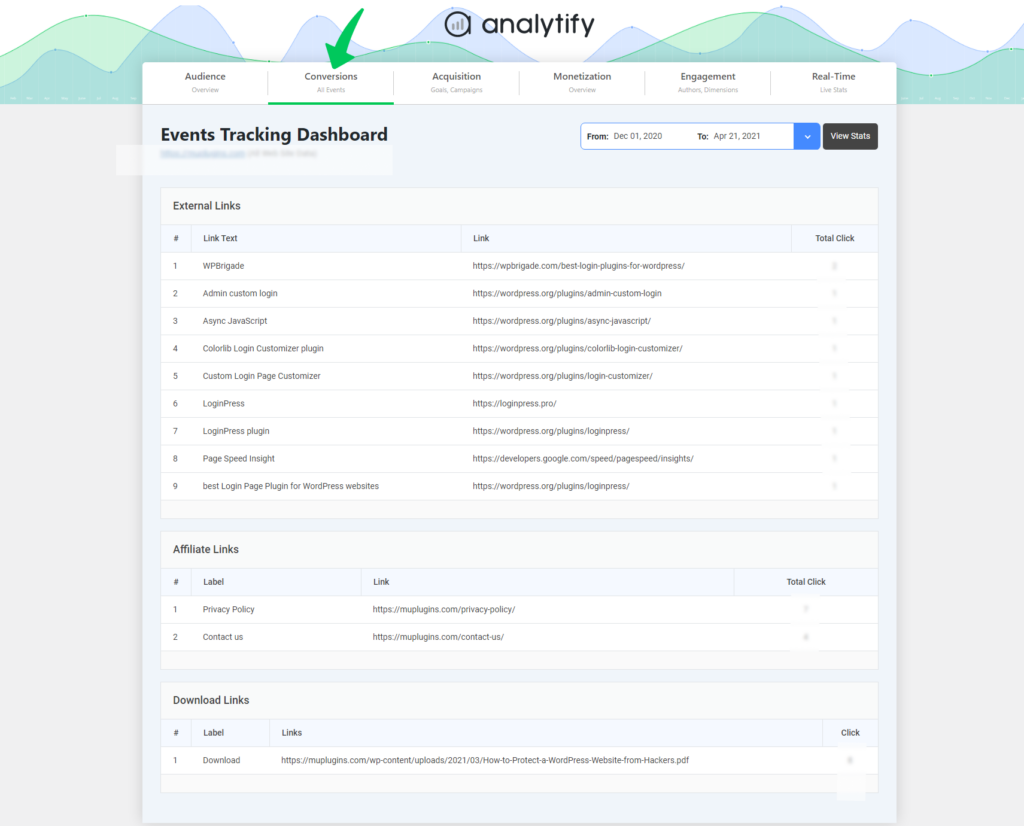
- Event Tracking: It seamlessly integrates with GA4 to track specific user interactions, which is crucial if you’re troubleshooting a debug view that doesn’t show anything.
Analytify not only simplifies your Google Analytics data but also empowers you with the ability to resolve issues related to GA4 debug mode not working more effectively. By integrating this tool, you enhance your ability to manage analytics directly from your WordPress dashboard, making your data work harder for you.
GA4 DebugView Not Working FAQs
1. Why is my GA4 Debug View Not Working even after the correct configuration?
Even with correct configuration, issues like browser cache, outdated SDKs, or network restrictions can affect DebugView. Try clearing your cache, updating your SDKs, and checking your network settings.
2. What should I do if the debug view not showing anything due to ad blockers?
Ad blockers can often block scripts required for Google Analytics. Try disabling ad blockers or configuring them to allow scripts from Google Analytics.
3. How can I ensure my debugview in Google Analytics 4 not working due to browser compatibility?
Use Google Analytics in supported browsers like the latest versions of Chrome, Firefox, or Edge. Avoid older or less common browsers that may not support all GA4 features.
4. Why are events not appearing in DebugView even though my GA4 account seems configured correctly?
This could be due to issues with how events are triggered or recorded. Ensure your events are correctly set up in the Google Tag Manager or directly in the codebase and triggered as expected.
5. How long should I wait to see events in DebugView after making configuration changes?
Events should appear in DebugView almost immediately, but it’s wise to wait a few minutes as there might be slight delays based on server response times and data processing.
6. Can incorrect time zone settings affect my DebugView?
Yes, incorrect time zone settings can create discrepancies in data reporting and visibility in DebugView. Ensure your GA4 settings match your local time settings for accurate data tracking.
GA4 DebugView Not Working: Recap
We’ve covered quite a bit of ground to troubleshoot and resolve the GA4 Debug View Not Working issue. From understanding the basics of DebugView in Google Analytics 4 to the most common problems and their solutions, our goal has been to arm you with the knowledge and tools needed to ensure your analytics are running smoothly.
Key Takeaways:
- Check Configurations: Always start by checking your GA4 and browser configurations. Small settings can have big impacts.
- Browser and Extensions: Ensure your browser is up-to-date and that extensions like ad blockers aren’t interfering with GA4.
- Debug with Tools: For WordPress users, use tools like Analytify to simplify analytics processes and gain more control over data.
We hope this article helped you understand why the GA4 Debug View is not working.
You may also like to read How to Fix Unassigned Traffic in Google Analytics 4.
Now we’d love to hear from you what other challenges you’ve faced with the GA4 DebugView?
Are there any specific analytics issues you’d like us to explore in future posts?
Don’t hesitate to reach out with questions or for more insights.

