
Google Analytics Cohort Analysis: Understanding User Behavior

You might have come across the term “cohort analysis” in a GA4 tutorial and thought it was just for data experts. This guide will explain it in simple terms.
Cohort analysis is a way to study user behavior by grouping people with the same characteristics and tracking how these groups behave over time. You can spot trends such as how many users return, when they stop coming back, and how your marketing or product updates affect them.

QUICK SUMMARY
Cohort analysis in GA4 groups users by a shared characteristic, such as their acquisition date, and tracks their retention and behavior over time to see if they return or drop off.
Where to Find It: Located directly under the “Explore” menu in your GA4 property using the specialized Cohort Exploration template.
The 3 Core Types: Acquisition cohorts (first visit date), Behavioral cohorts (actions taken), and Predictive cohorts (forecasted future behavior).
What You’ll Learn: How to bypass misleading aggregate data, build step-by-step cohort reports, and accurately read retention trends for your site.
Skip the Complex GA4 Dashboards! With Analytify, you can pull your critical GA4 cohort and visitor data directly into your WordPress dashboard, giving you instant, actionable insights without ever leaving your site.
Table of Contents (TOC):
What Is Cohort Analysis and Why Do Businesses Use It?
Cohort analysis helps focus on one specific group of users. It tracks how that group behaves over time, rather than mixing everyone together.
According to GA4 Help Documentation, a cohort is a group of users who share something in common, like the date they first visited your site.
Aggregate metrics can make it hard to spot retention issues. Even if your total sessions or monthly active users look good, you might not notice when users stop returning. A cohort report helps by showing if users who joined in a certain month are still active three months later.
This is known as a leaky bucket problem. You might get a lot of new visitors, but if retention is low, those visitors leave just as quickly.
Sometimes, a spike in traffic can hide this issue. Your overall numbers might look steady or even grow, but new visitors keep slipping away.
This matters for your WordPress site because you might see steady weekly traffic, but if most readers don’t return after their first visit, those numbers can be misleading. Cohort analysis helps you spot this issue early, before it turns into a bigger problem.
What Are the Types of Cohort Analysis?
The three main types are acquisition, behavioral, and predictive cohorts. Acquisition cohorts group users by when they first arrived. Behavioral cohorts group users by actions they took. Predictive cohorts group users based on forecasted behavior.

Type 1: What Is Acquisition Cohort Analysis?
Acquisition cohort analysis groups users by when they first interacted with your site. For example, you might group them by the week they registered, or by the week they made their first purchase.
After that, you track how well each group sticks around over time.
This is the most common cohort type. It’s also GA4’s default. In GA4’s cohort exploration tool, the default inclusion criterion (the condition that adds a user to a cohort) is “First touch,” based on acquisition.

Imagine a scenario of a WooCommerce store. Users who made their first purchase in January are one cohort, while those who made their first purchase in February are another. You can compare their 90-day repeat purchase rates. To track this repeat purchase data in WordPress, use Analytify’s Enhanced eCommerce Tracking with Analytify add-on.
If the January group buys again at twice the rate of the February group, something likely changed, such as a promotion, new product, or price adjustment. It’s worth investigating what made the difference.
Type 2: What Is Behavioral Cohort Analysis?
Behavioral cohort analysis groups users by specific actions rather than by their arrival time. For example, you might group users by whether they made a purchase, used a feature, or downloaded something.
This helps you see which actions are linked to long-term retention.
This type takes things a step further than acquisition cohorts. In GA4’s cohort exploration, you set behavioral criteria using the return criterion.
This is the condition a user must meet to stay in the cohort, such as “Any event,” “Any transaction,” “Any conversion,” or a specific event under “Others.”

For a content site, this looks like comparing two groups. Group one subscribed to your newsletter. Group two visited three or more times but never subscribed.
Compare their 30-day return rates. If subscribers return far more often, that’s a strong signal: the subscribe button is a retention lever.
Type 3: What Is Predictive Cohort Analysis?
Predictive cohort analysis looks at past behavior to predict what users will do next. It can identify users who might leave, convert, or spend more, so you can act before they go.
This is the most advanced type of cohort analysis and usually requires machine learning tools outside of GA4’s standard reports.
For most WordPress site owners, using acquisition and behavioral cohorts in GA4 gives the most useful insights.
What Are Real-World Cohort Analysis Examples?
Cohort analysis delivers different insights depending on business type. Ecommerce stores use it to measure repeat purchase rates. SaaS companies track feature adoption and churn. Content sites measure return visitor retention by acquisition source.
The same method, three very different answers.
Below is a summary of different applications of cohort analysis across business types:
| Business Type | Cohort Setup | Insight Gained (Hypothetical) | Action Taken |
| WooCommerce Store | Acquisition cohort by first purchase month. Metric: transactions. Time: Monthly. | Black Friday buyers had a 40% lower 90-day repeat rate than regular November buyers. | Created a dedicated re-engagement email sequence targeting that cohort specifically. |
| SaaS / Membership Site | Behavioral cohort by users who completed the onboarding tutorial vs. those who skipped it. Metric: active users. Time: Weekly. | Tutorial completers retained at twice the rate by Week 4. | Made tutorial completion as a required step during the onboarding redesign. |
| Content / Blog Site | Acquisition cohort by traffic sources such as organic search vs. social media. Metric: active users. Time: Weekly. | Organic users returned three times the rate of social users by Week 3. | Shifted content budget toward SEO over social promotion. |
Each example above uses a different cohort type. The WooCommerce example uses an acquisition cohort. The membership site uses a behavioral cohort. The blog uses an acquisition cohort filtered by traffic source (the channel that originally brought each user in).

Note: Notice what each outcome has in common. The insight led to a specific action, not a vague plan to “improve retention.” That’s what separates cohort analysis from a standard traffic report.
Now that you’ve seen what cohort data can reveal, here’s why making retention analysis a regular habit pays off across every business type.
What Are the Benefits of Cohort Retention Analysis?
Cohort retention analysis helps you see whether the users you gain during a given period stick around. Looking only at total monthly users won’t show this. Even if your traffic chart looks steady, you might be losing new users faster each time.
Research by Frederick Reichheld of Bain & Company shows that increasing customer retention rates by 5% increases profits by 25% to 95%. This makes solving retention problems almost always worthwhile.
Here are five clear benefits of using cohort retention analysis:
- Find hidden churn: Cohort data shows you the exact week or month when most users stop coming back. For example, on a content site, this could be Week 2. In a WooCommerce store, it might be 60 days after the first purchase. You can’t fix a drop-off if you don’t know where it is.
- Measure the quality of your campaigns: Two campaigns might each bring in 5,000 new visitors, but cohort analysis reveals which campaign brought back repeat users. Clicks and sessions show reach, while cohort retention shows quality.
- Test if your product or content changes work: Compare cohorts from before and after a site redesign, a new onboarding process, or a change in content format. If the new cohort stays longer by Week 4, your change was successful. If not, you know before investing more.
- Increase customer lifetime value (CLV): Look for cohorts that spend more than 90 days. Then figure out what was different about how those users found you, what they saw first, or what they did early on. Try to repeat those conditions.
- Make smarter marketing budget choices: If users from organic search stick around three times longer than those from social media, shifting your budget from social to SEO pays off more over time. Cohort data backs up these decisions with real numbers, not guesses.
The benefits above apply only if you can clearly read your cohort data and act on it quickly. That’s where the tool you use matters, and the next section covers exactly that.
How Do You Perform Cohort Analysis in Google Analytics 4?
To run cohort analysis in GA4, open Explore in the left navigation, select the Cohort exploration template from the Template Gallery, then configure the inclusion criterion, return criterion, and granularity for your specific question.
Here is the detailed step-by-step:
Step 1: Create a Cohort Exploration in GA4
Then, click to open the Explorations home screen, which is different from the standard Reports section.

Next, from the Template Gallery on the right side of the Explore home screen, select Cohort Exploration. Scroll through the list of templates and choose Cohort exploration.
Step 2: Set the Inclusion Criterion

The inclusion criterion decides which users are added to a cohort.
For an acquisition cohort, you start off by picking First touch (acquisition date), which is GA4’s default and a good starting point for WordPress site owners.

For a behavioral cohort, select Any event or choose a specific event under Others, like a form submission or newsletter sign-up.

Step 3: Set the Return Criterion
If you have a WooCommerce store and want to track repeat purchases, choose Any transaction.

Step 4: Set Granularity to Daily, Weekly, or Monthly
Granularity sets the time intervals GA4 uses to group cohorts and track returns. Weekly granularity is good for most WordPress sites.
Use daily for high-traffic news or ecommerce sites, and monthly for membership sites with longer user cycles.

Step 5: Set the Date Range
GA4 defaults to the last 28 days. For a clearer retention picture, extend this to 90 days or longer.
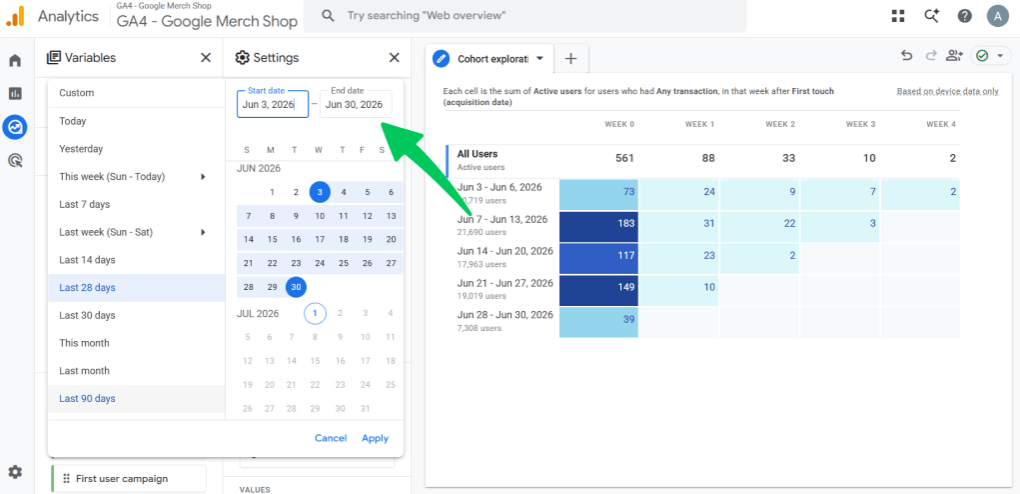
Note: GA4’s default data retention window is two months unless you extend it in your property settings. If your retention window is too short, older cohorts will show incomplete data.
Step 6: Read and Analyze the Retention Table
Pay attention to cohorts that keep a higher percentage further along the row, as these are your best-retained groups.
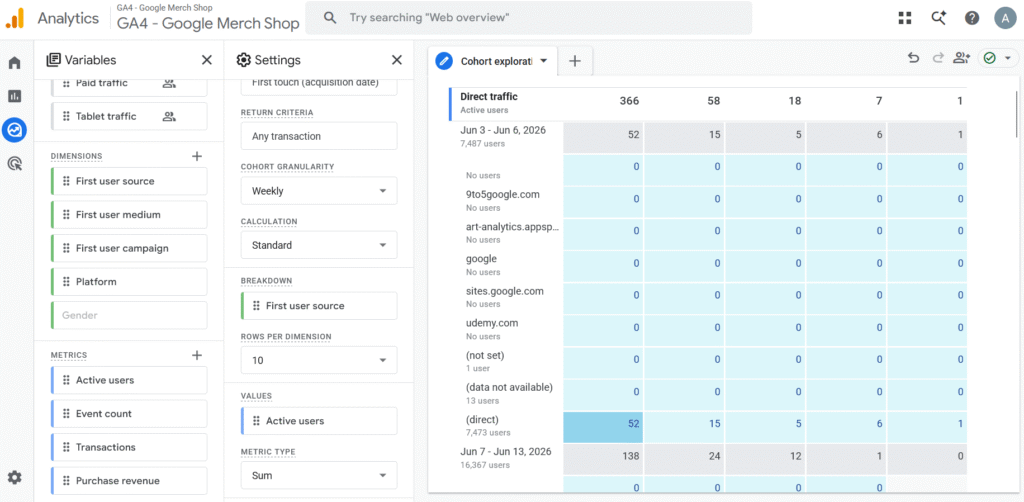
For the full official reference on GA4 Cohort exploration, see Google’s Cohort exploration documentation.
What Are the Limitations of GA4 Cohort Exploration?
GA4’s cohort exploration has three key limitations worth knowing. Cohorts are based on device data only, meaning User-ID is not factored in.
The report caps the cohort rows at 60. When you apply a breakdown dimension, only the top 15 values of that dimension appear.
None of these limitations prevent a WordPress site owner from getting useful retention data. They do mean that very large sites with cross-device user journeys may see incomplete cohort pictures inside GA4’s native tool.
How Does Analytify Help You Monitor User Behavior in WordPress?
Analytify puts GA4 user engagement and session data right in your WordPress dashboard. You can keep an eye on returning user trends and traffic sources without logging into GA4 each time.
Here’s how the two tools work together:
Create cohort reports in GA4 Explore. GA4 does the heavy lifting, while Analytify acts as your daily monitor.
It highlights key behavioral signals such as returning user rates, session trends, and channel performance, all within your WordPress admin panel.
For example, if your GA4 cohort report shows that organic search users stay three times longer than social visitors by Week 3, you don’t have to open GA4 every morning to track that trend.
Analytify displays your returning user rates and source breakdown right in WordPress, so you can spot changes as they happen.
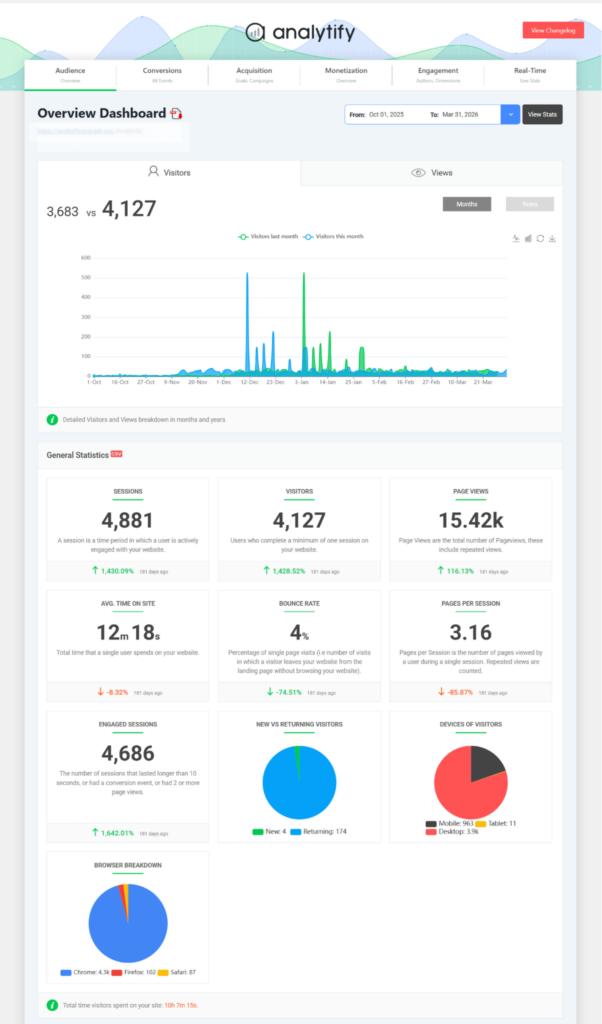
Look at how Analytify shows GA4 data in WordPress.
One important note on accuracy: Analytify does not replicate GA4’s Cohort Exploration report in WordPress. It presents your GA4 session and user data, including returning visitor rates and traffic source breakdowns, in a cleaner, more accessible format inside your admin panel. For full cohort configuration, you still use GA4 Explore.
Note: Analytify only handles the daily monitoring layer and showcasing your data stream from GA4 right inside the WordPress dashboard.
Frequently Asked Questions
1. What is cohort analysis in Google Analytics?
Cohort analysis in Google Analytics 4 is a built-in Explore report that groups users by a shared characteristic, most commonly their acquisition date, and tracks how that group behaves over time. You access it via Explore >> Template Gallery >> Cohort exploration. It shows retention percentages across daily, weekly, or monthly intervals, helping you identify when users stop returning to your site.
2. How do I perform a cohort analysis in GA4?
To run a cohort analysis in GA4, go to Explore in the left navigation, open Template Gallery, and select Cohort exploration. Set your Inclusion criterion (such as first touch or a specific event), your Return criterion (such as any event or any transaction), and your granularity (daily, weekly, or monthly). The resulting table shows each cohort’s retention rate across the selected time periods.
3. What is the difference between cohort analysis and segment analysis?
A segment is a static filter applied to all data across any time, such as mobile users. A cohort is a dynamic group defined by a shared starting point in time and tracked forward from that point. Cohort analysis shows how behavior changes over time after a specific event; segment analysis shows a snapshot of users who share a current characteristic.
4. What is acquisition cohort analysis?
Acquisition cohort analysis groups users by when they first arrived at your site; their acquisition data and date track their engagement or purchase behavior in the weeks or months after. This is the most common cohort type and the default in GA4’s cohort exploration report. It answers questions like: ‘Are users acquired in March returning more than users from February?’
5. What are the benefits of cohort analysis?
Cohort analysis reveals user retention trends, identifies when most users churn, compares the long-term value of users from different acquisition sources, and measures the impact of product or marketing changes on specific user groups. It converts aggregate metrics into behavior trajectories, making it possible to act on the root causes of retention problems rather than their symptoms.
How Should You Get Started with Cohort Analysis?
Cohort analysis helps you avoid making decisions based only on overall numbers. For example, if your January cohort keeps users twice the rate of your March cohort, you can move from guessing to finding real answers. Your three next steps:
- Open GA4, go to Explore, click on Template Gallery, and choose Cohort exploration. Follow the steps in this guide to run your first acquisition cohort report.
- Look for a cohort that keeps users much better or worse than the others. Check out what might have changed during that time, such as a campaign, a product update, or new content.
- Install Analytify to track your returning user rate and traffic sources right inside WordPress, so you don’t have to log into GA4 every day.
Use Analytify to view your GA4 user data directly in WordPress.
Check out more information on GA4 reports here:
- How to Read GA4 Traffic Reports in WordPress
- How to Identify and Manage GA4 Data Thresholding in Your Reports
- 5 Best Content Marketing Analytics Reports in GA4
Which metric on your WordPress site do you think will reveal the most surprising trends once you track your first visitor cohort? Let us know in the comments below!