How to Use GA4 Path Exploration Report (2025)
Are you curious about how users navigate your website? The GA4 Path Exploration report provides a powerful way to visualize and track user journeys. This feature offers an understanding of the sequence of actions users take, from initial entry to key events.
In this article, we’ll explore an overview of Google Analytics path exploration, how it works, and how to create and use forward and reverse path exploration reports.
Let’s get started to learn about GA4 path analysis!
GA4 Path Exploration (TOC):
What is Path Exploration in GA4?
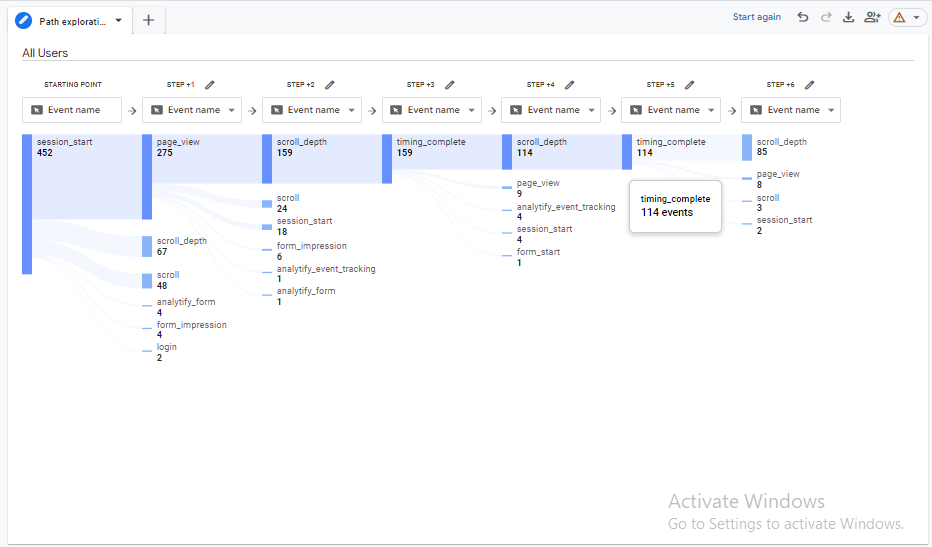
GA4 Path Exploration is a powerful feature that allows you to track and visualize users’ steps on your website or app. It maps out the sequence of interactions, from the user’s entry point to conversions, exits, or any key event.
The Path Exploration Report in Google Analytics provides a detailed understanding of user behavior. It helps you identify how users navigate your site, which pages they visit, and where they might drop off. It offers a flexible way to analyze user paths through interactive flow diagrams.
With Google Analytics Path Exploration, you can analyze various paths users follow, uncover patterns, and optimize their journey for better engagement and conversions. It is particularly useful for understanding complex user flows and improving site structure based on how visitors interact with your content.
How does Google Analytics Path Exploration Work?
A Path Exploration report in GA4 has four main components. Let’s understand how this feature works.
- Starting and Ending Point:
The starting point is the page or event that kicks off the user journey, while the ending point is where it concludes. Your report can either focus on a starting point or an ending point, but not both at the same time. - Steps:
Steps represent the actions users take either before the ending point or after the starting point. A Path Exploration report displays these steps as columns in a tree-like graph, showing how users navigate through your site or app. - Nodes:
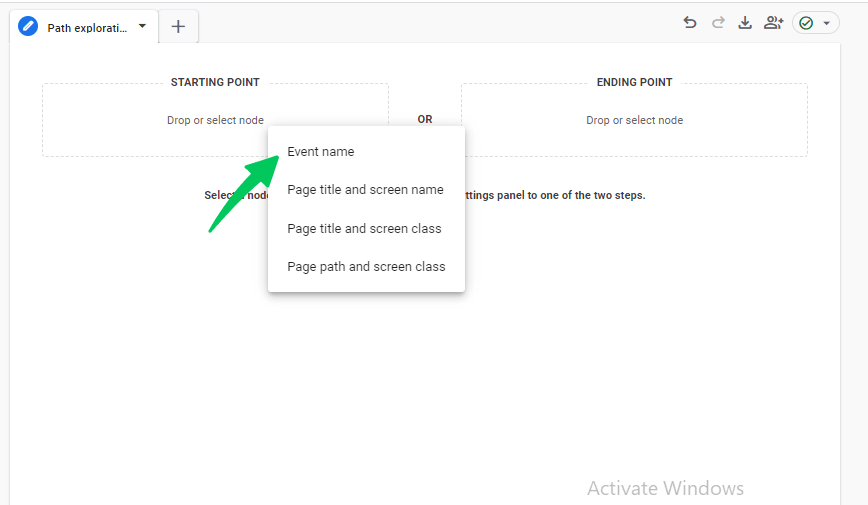
Nodes are the specific data points for each step in the user journey. GA4 offers four types of nodes: event name, page title and screen name, page title and screen class, and page path and screen class. When you select the event name, the nodes show how many events were triggered by users. For the other three options, the nodes represent the number of users who performed actions on those pages or screens. - Path:
A path is the sequence of nodes that appears across different steps in the report. It helps visualize the events triggered and pages viewed before or after the selected starting or ending point, giving you a clearer picture of the user journey.
Overview of GA4 Path Exploration Interface
The GA4 Path Exploration interface provides a dynamic and powerful way to visualize user journeys through your website. Path Exploration lets you learn how users move from one event or page to another.
This tool is particularly valuable for tracking the sequence of user actions, helping you understand the pathways users take toward conversions or drop-offs. By learning this, you can optimize user flow and improve engagement strategies.
This section will explore the Path Analysis Report in Google Analytics interface, emphasizing its features and functionality. To get started, log in to your Google Analytics 4 property, navigate to the left sidebar, click Explore, and then select Path Exploration.
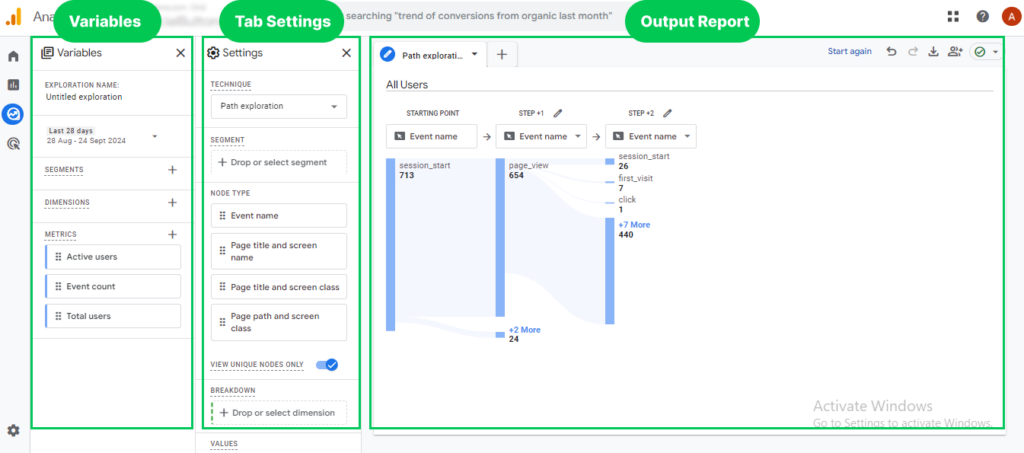
The interface is divided into three main sections:
- Variables
- Tab Settings
- Output (Report/Visualization)
1. Variables
The Variables section allows you to select the data you want to use in your report. Here, you can adjust:
- Date Range: Click on the date in the top-left corner to select your desired date range (e.g., “last 7 days” or “last 30 days”).
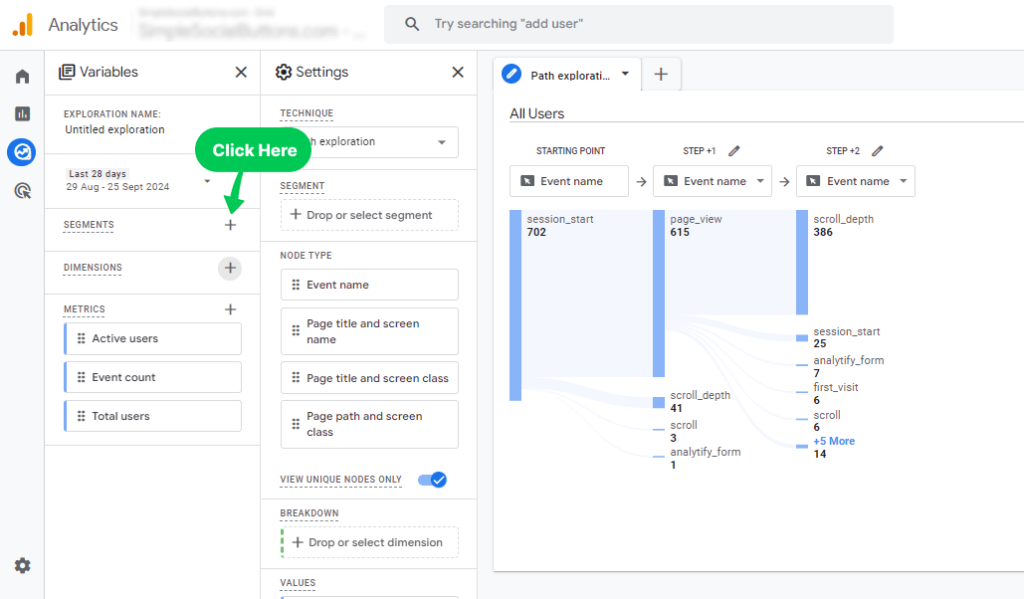
- Segments: Analyze different user groups by selecting existing segments or creating custom ones by clicking the plus icon. There are three types of segments you can create:
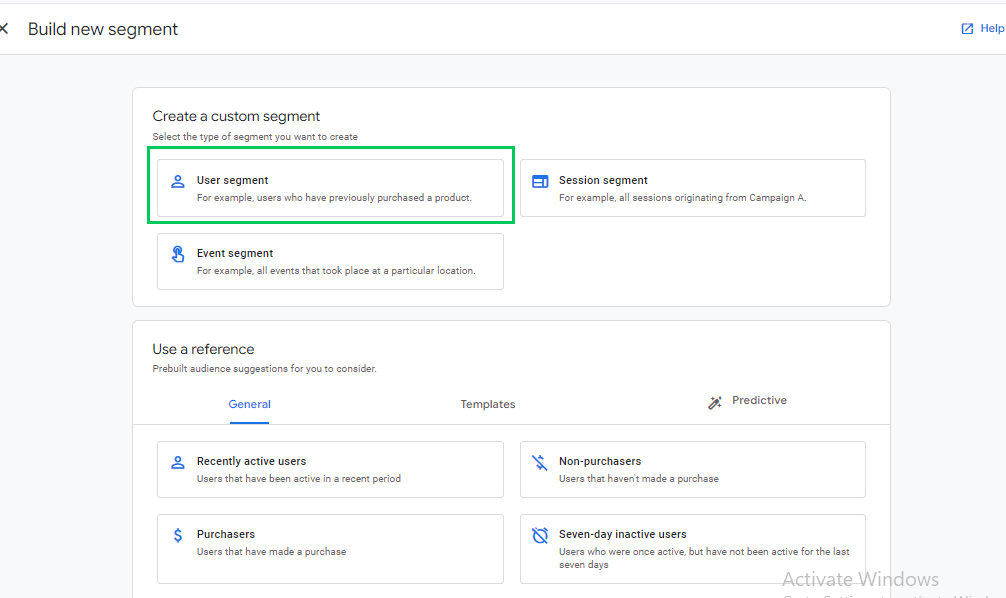
- User Segment: Captures all users meeting specific criteria (e.g., users from the US).
- Session Segment: Captures sessions meeting certain criteria (e.g., sessions where a specific event occurred).
- Event Segment: Focuses on specific events (e.g., only page_view events).
- Dimensions and Metrics: Dimensions describe attributes (e.g., Event name, User’s pricing plan), while metrics measure values (e.g., Event count, Engagement rate). For Path Exploration, you can only use three metrics: Active users, Event count, and Total users. Ensure any metric or dimension you want to use is included in this section first.
2. Tab Settings
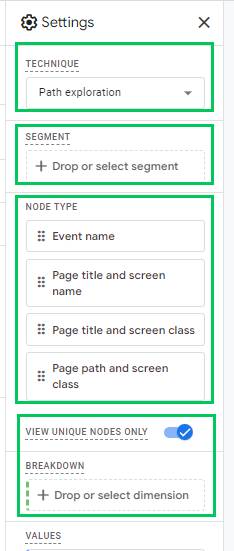
In the Tab Settings section, you can configure how your report looks. Key features include:
- Technique: Choose the type of analysis (Path Exploration in this case).
- Segment: Add a segment to analyze a subset of your data.
- Node Type: This shows the nodes you can use, including the Event name and Page title.
- View Unique Nodes Only: Toggle this option to see unique nodes in your visualization or all occurrences.
- Breakdown: Add dimensions for further analysis (e.g., Device category) to compare user behavior.
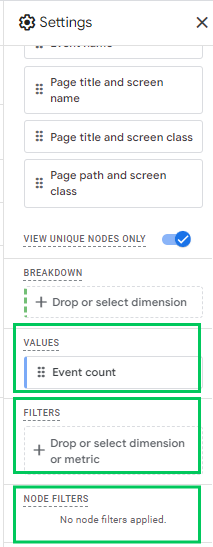
- Values: Choose which metric to display in the path exploration visualization (Active users, Event count, Total users).
- Filters: Add filters to narrow your data analysis. However, if you encounter issues with filters, creating an Event segment might be more effective.
- Node Filters: Exclude specific nodes from your visualization by right-clicking the node and selecting the exclusion option.
3. Output (Report)
Once the Variables and Tab Settings are configured, the Output section will display the path exploration visualization. Here are some key functionalities:
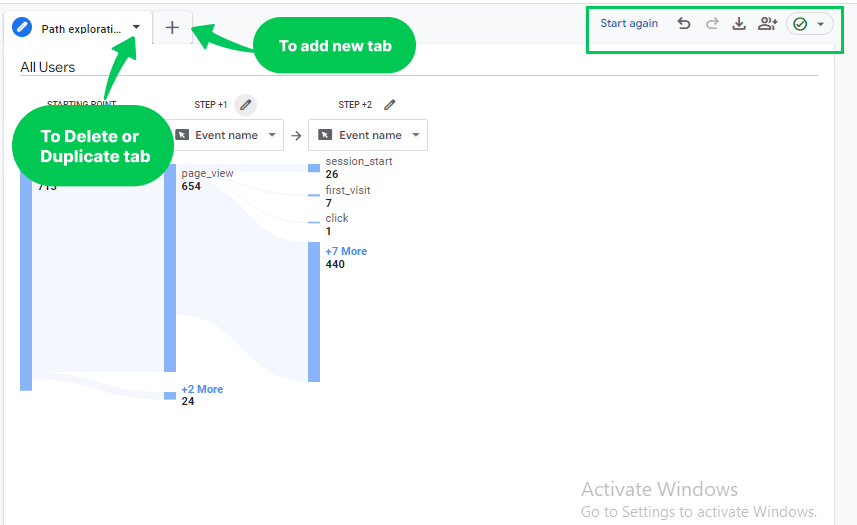
- Add, delete, and duplicate Tabs: Create multiple tabs with different exploration techniques. You can also delete or duplicate a tab.
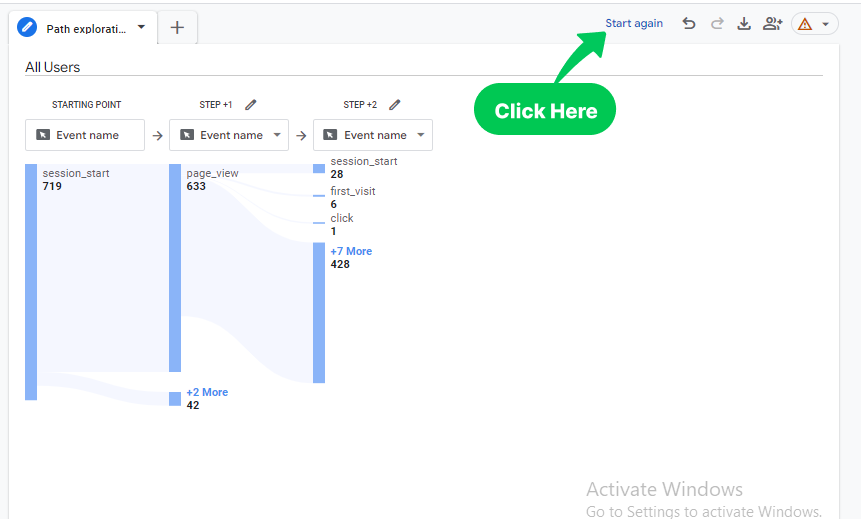
- Changing Starting Points and other options: To change the starting point, click Start Over. This will reset the visualization while keeping your settings intact. You can redo, undo, download, and share the report.
How to Create Path Exploration Reports in Google Analytics 4?
Creating Path Exploration reports in GA4 involves tracking user navigation through your site or app, helping you analyze the user journey from specific starting or ending points. GA4 provides two key types of Path Exploration reports:
- Forward-Path Exploration
- Reverse-Path Exploration
Both serve to visualize user flows from different perspectives. Below, we will guide you through the steps to create each type of report.
Forward-Path Exploration Report
The Forward-Path Exploration report in GA4 helps you examine the sequential steps users take after interacting with a particular event, page, or screen. This report is ideal for understanding where users go next in their journey, especially after engaging with key points like a homepage, landing page, or product page.
Let’s walk through how to create a forward path Exploration report step by step:
- Log in to your Google Analytics 4 account and choose the desired property.
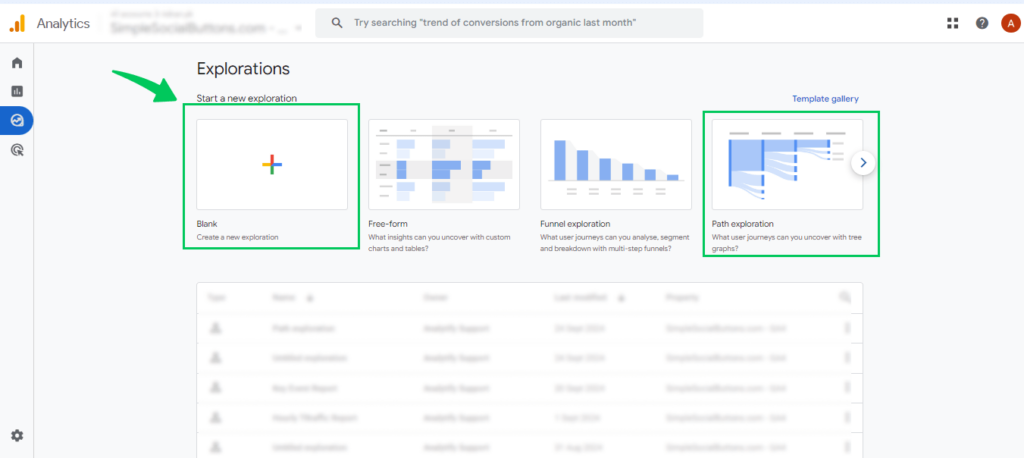
- Find the “Explore” tab on the left sidebar and click on it.
- You can choose a prebuilt Path Exploration template from the available templates in the Explore section or start with a blank one. We’ll choose the Blank canvas to create a new Path Exploration.
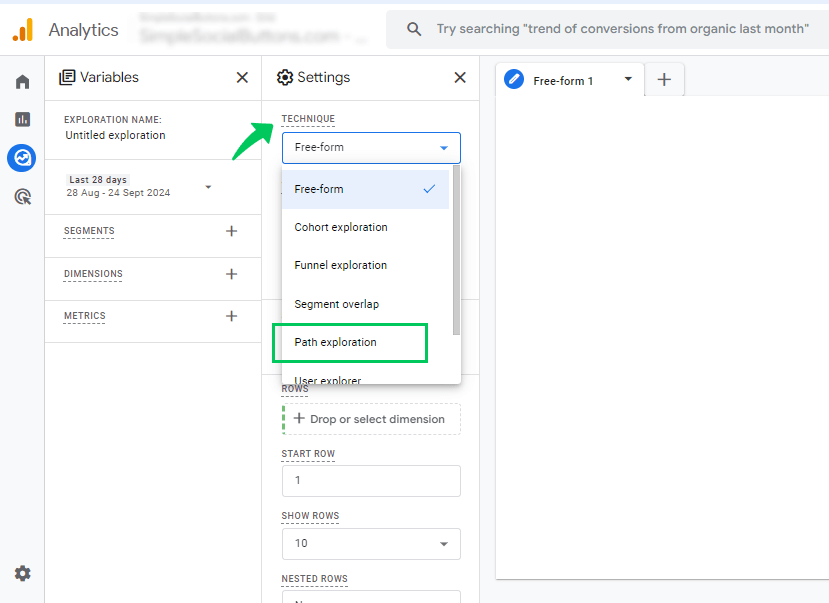
- In the Settings tab, use the drop-down under the Technique section and select Path Exploration.
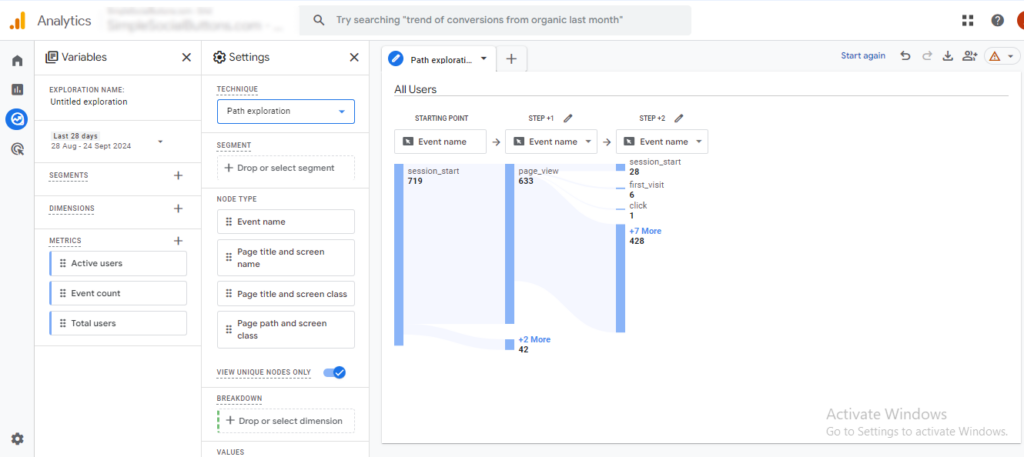
- This will open the default Path Exploration report, as shown below.
- To start fresh, click Start Again above the report section to create a new path exploration.
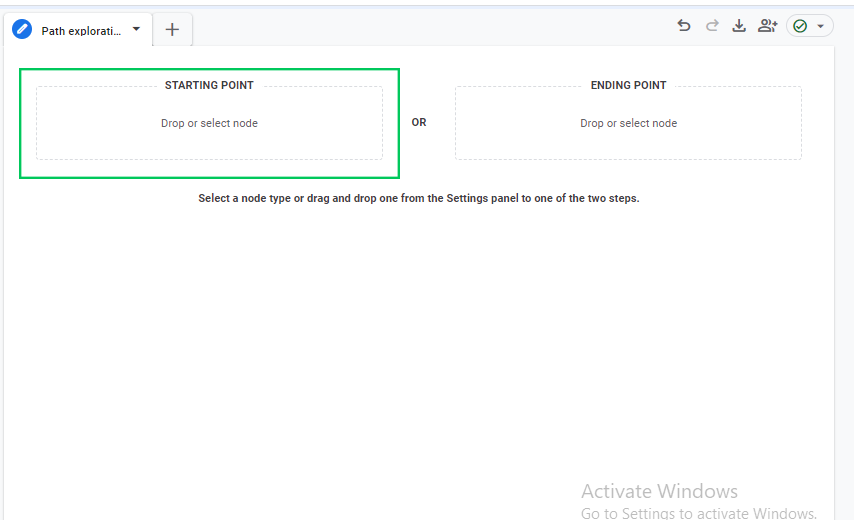
- Next, choose a starting point for forward path Exploration.
- Select one of the four nodes. Alternatively, drag and drop a node from the Settings tab to the starting point. In this example, we’ll choose the Event name node as our starting point.
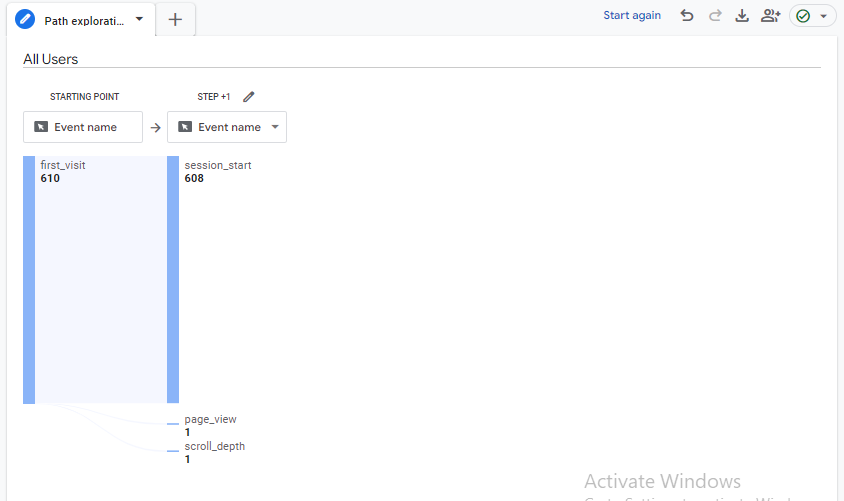
- After selecting the Event node, an overlay will appear from the right. From here, you can choose which events to include in your report, such as session_start, scroll, first_visit, or purchase. For this report, we’ll select the first visit event.
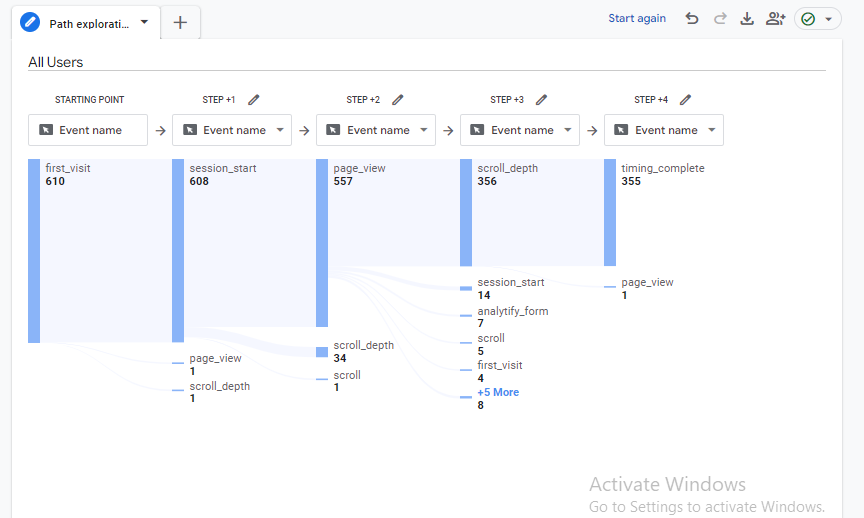
- You’ll now see that there are 610 first_visit events, followed by Session_start events in the next step. Clicking on Session will reveal a new Step+2, showing additional events like page_view and so on.
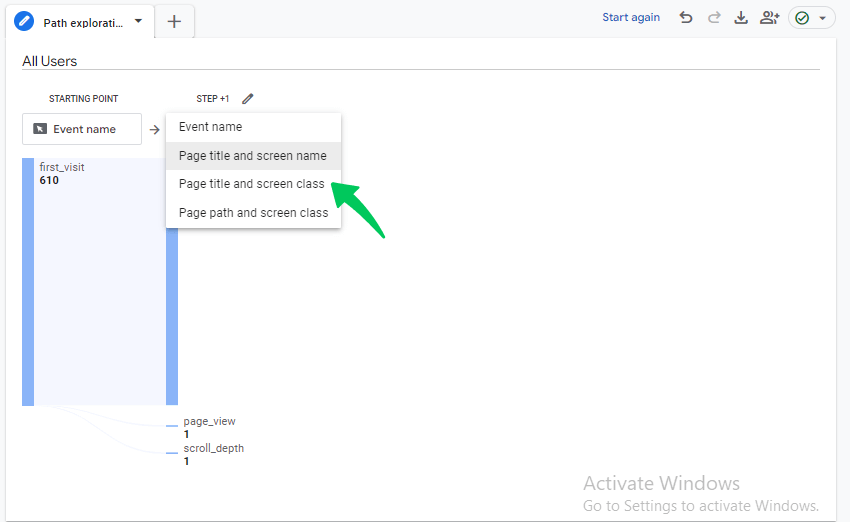
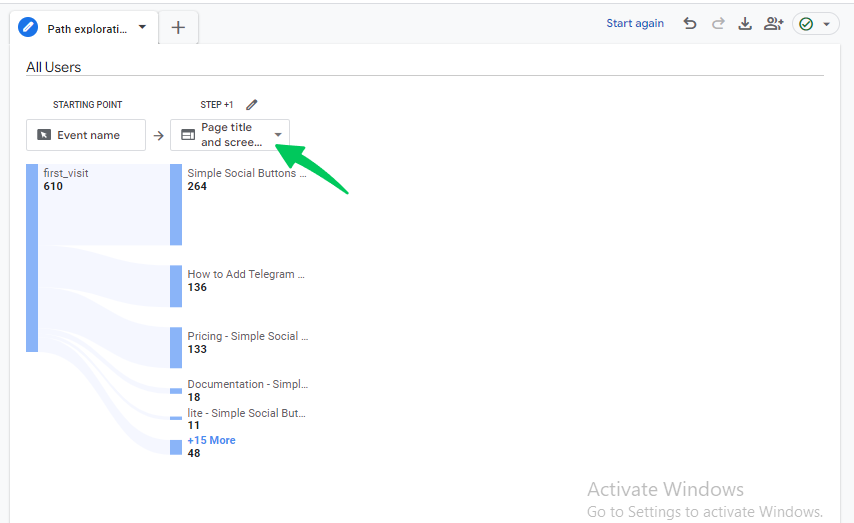
- You can select different nodes for each step by using the drop-down menu. For each subsequent step, you can choose the relevant node. Selecting nodes other than the event name will show page titles or screen names in the following steps.
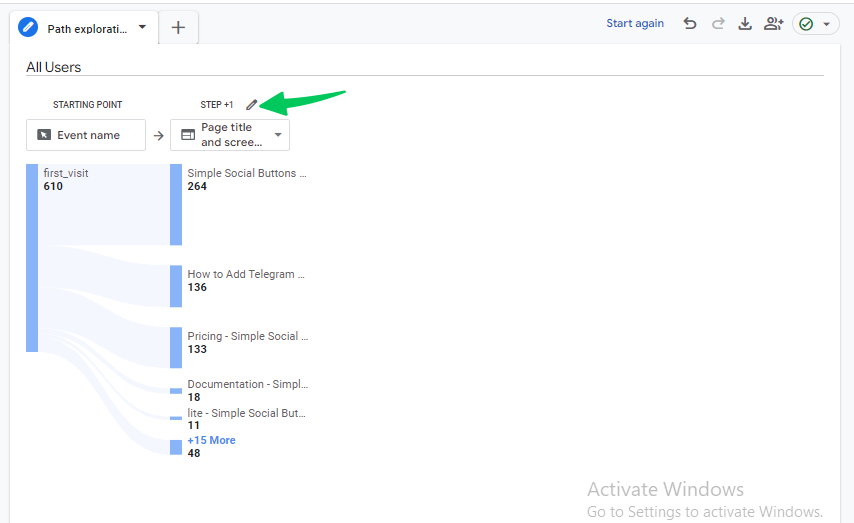
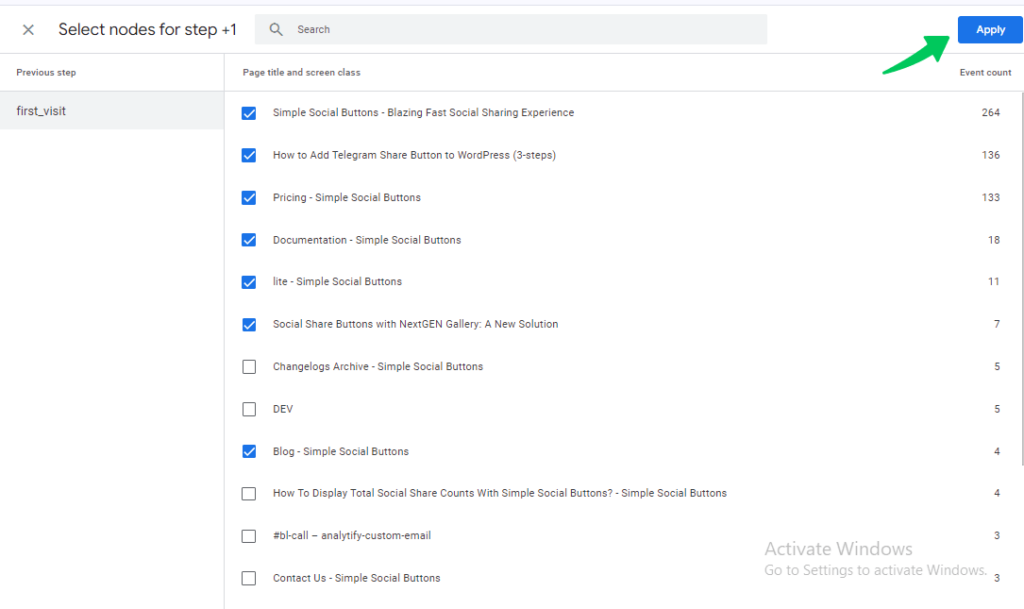
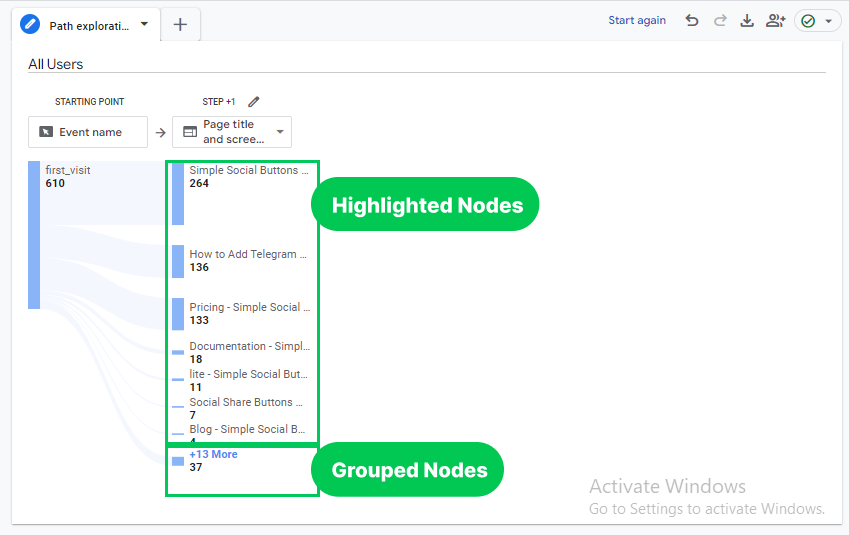
- As the steps progress, you’ll notice several different events. To focus on one event and group the others for a clearer view, highlight it. Click the Pen icon next to the step.
- Check the events you’d like to group together. Click on squares to select the items you want highlighted. Then, choose the apply tab so that all selected items will be highlighted, and the remaining will be grouped.
This was an example of a forward-moving GA4 path analysis report, showing the steps users take after the starting event or page.
Reverse-Path Exploration Report
The Reverse-Path Exploration report in GA4 traces user activity backward, starting from a specific endpoint, such as a conversion event, and analyzing the actions or pages users visited before reaching that point. This type of report is useful for investigating the user journey leading up to critical actions like purchases, form submissions, or sign-ups.
There are the following steps you have to follow to create a reverse path exploration:
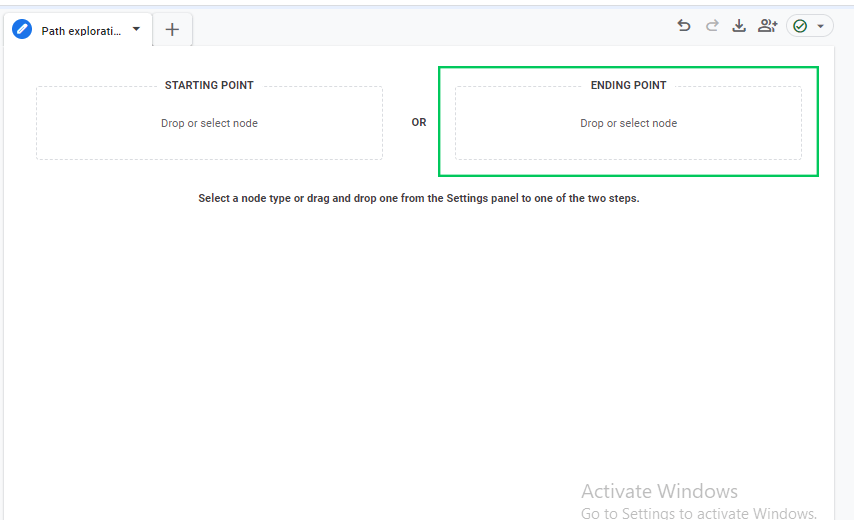
- Click the “Start Again” button above the Path Exploration report.
- To perform a backward path exploration, click on the ending point block.
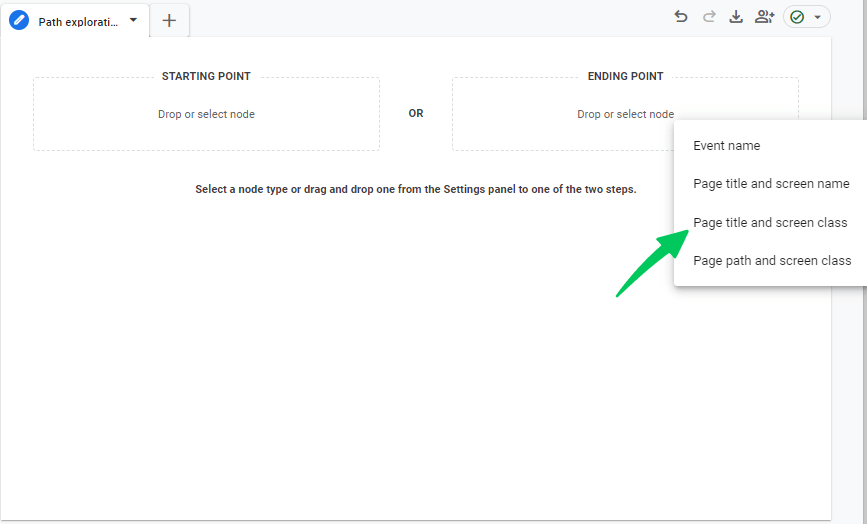
- After clicking, four node types will appear. Choose any according to your requirements. In this example, we’ve selected the page title and screen class as the endpoint.
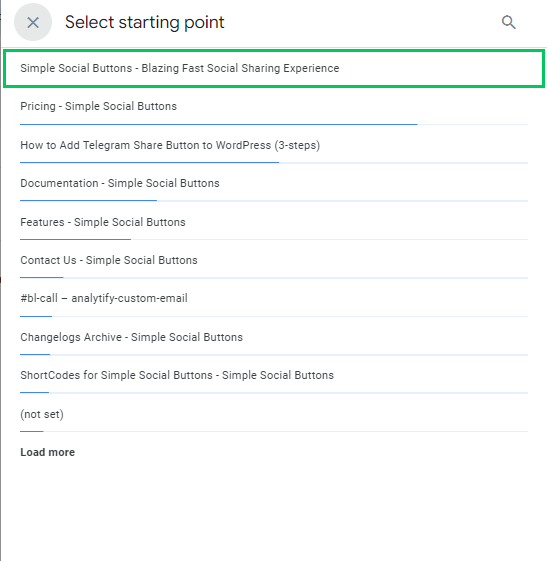
- After selecting the page title and screen class as the endpoint, choose a page from your site in the pop-up menu.
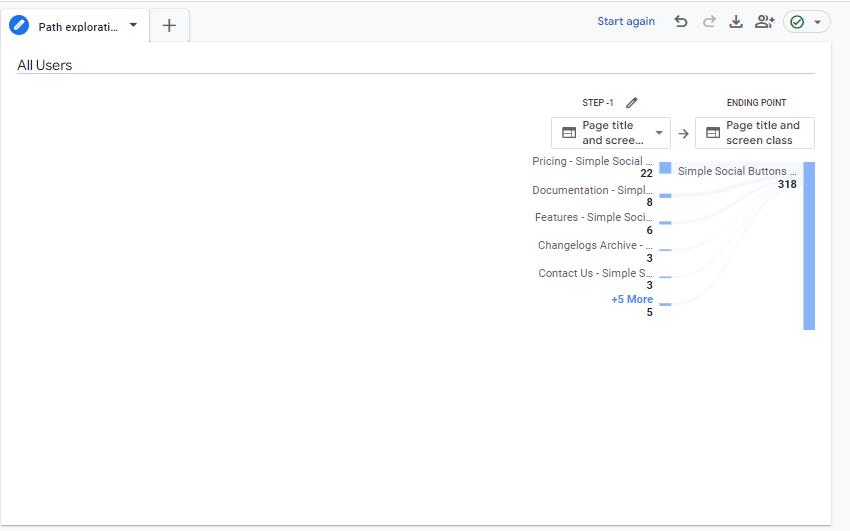
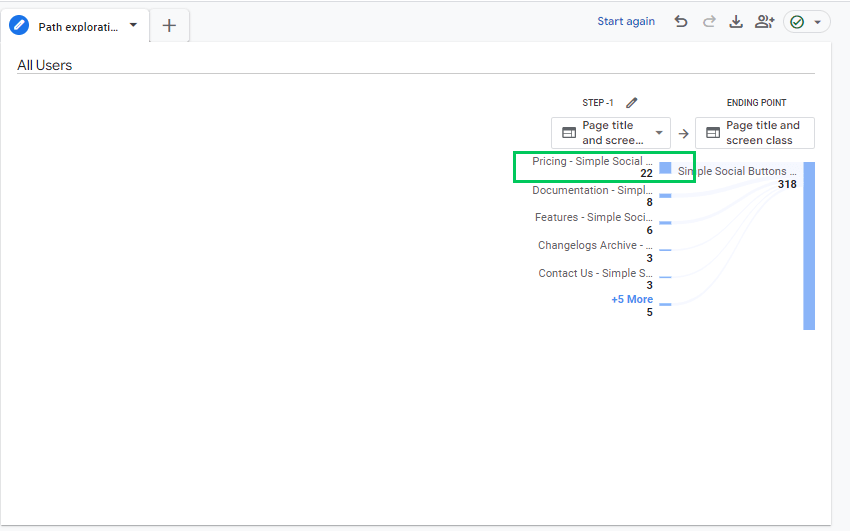
- As shown below, you will see columns labeled Step-1 leading up to the endpoint.
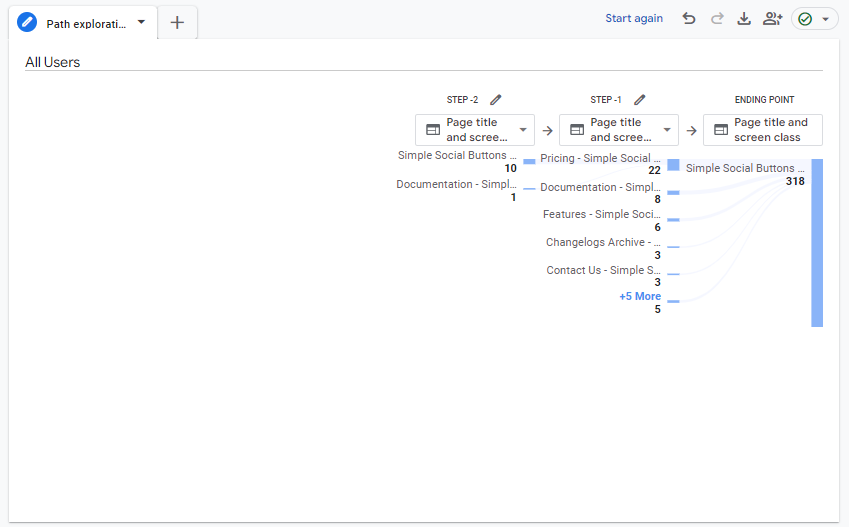
- Clicking on each node will allow you to expand backward into the user journey, offering a detailed view of the pages or events leading up to the conversion.
- Similar to forward path exploration, you can select different events or nodes for each previous step in your backward path exploration. The interface will generate a flowchart that shows all the steps users took before reaching their specified ending point.
By leveraging both Forward-Path and Reverse-Path Exploration reports, you can get a comprehensive view of how users navigate your site or app. This data is invaluable for optimizing the user journey, enhancing conversions, and improving overall engagement.
Modifying Settings for Path Explorations
Customization is key in path exploration. The Settings tab offers various toggles and options to refine your analysis. Let’s explore some key features:
1. Breakdown
The Breakdown option lets you add dimensions to your path exploration, providing additional layers of detail, such as device type, gender, country, etc.
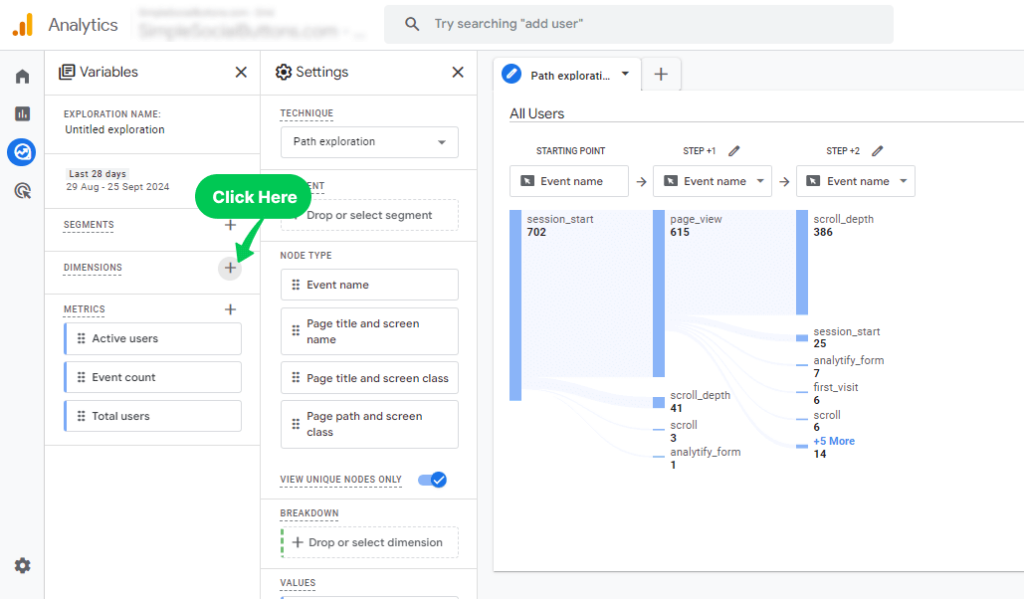
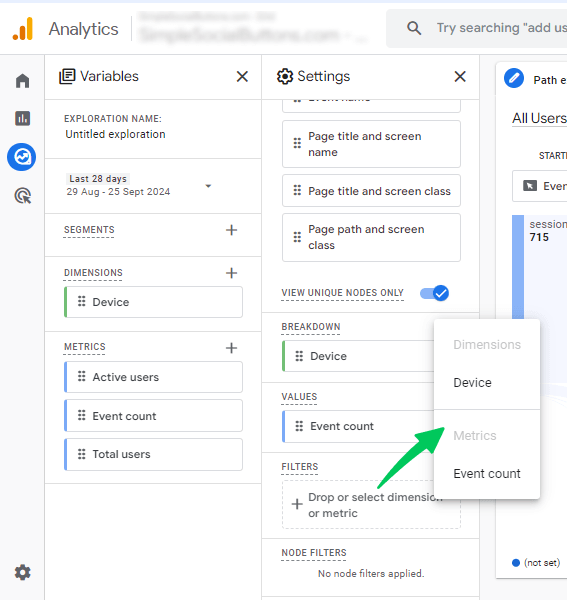
- Select dimensions in the Variables tab. Click the “+” icon next to Dimensions to add a dimension.
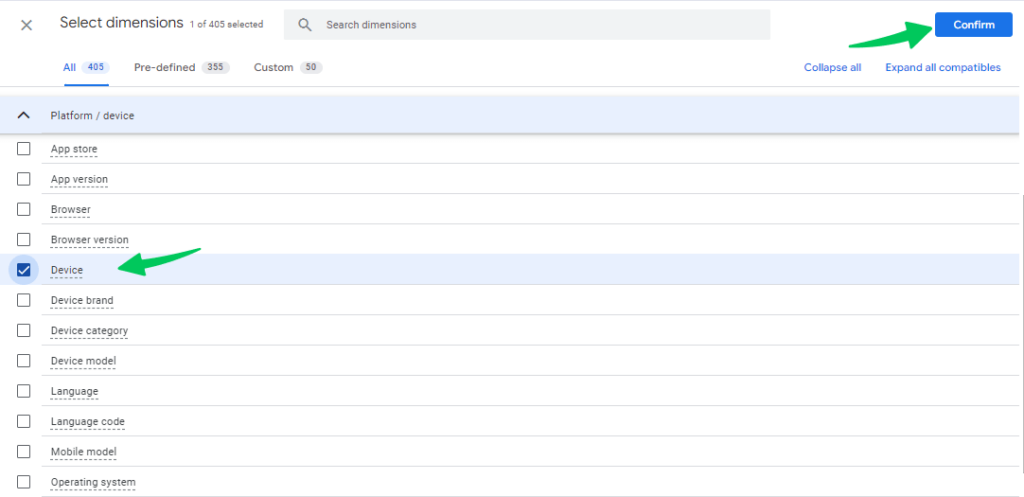
- Choose the desired dimensions from the list, and click the confirm button.
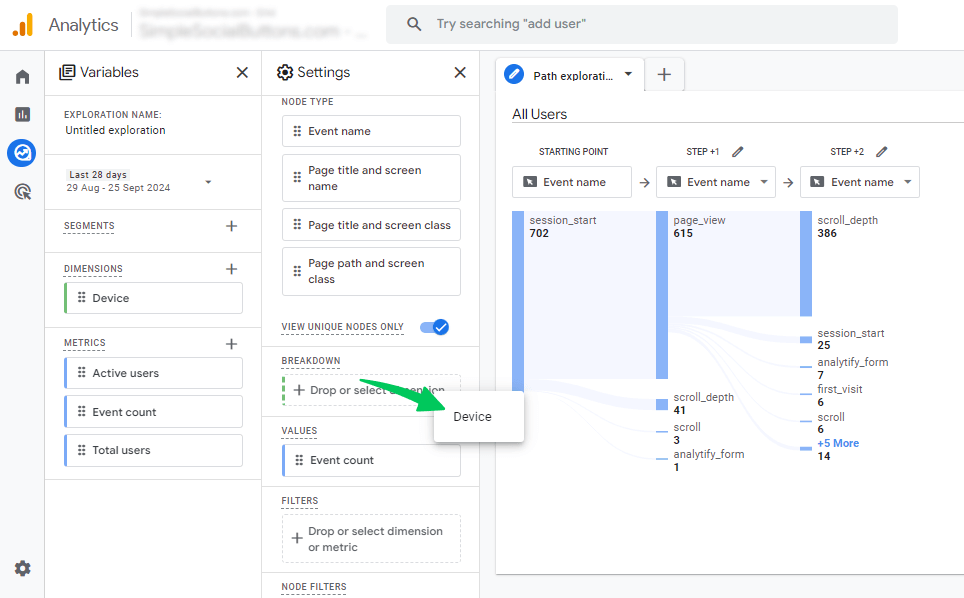
- Add dimension to the Breakdown option in the Settings tab.
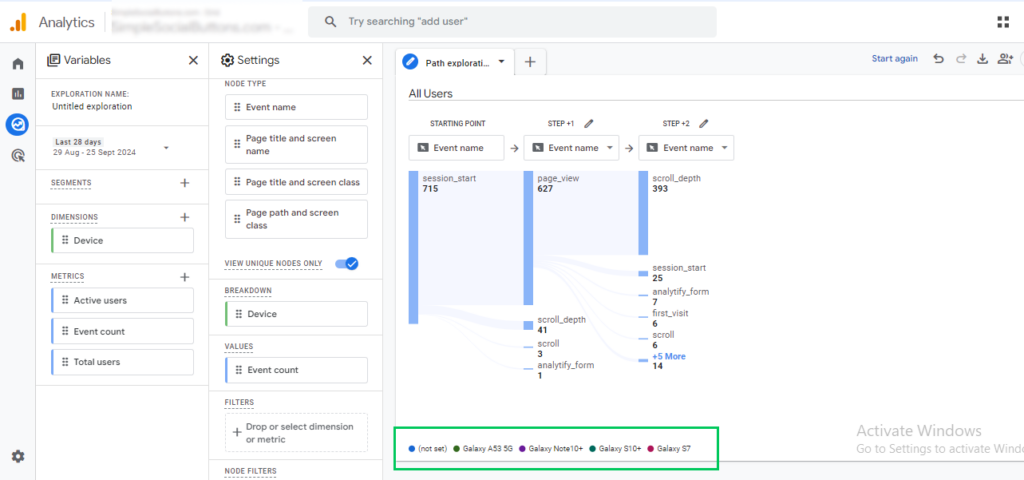
- Interact with the added dimensions to explore data. For example, adding “Device” as a dimension will display the names of interactive devices at the bottom of the report. The Specific Device name will reveal the events triggered or pages accessed via that device.
2. Filters
Use filters to exclude irrelevant data and focus on specific metrics or dimensions. You can filter your data based on that selection of metrics or dimensions. Set conditions like “equals,” “greater than,” or “less than” to refine your filter criteria.
3. Segments
Segments allow you to define specific user groups for in-depth exploration, which can be included or excluded from your path exploration.
- Create segments in the Variables tab (pre-built or custom). Click the + sign in front of the segment.
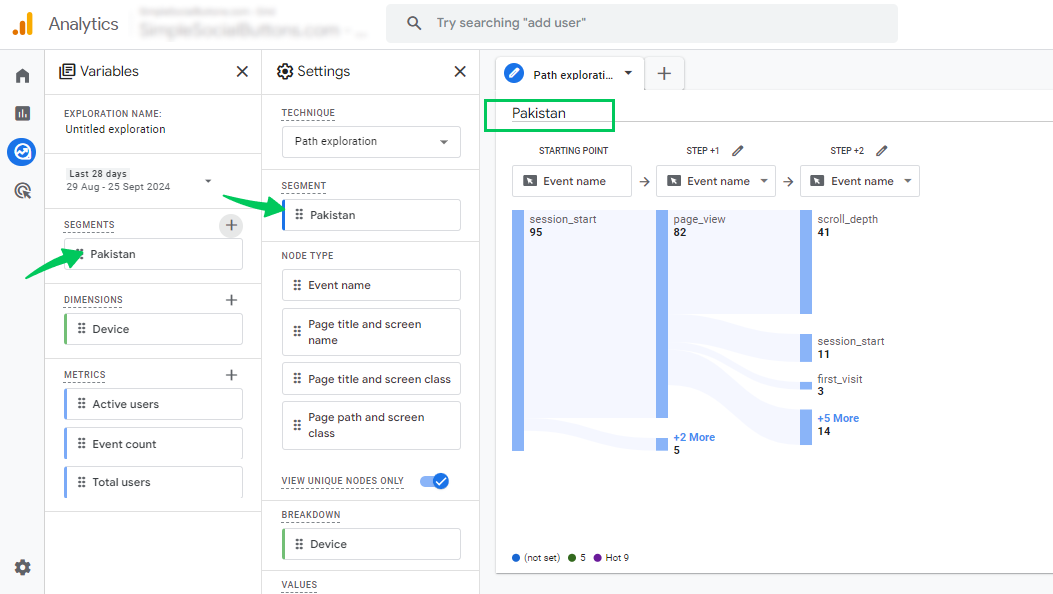
- For instance, you would create a User segment to analyze traffic based on a user’s geographic location, specifically by country.
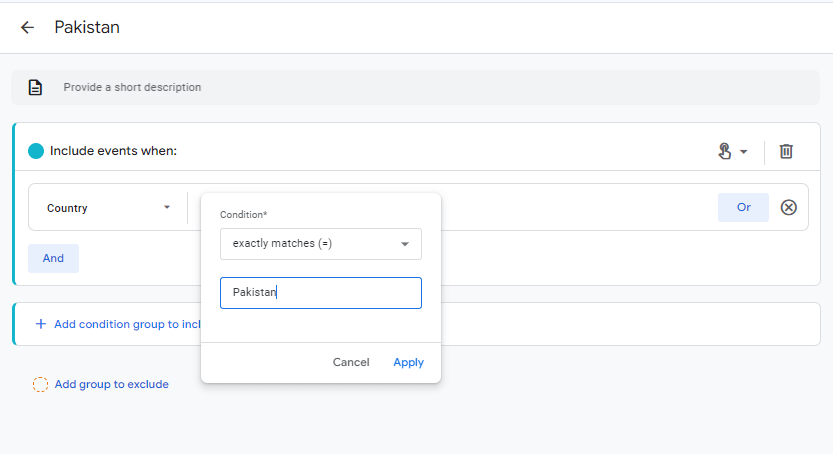
- Choose Geography > Country as the dimension, and set the condition to “exactly matches” before selecting the desired country. After clicking Apply and Save, the segment will be available in the Variables tab.
- Add them to the Segments section in Settings.
- Analyze path exploration data for the defined segments. Your path exploration will now show data specifically for the selected country, such as Pakistan.
By effectively using dimensions, filters, and segments, you can uncover valuable information and tailor your path exploration to your needs.
Using Analytify for GA4 Path Exploration
The Analytify plugin makes tracking user behavior in GA4 more accessible and streamlined, especially when analyzing reports like Path Exploration. While GA4’s native interface offers powerful tools for analyzing user journeys, Analytify simplifies the process for WordPress users, providing enhanced ease of access to crucial reports from your WordPress dashboard.
Join 50,000+ beginners & professionals who use Analytify to simplify their Google Analytics!
Path Exploration in GA4 helps you visualize and analyze users’ steps on your website, offering details into how visitors move from one page or event to another.
Below are the key features that help streamline your reporting process:
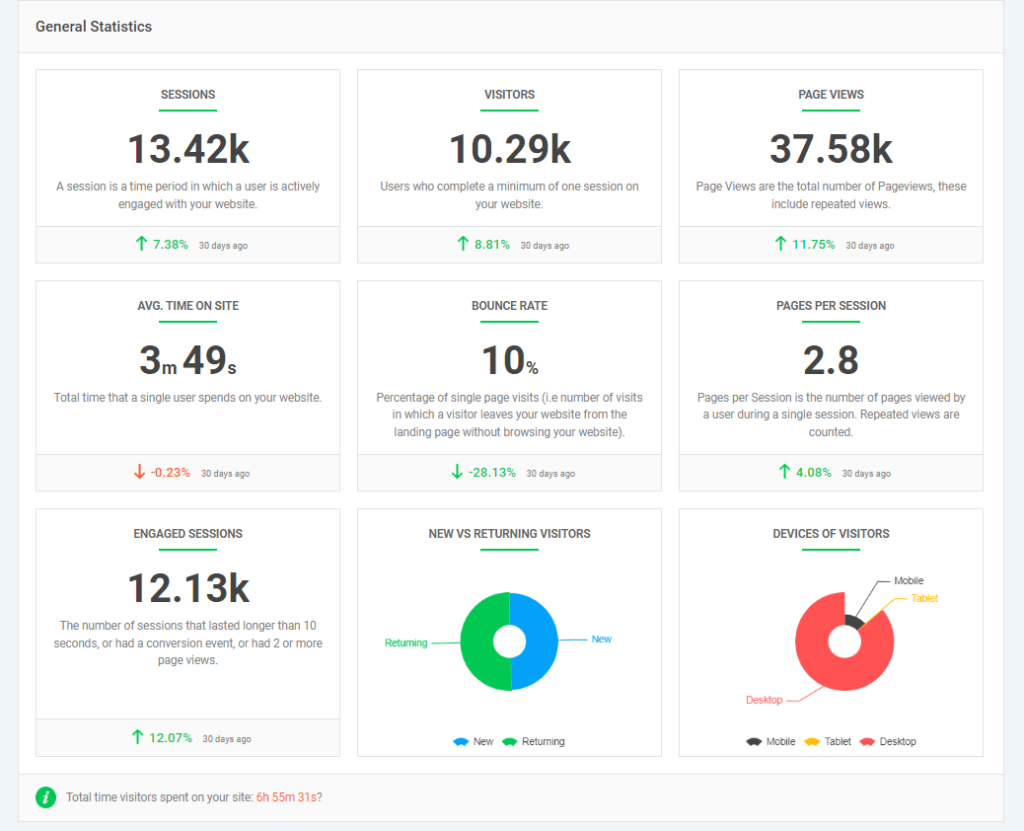
- Key Metrics displayed directly on the dashboard:
Analytify’s intuitive dashboard consolidates essential metrics like sessions, page views, and bounce rates, making reviewing your site’s overall performance easier.
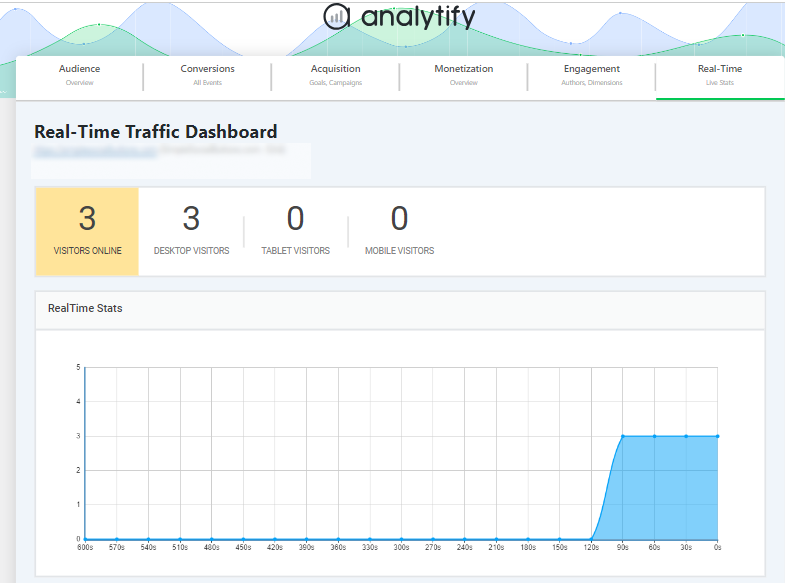
- Real-time Report
The real-time reporting feature provides live data on user activity. Whether monitoring a campaign or making immediate changes to your site, Analytify lets you see the impact in real-time.
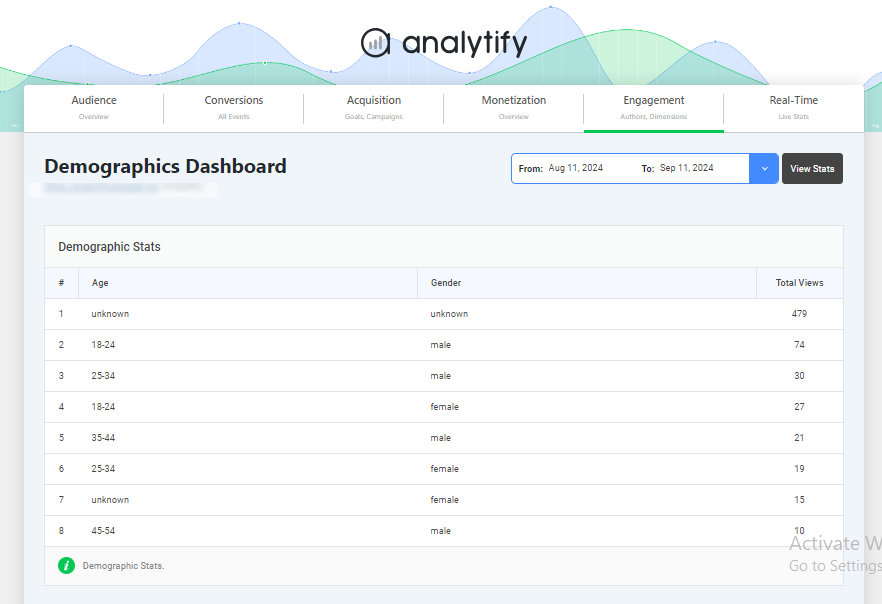
- Demographic and Interest Reports
Get details of your audience with Analytify’s demographic reports. This data is presented clearly and directly in the dashboard without manually setting up Google Signals in GA4.
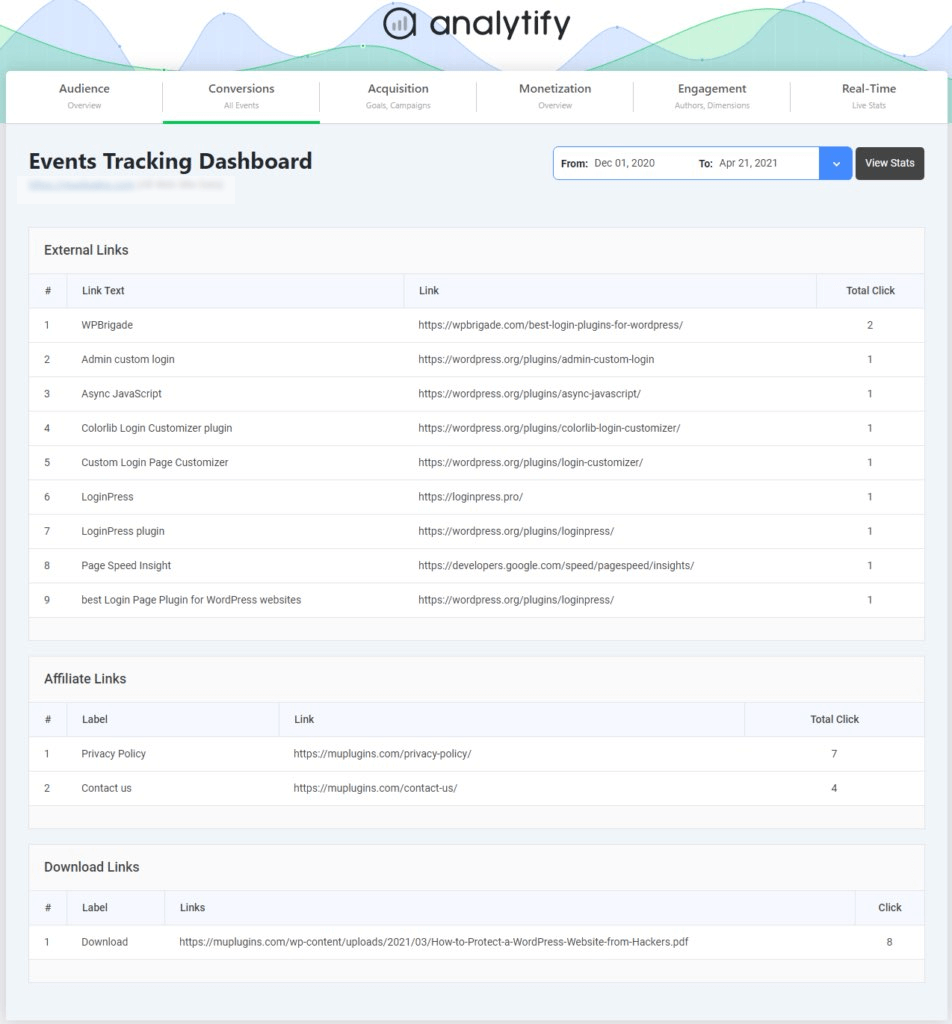
- Event Tracking
The Analytify Event Tracking add-on makes setting up and monitoring events straightforward. You can track essential user interactions like form submissions, downloads, and button clicks without diving into GA4’s complex event setup.
- Goal Tracking
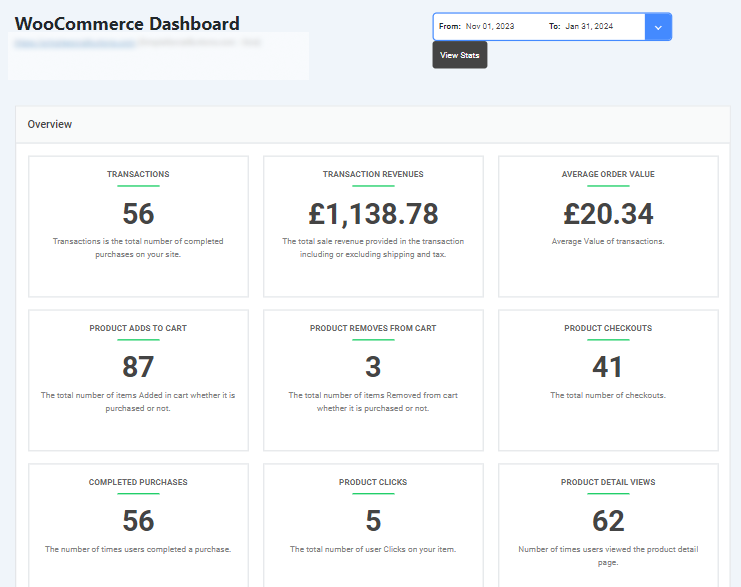
Easily set and track goals in Analytify with Goal Tracking add-on, ensuring that all key conversion actions (e.g., purchases, sign-ups) are monitored and reported. This feature helps verify your goals are correctly configured for accurate reporting. - Ecommerce Tracking
For e-commerce websites, the WooCommerce add-on provides seamless integration, allowing you to track revenue, product performance, and transactions effortlessly. Analytify displays these metrics clearly.
- Email Notification Addon
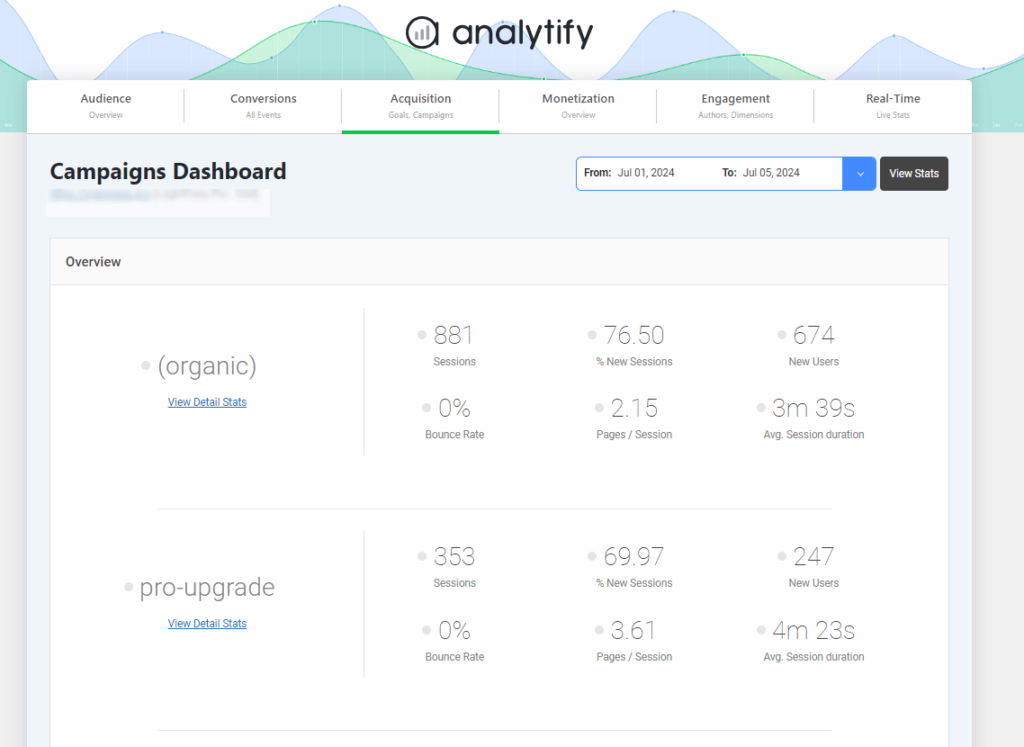
Stay informed with real-time updates via email notifications on your website’s performance due to the Email notification add-on. This feature keeps you updated on critical metrics without constantly logging in. - UTM Campaign Tracking
Analytify supports UTM campaign tracking, making it easy to see how your marketing efforts are performing. It tracks the success of various campaigns.
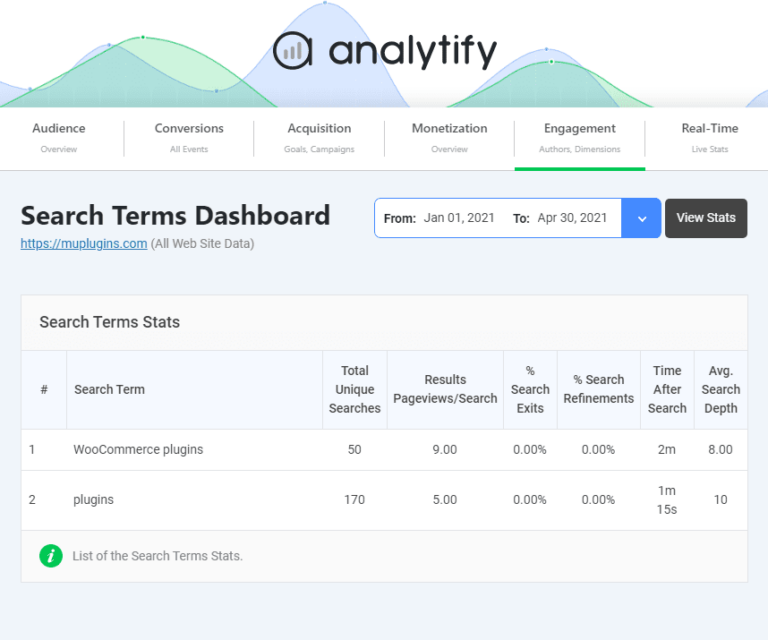
- Search Term Dashboard
Analytify captures internal search queries users enter and displays them in a search term dashboard. This valuable data helps identify what visitors are looking for on your site.
Analytify simplifies monitoring Google Analytics data using these features, allowing users to focus on useful information and data accuracy.
GA4 Path Exploration FAQs
1. What is the ending point in GA4?
The ending point in GA4 refers to the final event or page a user interacts with in a path exploration report. It’s used primarily in backward path exploration, where you select this point to trace the user’s journey leading up to that action or page.
2. How do I access the Path Exploration report in GA4?
To access the Path Exploration report, go to Explore in the left-hand menu of GA4 and select Path Exploration from the available exploration techniques. From there, you can begin setting up your path analysis.
3. What is the difference between forward and backward path exploration?
In forward path exploration, you start from a specific event or page and trace the user journey forward. In backward path exploration, you choose an endpoint, such as a page or event, and trace the steps that led users to that point.
4. Can I add dimensions to my Path Exploration report?
You can add dimensions like device, browser, location, and more. To gain more details about user segments, simply select a dimension from the Variables tab, import it, and apply it using the Breakdown option.
5. What is the page path in GA4?
The page path in GA4 is a dimension that captures the specific URL structure of the pages users visit on your website, excluding the domain name. Based on the URL path, it shows users’ navigation flow through your site.
6. Can I export or share my GA4 Path Exploration report?
GA4 allows you to export your Path Exploration report as a CSV or PDF file. You can also share the report with other users accessing your GA4 property.
Final Thoughts: Google Analytics Path Exploration
In GA4 Path Exploration, you gain an understanding of how users navigate through your site. By utilizing both forward and reverse path analysis, you can map user behaviors that help improve engagement and conversion strategies.
The Path Exploration Report in Google Analytics allows you to visualize user journeys using flexible tools like nodes and steps, breaking down each user action into digestible pieces of content. Adding dimensions, applying filters, and analyzing segments further enhance your understanding of user behavior, making GA4 Path Exploration a crucial feature for optimizing the user experience.
To learn more about tracking user funnels and paths effectively, consider exploring the GA4 Funnel Exploration Reports. These reports offer step-by-step guidance on building more effective path analyses.
Do you have any questions about using GA4 Path Exploration? We’d love to hear from you in the comments below!

