How Do You Use Google Analytics 4 to Grow a WordPress Blog?

You publish consistently and still can’t tell which posts are growing your blog. GA4 has the answer, but most bloggers open it, see unfamiliar metrics, and close the tab. If you have not connected your site yet, start with our guide on How to Set Up Google Analytics 4 and Connect it to Your WordPress Site?
Without analytics, it’s difficult to know which posts deserve updates, which traffic sources are worth investing in, and which content formats actually attract returning readers. Publishing more content doesn’t automatically grow a blog; making decisions based on performance data does.
This article gives you five GA4 reports: your complete guide to using Google Analytics 4 to grow WordPress blog, one clear action from each, and a weekly routine under 20 minutes.
You can use Google Analytics 4 to grow a WordPress blog by tracking five reports: traffic sources, top pages by engagement, search queries, engagement rate, and returning readers. Analytify displays all five inside your WordPress dashboard, making it easier to act on the data without switching between WordPress and GA4.
Google Analytics 4 to Grow WordPress Blog (TOC):
What Is GA4 and Why Does It Matter to Grow WordPress Blog?
Google Analytics 4 is a free analytics platform that tracks how readers find, interact with, and return to every post on a WordPress blog, using an event-based model that measures engagement, scroll depth, and traffic sources rather than simple page views. This metric is one of the most underused signals when you are trying to use Google Analytics 4 to grow a WordPress blog consistently.
Instead of just counting page views, GA4 records every action a reader takes: a scroll past 90%, a click on an outbound link, a completed video, a form submission.
GA4 for blogging tells you three things WordPress’s built-in stats do not. First, where traffic actually comes from, beyond a generic “direct” label. Second, how long readers actively engage with a post, not just time on page. Third, which posts drive return visits over 7 and 28 days?
Setting up Google Analytics 4 for WordPress blog is simple with Analytify, which handles the integration and shows all five reports directly inside WP-admin.
Which GA4 Reports Should Bloggers Check Regularly?
Bloggers using Google Analytics 4 to grow WordPress blog should focus on five reports: Traffic Acquisition (to know where readers come from), Pages and Screens (to identify the best-performing posts), Search Console integration (to find which queries drive organic traffic), Engagement overview (to measure which posts hold readers’ attention), and Returning users (to track audience loyalty over time). The five GA4 reports for blog growth covered below take under 20 minutes each week.
Together, these five reports answer the most important growth question for any blogger: what should I write more of, what should I update, and what is not worth repeating?
To grow a WordPress blog with analytics, run these same five GA4 reports every week. The data changes. The questions stay the same.
Use the Traffic Acquisition Report to Grow Your Blog
The Traffic Acquisition report in GA4 shows where your blog’s readers are coming from, including organic search, direct, social media, email, and referral, so you know which channels to invest in and which to stop.
GA4 path: Reports > Acquisition > Traffic Acquisition.
Look at the Sessions column by channel. Which channel sends the most readers? Is organic search growing month over month?
The blog action this triggers: if organic search is your top channel, write more long-tail content targeting specific questions. If social is your top channel but engagement rate is low, shift focus from distribution to content depth.
Analytify displays the traffic source breakdown inside the WordPress dashboard, so you can check channel performance without opening GA4. Growing a WordPress blog with analytics starts here: know your best channel, then double down on it.
Steps to use this report:
- Go to Reports > Acquisition > Traffic Acquisition in GA4.
- Read the Sessions column. Identify your top channel.
- Decide: if organic is growing, write more. If the social engagement rate is under 40%, redirect effort to SEO or email.

Find Your Best Blog Posts in GA4’s Pages and Screens Report
The Pages and Screens report in GA4 shows every post and page on your blog ranked by views, with average engagement time alongside, so you can identify which posts readers find AND read, versus which they click and leave.
Find it under Reports > Engagement > Pages and Screens.
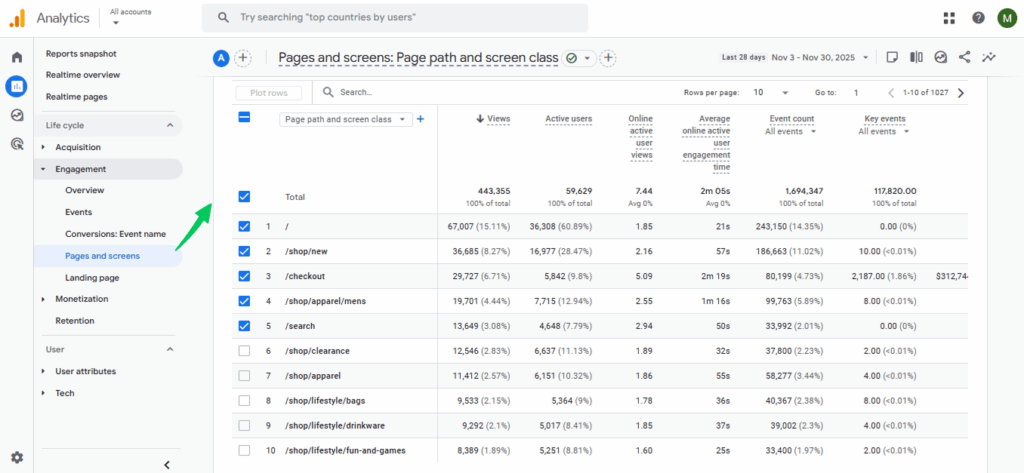
Read two columns together: Views (found) and Average engagement time per active user (read). A high-view, low-engagement post needs a rewrite. A low-view, high-engagement post needs promotion.
Bottom line: sort by average engagement time descending. Your top three results are your best content types. Write more posts in the same format and on the same topic. Update the top post each year to protect its ranking.
Analytify shows per-post engagement stats directly below each post in the WP editor, so you see how every piece of content is performing without leaving the post you’re editing.
Steps:
- Open Reports > Engagement > Pages and Screens in GA4.
- Sort by Average Engagement Time per Active User, descending.
- Flag posts with high views and low engagement for a rewrite. Flag posts with high engagement and low views for promotion.

Discover Content Opportunities with Google Search Console Integration
Connecting Google Search Console to GA4 adds keyword data to your Google Analytics for WordPress blog, showing the exact search queries that bring readers to each post and which page-2 posts need a better title to improve CTR.
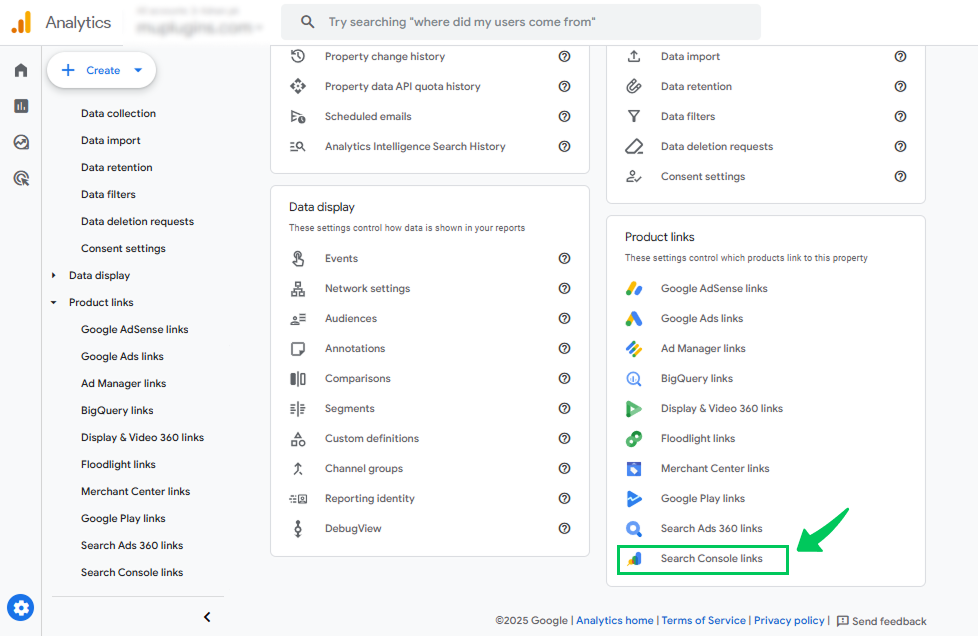
Setup requires linking in GA4 Admin > Product Links > Search Console. One step, not a full tutorial.
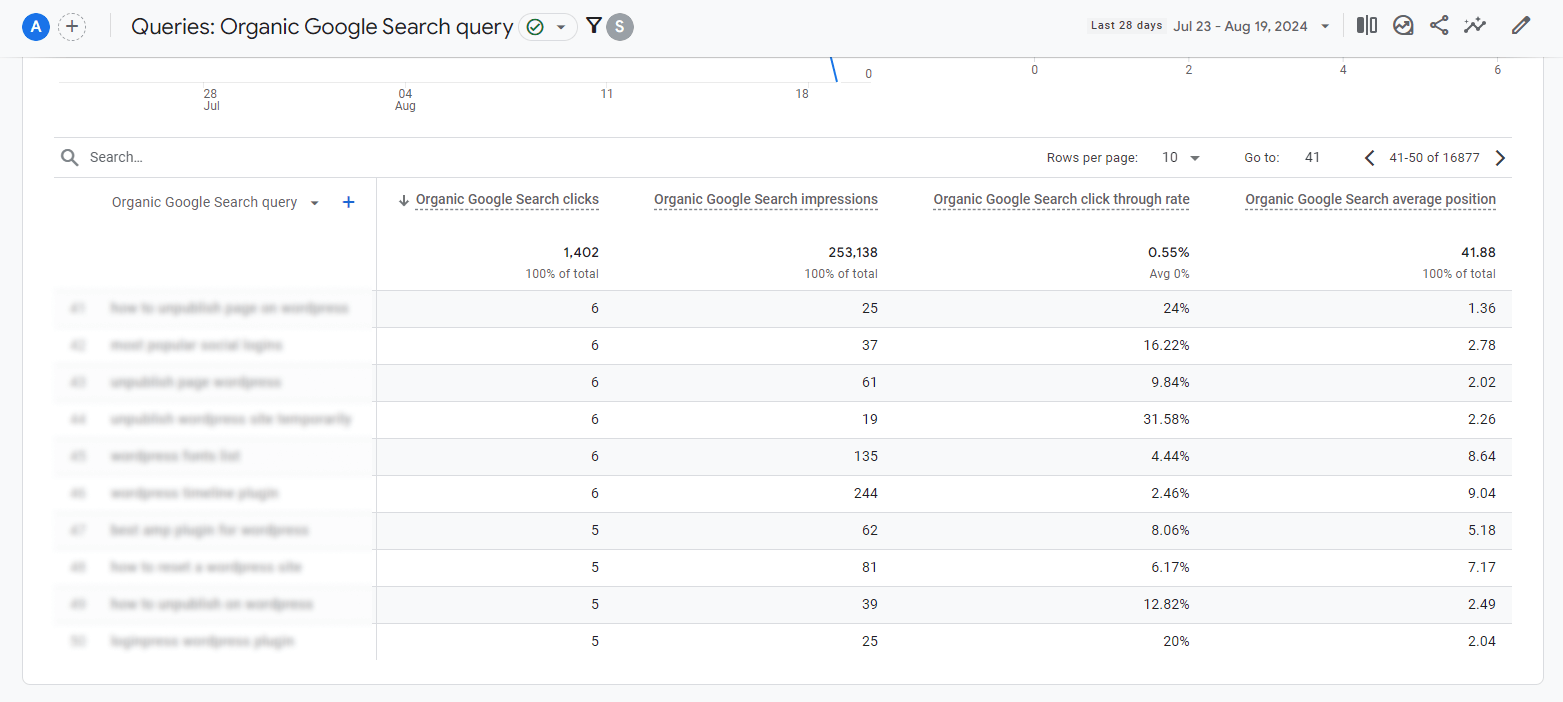
Look for posts with strong impressions but low click-through rates (CTR under 2%). These posts rank but need a better title or meta description. This is a faster win than writing new content. A post already receiving impressions has proven search demand, making optimization more efficient than creating a new article from scratch.
The blog action this drives: identify three posts with over 500 impressions and CTR under 2%. Update their titles and meta descriptions. Republish with a Last Updated date. Google Analytics for content strategy starts with the data you already have, not new keywords.
Steps:
- In GA4, go to Admin > Product Links > Search Console and link your property.
- Navigate to Reports > Search Console > Queries.
- Filter for posts with 200+ impressions and CTR under 3%. Update the H1 and intro of the top three.
What Does GA4 Engagement Rate Tell You About Your Blog Posts?
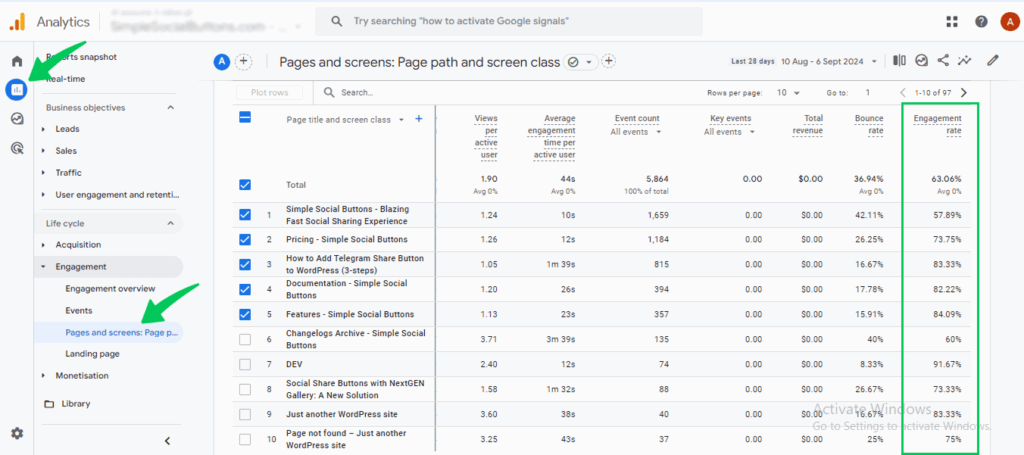
In GA4, engagement rate is the percentage of sessions where a reader was actively on the page for at least 10 seconds, viewed at least two pages, or triggered a key event, making it a more reliable measure of content quality than the old bounce rate.
Standalone definition: GA4 engagement rate measures the share of sessions with meaningful reader activity, specifically sessions lasting 10 or more seconds, sessions with two or more page views, or sessions with a completed key event, divided by total sessions for that post.
Many content-focused blogs aim for engagement rates between 55% and 65%, though benchmarks vary by niche and traffic source. Below 40% suggests the page does not match reader intent or loads too slowly.
The fix is straightforward: posts with an engagement rate under 40% are candidates for rewrite, not promotion. Open Pages and Screens. Start with the highest-traffic, lowest-engagement posts first.
GA4 engagement and retention for blogs improve when you fix these first. Promotion amplifies quality; it does not create it.
| Engagement Rate | What It Signals |
| 65%+ | Strong content-intent match. Promote this post. |
| 55–64% | Healthy for content blogs. Monitor quarterly. |
| 40–54% | Below average. Check title accuracy and page load time. |
| Under 40% | Poor intent match or slow load. Rewrite before promoting. |
Track Returning Readers in GA4 to Measure Audience Loyalty
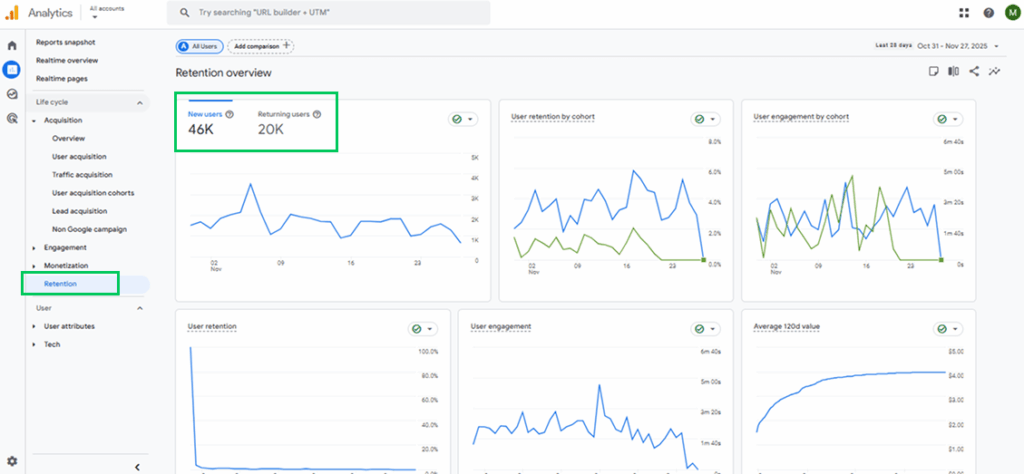
GA4 tracks returning users under Reports > Retention, showing what percentage of readers come back within 1 day, 7 days, and 28 days, which tells you whether your blog is building an audience or relying entirely on new traffic.
GA4 path: Reports > Retention. The User Retention chart shows cohort-based return rates.
A 28-day return rate above 10% for a content blog is healthy. Below 5% means the blog is not giving readers a reason to come back.
The blog action: blogs with low return rates should add a content upgrade or email opt-in to the top five posts by traffic. Improving retention compounds blog growth over time.
How Do You Turn GA4 Data Into Content Ideas and Updates?
You turn GA4 data into content ideas by using three signals: posts with high engagement time but low traffic (write more like this), queries with high impressions but low CTR (update the title and intro), and posts with declining traffic month over month (refresh with new data and republish). Every insight you act on is Google Analytics 4 to grow WordPress blog in practice.
Most bloggers do the opposite: they spend time promoting low-engagement posts. The faster growth move is identifying your highest-engagement posts and writing more content in the same format, on the same topic, for the same reader intent.
Here is the five-action monthly routine every blogger should run. Each item names the report, the number to check, and the action to take.
- Open Pages and Screens. Sort by average engagement time. Posts over three minutes average are your best content types. Write two more in the same format and on the same topic.
- Open Traffic Acquisition. Find your second-highest traffic channel. If it is social, but the engagement rate is under 40%, stop promoting there. Redirect effort to email or SEO.
- Use Search Console data in GA4. Filter for posts with 200+ impressions and CTR under 3%. Update the H1, meta title, and intro paragraph of the top three.
- Open Retention. If the 28-day return rate is under 8%, add a related-posts internal link block to your top ten posts by traffic.
- Open Pages and Screens filtered to the last six months. Posts that dropped more than 30% in views versus the prior six months need a content refresh: add new statistics, update examples, republish.
Analytify’s dashboard inside WordPress surfaces traffic and engagement data for these checks without opening GA4 separately. The per-post stats panel shows each post’s performance so you can prioritize updates directly inside your content list.
Google Analytics for content strategy and growing a WordPress blog with analytics both come down to this: look at the data monthly, pick one action, execute it.
How Does Analytify Help Bloggers Use GA4 Insights Inside WordPress?
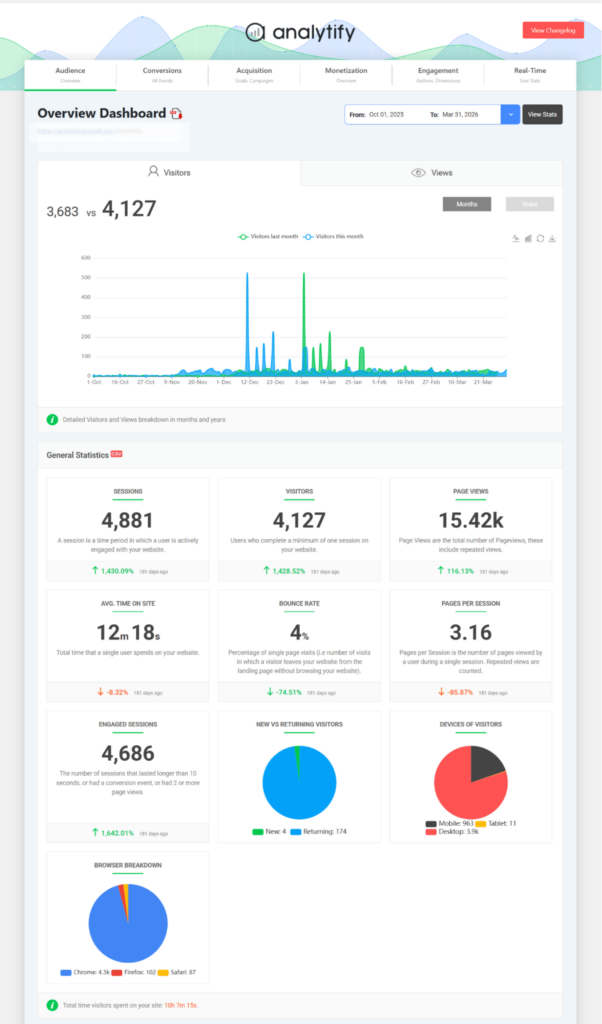
Analytify puts the five GA4 reports that matter most for bloggers directly inside the WordPress dashboard, so you can check traffic sources, post performance, and engagement data without opening GA4 or learning its navigation.
Google Analytics 4 to grow WordPress blog is most useful when the data lives where you already work. Analytify shows every metric you need — sessions, pageviews, engagement rate, traffic sources — inside your WP-admin dashboard.
Here are five Analytify features mapped to the GA4 reports in this article:
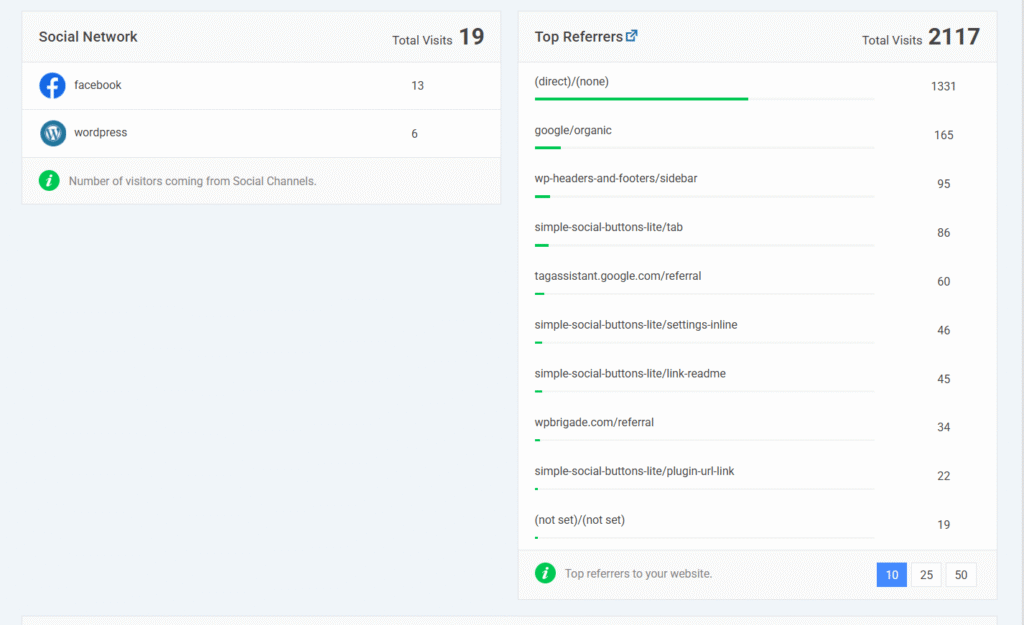
- GA4 report: Traffic Acquisition. Analytify equivalent: traffic source breakdown inside the WordPress dashboard. Analytify displays organic search, social, direct, and referral traffic without leaving WP-admin.
- GA4 report: Pages and Screens. Analytify equivalent: per-post stats panel directly below each post in the WP editor. Analytify shows sessions, pageviews, and average engagement time for each individual post inside the editor.
- GA4 report: Realtime. Analytify equivalent: real-time stats inside WP-admin under Analytify > Dashboard > Realtime Stats. See active users as they happen.
- GA4 report: Engagement overview. Analytify equivalent: the main Analytify dashboard inside WP-admin, showing engagement metrics across all posts in one view.
- GA4 report: Author performance. Analytify equivalent: author-level stats [Pro] showing which authors drive the most engaged traffic. This is a Pro feature, available from $59/year.
Analytify is a dashboard presenter. It shows GA4 data inside WordPress. It does not create independent reports or replace Google Analytics.
GA4 for blogging and GA4 engagement and retention for blogs are both easier to monitor when the data is where you already work.
What Is the Weekly GA4 Routine Every WordPress Blogger Should Follow?
A weekly GA4 routine for WordPress bloggers takes under 20 minutes and covers three checks: which posts got the most traffic this week, where that traffic came from, and which posts had the highest engagement rate.

Here is the full seven-step weekly checklist:
- Open Traffic Acquisition. Note your top channel this week. Is it growing versus last week?
- Open Pages and Screens. Identify the top three posts by views this week.
- Check the engagement rate on those three posts. Any post under 40% goes into the update queue.
- Flag posts with under 40% engagement for revision. Add them to your content update list.
- Open Retention. Check your 28-day return rate. Below 8%? Add related-posts links to your top ten posts.
- Scan Search Console data in GA4. Find one post with 200+ impressions and CTR under 3%. Schedule a title and intro update.
- Write down one content idea triggered by the data. High engagement on a certain topic? Write another post on it.
Google Analytics 4 to grow WordPress blog is not a research task. It is a seven-step weekly habit that takes less time than writing a single paragraph.
Frequently Asked Questions
1. How do you use Google Analytics 4 to grow a WordPress blog?
You use Google Analytics 4 to grow WordPress blog by tracking five key reports weekly: Traffic Acquisition (which channels send readers), Pages and Screens (which posts perform best), Search Console queries (which topics have organic demand), Engagement Rate (which posts hold readers), and Retention (whether readers return). Each report answers one question about your blog’s growth. Analytify surfaces all five inside WordPress so you can run this review without logging into GA4 directly.
2. Which GA4 reports should bloggers check regularly?
Bloggers should check five GA4 reports regularly: Traffic Acquisition, Pages and Screens, the Google Search Console integration, the Engagement overview, and the Retention report. Traffic Acquisition shows where readers come from. Pages and Screens show which posts are read versus skimmed. Search Console reveals which queries drive organic traffic. Engagement rate measures content quality. Retention shows audience loyalty. Together, these five reports take under 20 minutes per week to review.
3. How do you turn GA4 data into content ideas and updates?
You turn GA4 data into content ideas by identifying three patterns: posts with high engagement time but low traffic (write more in that format), posts with high search impressions but low click-through rates (update the title and intro), and posts whose traffic has dropped more than 30% over six months (refresh with new data and republish). These three moves are the highest-return actions any blogger can take from monthly GA4 data.
4. How does Analytify help bloggers use GA4 insights?
Analytify displays GA4 data inside the WordPress dashboard, removing the need to log into GA4 for routine blog performance checks. Analytify shows per-post stats directly below each post in the WordPress editor, traffic source breakdowns inside WP-admin, real-time visitor data, and, for Pro users, author-level performance reports. This makes it practical for bloggers to check analytics as part of their normal WordPress workflow rather than as a separate task.
5. What is a good engagement rate for a blog in GA4?
A good engagement rate for a content blog in GA4 is between 55% and 65%. Engagement rate in GA4 measures the percentage of sessions where a reader was actively engaged for at least 10 seconds, viewed more than one page, or triggered a key event. Rates below 40% typically indicate a mismatch between the post title and content, slow page load time, or content that does not answer the reader’s question thoroughly enough.
6. Can I track individual blog post performance in WordPress?
Yes. Analytify adds a per-post analytics panel directly below each post in the WordPress editor, showing that post’s sessions, pageviews, average engagement time, and traffic source breakdown. This means you can check how any individual post is performing without leaving WordPress or navigating GA4’s reports. The per-post stats are pulled from your connected GA4 property and update as GA4 processes new data.
Final Thoughts
Using Google Analytics 4 to grow a WordPress blog is not about collecting more data. It’s about making better content decisions.
If you also want to improve the experience readers have before they even reach your content, LoginPress lets you design a branded WordPress login page without touching code.
GA4 is not a reporting tool you check once a month. It is a weekly feedback system that tells you exactly which content to write next, which posts to update, and which channels to grow.
Three next steps:
- Open GA4 this week and check your Pages and Screens report. Sort by average engagement time. Identify your top three posts and write one more on the same topic or in the same format.
- Find your Search Console integration in GA4. Filter for posts with over 200 impressions and CTR under 3%. Update the H1 and intro of the top result.
- Install Analytify to see traffic, engagement, and per-post data inside WordPress. Run your weekly data check without opening GA4 at all.
See Analytify Pro plans at and start tracking your blog traffic inside your WordPress dashboard today.