How to Analyze Returning vs New Users in GA4 (WordPress Edition)

In GA4, new users are people visiting your site for the first time. Returning users are people who came back after an earlier visit. Comparing the two shows how well your content, marketing and user experience build loyalty.
Compare new visitors with loyal returning users. You get a clear picture of how your content, marketing, and user experience perform. You can see which pages attract first-time users, what keeps people engaged, and what encourages them to return.
User loyalty matters. New users grow your reach, and returning users show trust, interest, and long-term value. Track how often people return, how long they stay, and what actions they take. You can then improve your strategy and create content that keeps your audience engaged.
This guide shows how to analyze user loyalty with GA4’s new vs returning users reports. It also shows how Analytify makes these insights easier to track inside WordPress.
Let’s get started!
New vs Returning Users (TOC):
Why Tracking New vs Returning Users Matters
Tracking new vs returning users gives you clear WordPress user behavior stats. They show how different audiences engage with your site. New users represent first-time visitors, while returning users are those who come back after their initial visit.
Understanding these two groups shows which pages attract first-time visitors. It also shows which pages keep returning users interested or converting. These insights reveal content that performs well and highlight weak areas. They also show how effectively your site retains visitors.
New vs returning user analytics also act as loyalty signals. They measure how often people return and how much trust your content builds.
Study retention patterns to see what brings users back and where drop-offs happen. You can then find which improvements your content or user experience needs.
This data guides your content strategy. It shows which marketing campaigns drive high-quality traffic and highlights UX issues that affect engagement. With clearer behavioral insights, you can strengthen campaigns and improve navigation to bring users back. You can also create content that supports both new and loyal visitors.
Overall, it helps you build a WordPress site that attracts more people, keeps them interested, and encourages long-term growth.
Key Metrics to Track for User Behavior
To understand how new vs returning users behave on your site, track the right metrics. They reveal engagement, conversions, and loyalty. Here are the following key metrics to track for user behaviour:
Engagement Metrics in GA4
Engagement metrics in GA4 show how actively both new and returning users interact with your website. They help you understand what catches attention and what loses it.
- Average session duration: The average amount of time users actively stay on your site during a session.
- Pageviews per session: The average number of pages a user views in a single session.
- Bounce rate: The percentage of sessions where users leave without engaging or triggering an event.
- Engaged sessions: Sessions that last 10 seconds or more, include a key event, or have at least two pageviews.
- Engagement rate: The percentage of sessions that qualify as engaged sessions.
- Events triggered: The total number of actions users take, such as clicks, scrolls, or video plays.
- Views per user: The average number of pageviews or screen views generated by each user.
These engagement metrics make it easier to analyze returning users in GA4 and build content that keeps people engaged.
Conversion Metrics
Conversion metrics show how well your traffic turns into actions that matter. They highlight whether new users or returning users contribute more to your goals.
- Conversions: The total number of times key events (like signups or purchases) were completed.
- Conversion rate: The percentage of sessions or users that completed a key event.
- Event count for key events: How many times each marked key event was triggered.
- Revenue: Total monetary value generated from purchases or ecommerce actions.
- Purchase revenue: The amount earned specifically from completed ecommerce purchases.
- Ecommerce purchases: The total number of purchase events recorded in GA4.
- Transactions: The count of all completed orders captured through the purchase event.
- First-time purchaser count: The number of users who made their first-ever purchase.
- Cost per conversion (if linked with Google Ads): The amount spent for each completed conversion.
New vs returning users analytics shows which audience delivers higher conversions. It also shows which needs more nurturing.
Loyalty and Retention Metrics
Loyalty and retention metrics show how often people return and how valuable your returning users are. These insights help you build long-term relationships.
- Active Users (DAU, WAU, MAU): Measures how many users return and stay active on your site each day, week, or month.
- Returning Users: Shows the number of users who come back after their first visit, indicating loyalty.
- User Engagement: Tracks total engaged time to reveal how actively users interact with your content.
- Average Engagement Time per User: The average time each user spends engaged during their visits.
- Engagement Rate: Measures the percentage of sessions that count as engaged, reflecting deeper interaction.
- Key Event Count (Conversions): Counts the number of important actions (such as purchases or signups) users complete.
- Event Count per User: Shows the average number of actions per user, highlighting engagement strength.
These WordPress user behavior stats help you strengthen user retention and identify what keeps visitors engaged across multiple visits.
How to Analyze New vs Returning Users in GA4 (Step-by-Step Guide)
Understanding new vs returning users in GA4 starts with knowing where these metrics appear. It also helps to know how to add them if they don’t show by default.
GA4 provides several reports that help you compare behaviors, retention, and content performance across both audience types.
1. Where You Can See New vs Returning Users in GA4
Below is the complete list of Google Analytics 4 reports. In them you can view or add New Users and Returning Users metrics.
3. Retention Report
5. User Attributes Reports
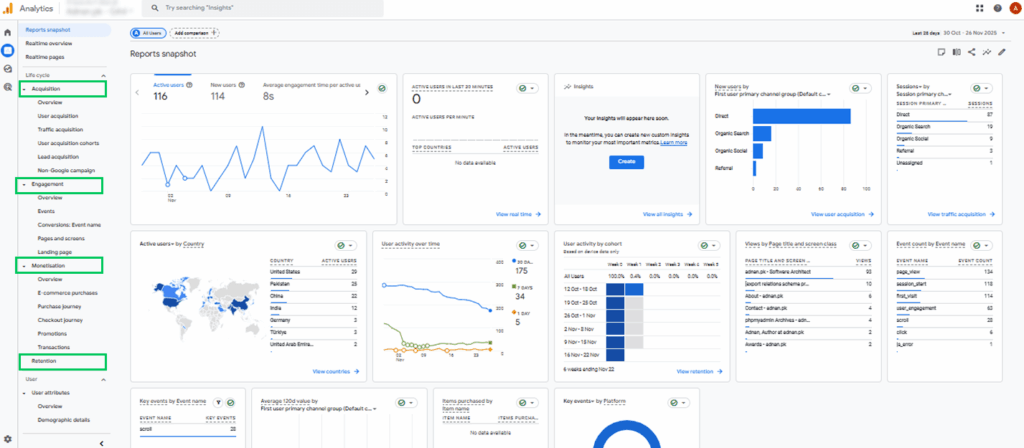
These are the simplest places to compare New Users vs Returning Users visually.
2. If New vs Returning User Metrics Are Missing, Add Them First
In reports such as Engagement, User Acquisition, Traffic Acquisition, or User Attributes, you will typically see New Users and Returning Users in the metrics section.
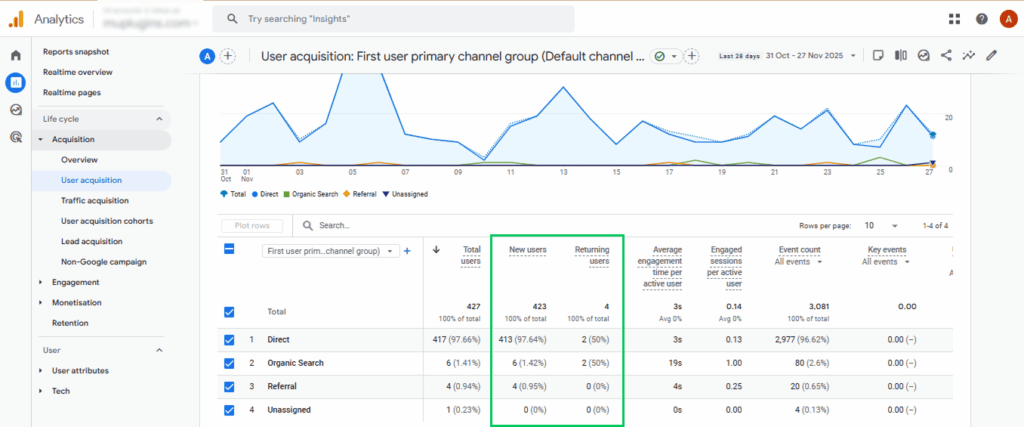
However, if these metrics do not appear by default, you need to add them manually. Follow these steps:
Steps to Add “New Users” and “Returning Users” to Any Report
- Open any report (e.g., User Acquisition).
- Click the Customize Report icon (top-right, looks like a pencil).
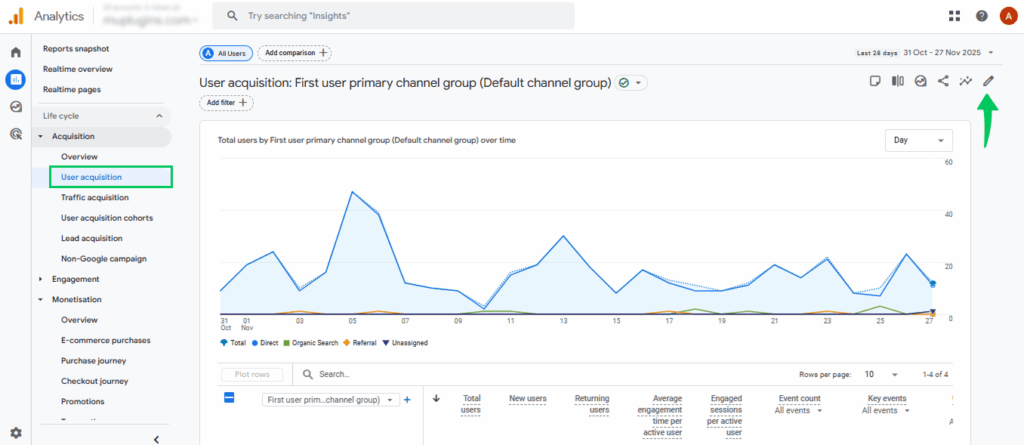
- Go to Metrics.
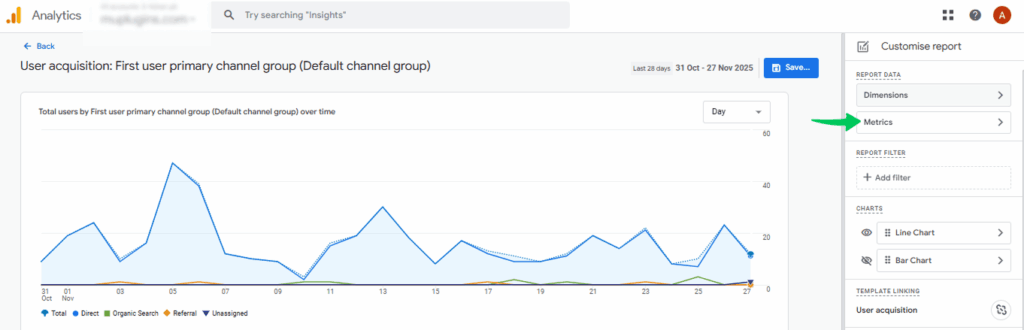
- Click Add Metric.
- Search for:
- New Users
- Returning Users (may appear as Active Returning Users in some accounts)
- New Users
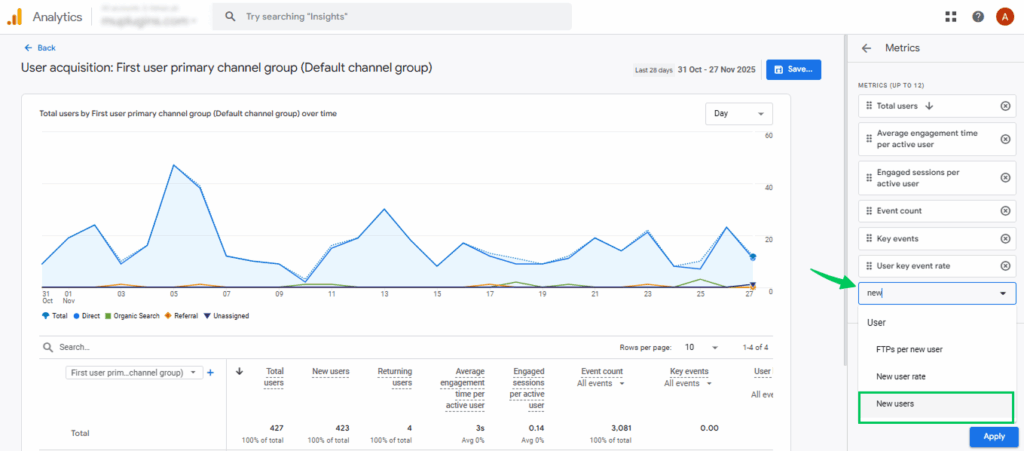
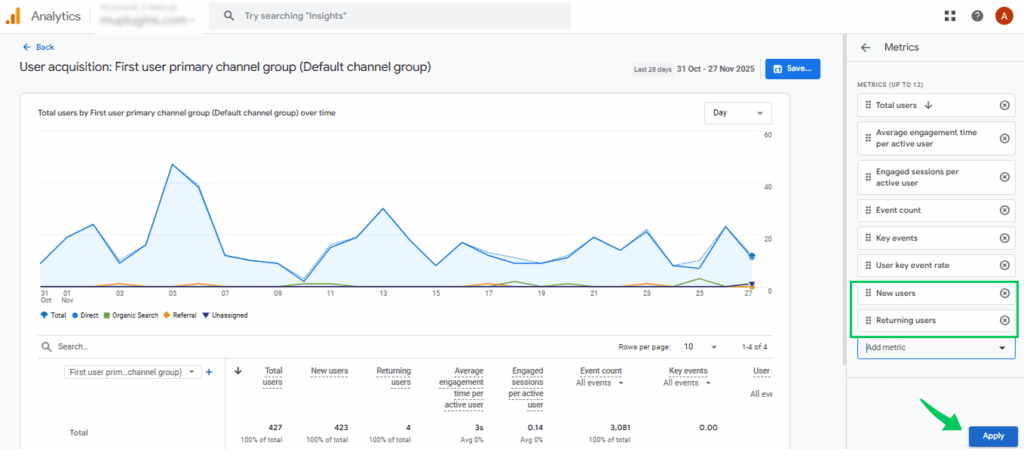
- Select the metrics, then click the Apply tab to apply them to the report.
- Then, click on the Save tab to save the report.

Now these metrics will appear every time you open the report.
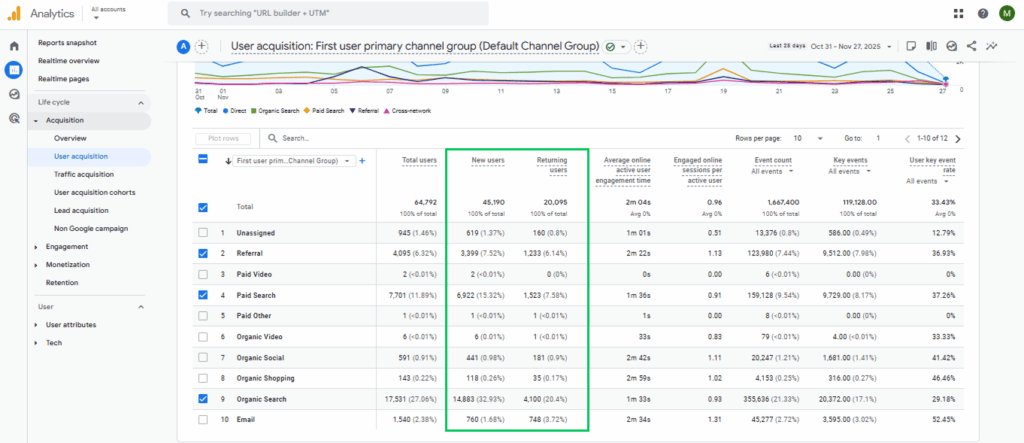
3. Compare New vs Returning Users Across GA4 Reports
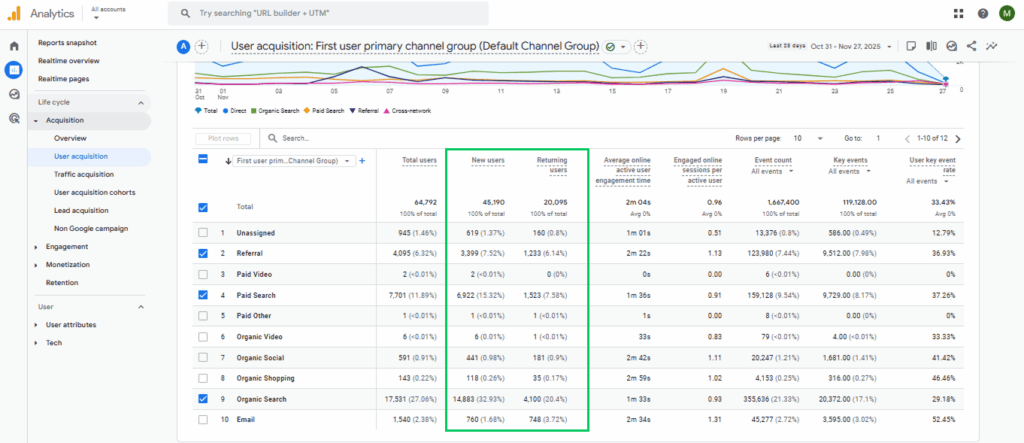
Confirm that every report shows the New Users and Returning Users metrics. Then open any GA4 report and review the table to compare both audiences side by side.
Note: Make sure you have added the metrics through the Customize Report option so the comparison appears.
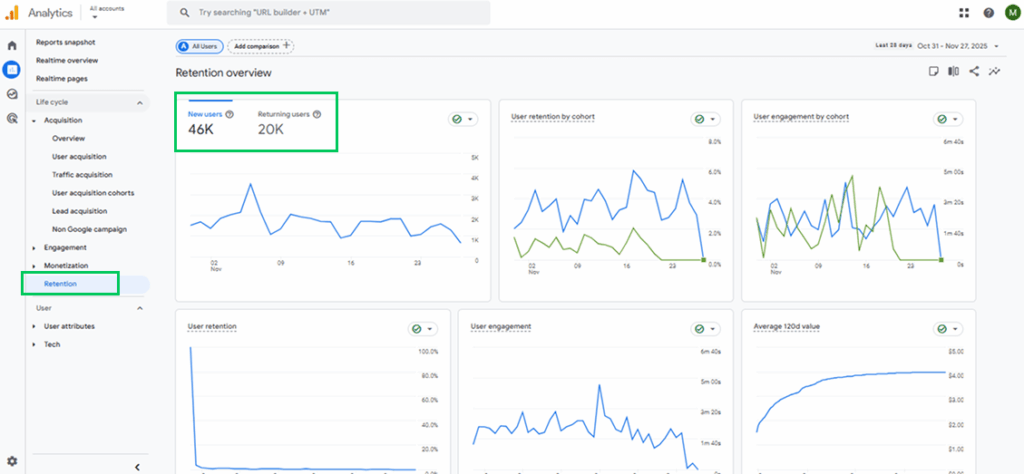
Once the metrics are visible, analyze them inside multiple reports. You see how each group behaves across different stages of the user journey. Reports such as:
- User Acquisition Report
- Retention Report
- Key Events Report
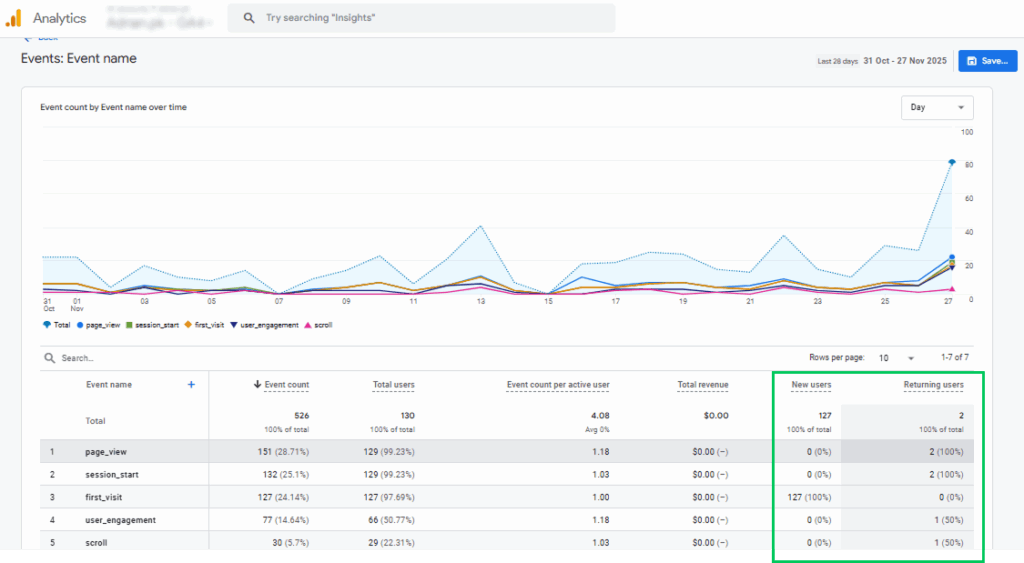
Check these metrics the same way in all reports. You can then consistently evaluate how new visitors interact and how returning users engage, convert, and stay loyal over time.
This helps you understand which campaigns attract first-time visitors and which ones build strong long-term loyalty.
4. Create Segments for New vs Returning Users (Explore Report)
Once you’ve reviewed the built-in reports, create dedicated segments for New and Returning Users. This lets you analyze their behavior more closely.
Segmentation gives you deeper insights by allowing you to compare both user groups side by side. To create these segments, follow the steps below:
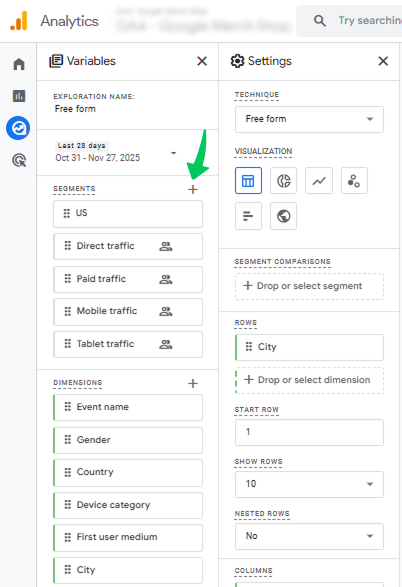
- Go to Explore in the left menu.
- Open Free Form or start a new exploration.
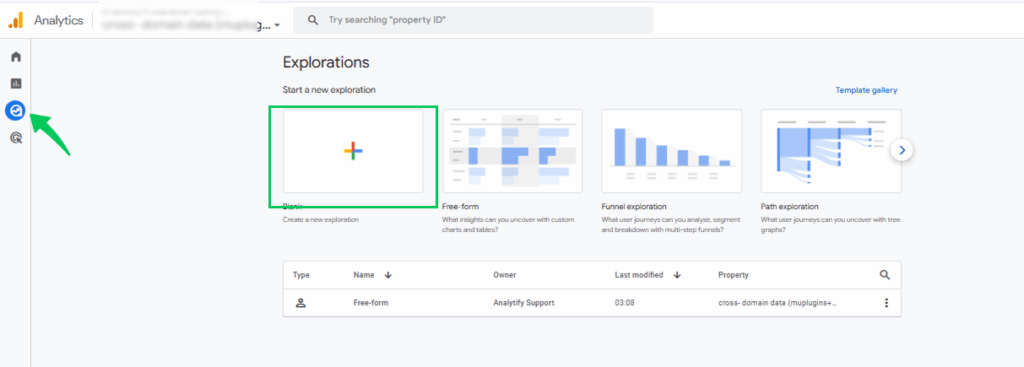
- In the left panel, click on the plus sign in front of Segments.
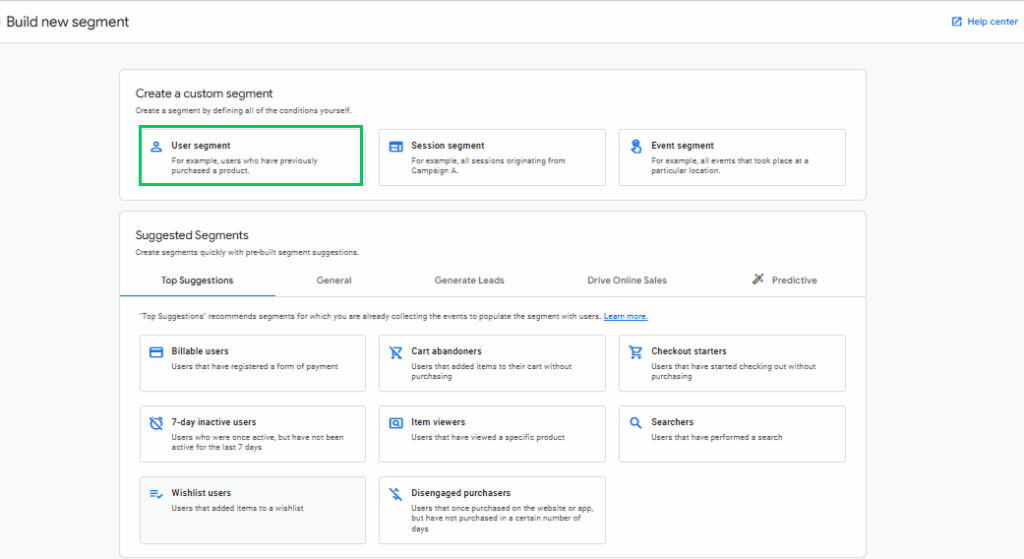
- Choose User Segment.
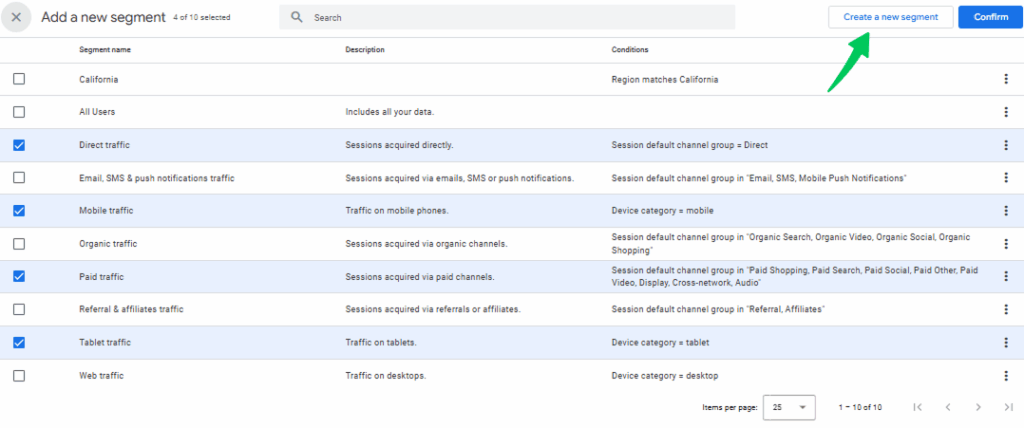
- Click on the Create a new segment tab.
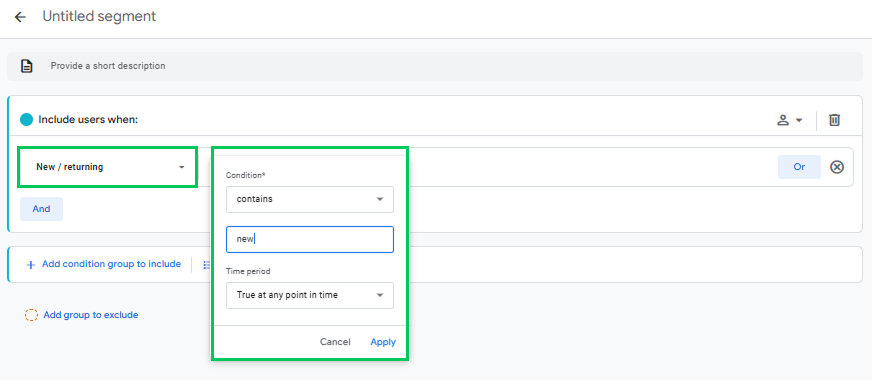
- Create two segments and follow the given conditions. For segment 1, in your “Condition” box, enter:
- Condition: contains
- Value: new
- Time period: True at any point in time
- Segment Name: New Users Segment
This will include users whose new/returning status = new.
For segment 2 in your “Condition” box, enter:
- Condition: contains
- Value: returning
- Time period: True at any point in time
- Segment Name: Returning Users Segment
This will include users whom GA4 has identified as returning visitors.
- Apply both segments.

- Add metrics like engagement time, conversions, key events, and page views.
- Now you can see that this allows a side-by-side comparison inside the Explore workspace.
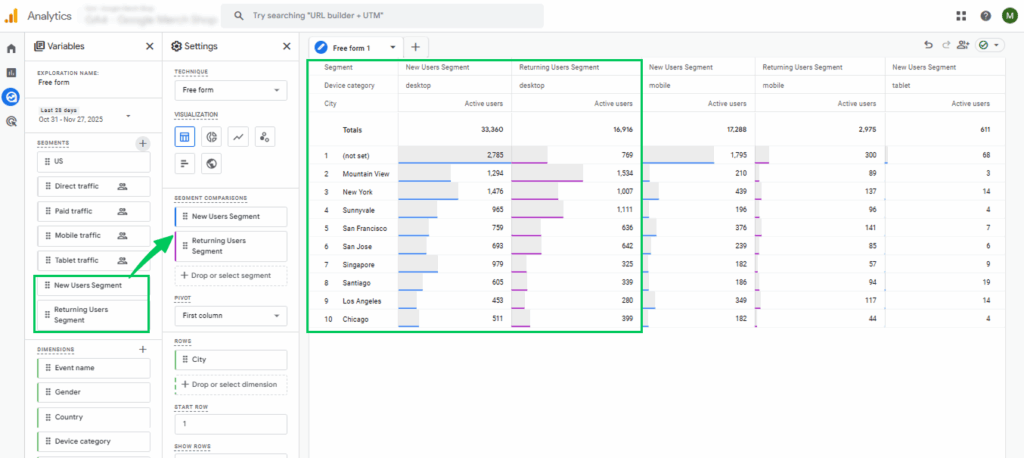
5. How to Interpret the Results
If New Users Are High but Returning Users Are Low:
- You’re attracting new traffic but failing to retain it.
- Possible issues include weak content, slow page load times, confusing UX, and no return incentives.
- Improve engagement, CTAs, internal linking, and content structure.
If Returning Users Show Higher Engagement:
- Your content builds trust, authority, and loyalty.
- This is a strong signal that users find value and keep coming back.
If Returning Users Convert More Often:
- Your site performs better with warm users who already know your brand.
- Retargeting and email marketing can further strengthen results.
If Both Groups Perform Well:
- You have a balanced growth pattern.
- It shows strong acquisition + retention, a powerful combination for long-term WordPress growth.
Using Analytify to Simplify Returning Visitor Analysis
Join 50,000+ beginners & professionals who use Analytify to simplify their Google Analytics!
Tracking returning visitors in GA4 can be challenging. Its interface is complex. You must navigate multiple reports, filters, and configurations to see basic trends.
Analytify solves this problem by bringing all your GA4 data into a single, easy-to-read WordPress dashboard.
Analytify is one of the best WordPress Google Analytics plugins. It integrates with GA4 and simplifies complicated metrics into clear, visual reports.
Once Analytify is connected, you can immediately see new and analytify returning visitors right inside your WordPress dashboard. If you haven’t connected it yet, follow our guide: How to Set Up Google Analytics 4 and Connect it to Your WordPress Site?
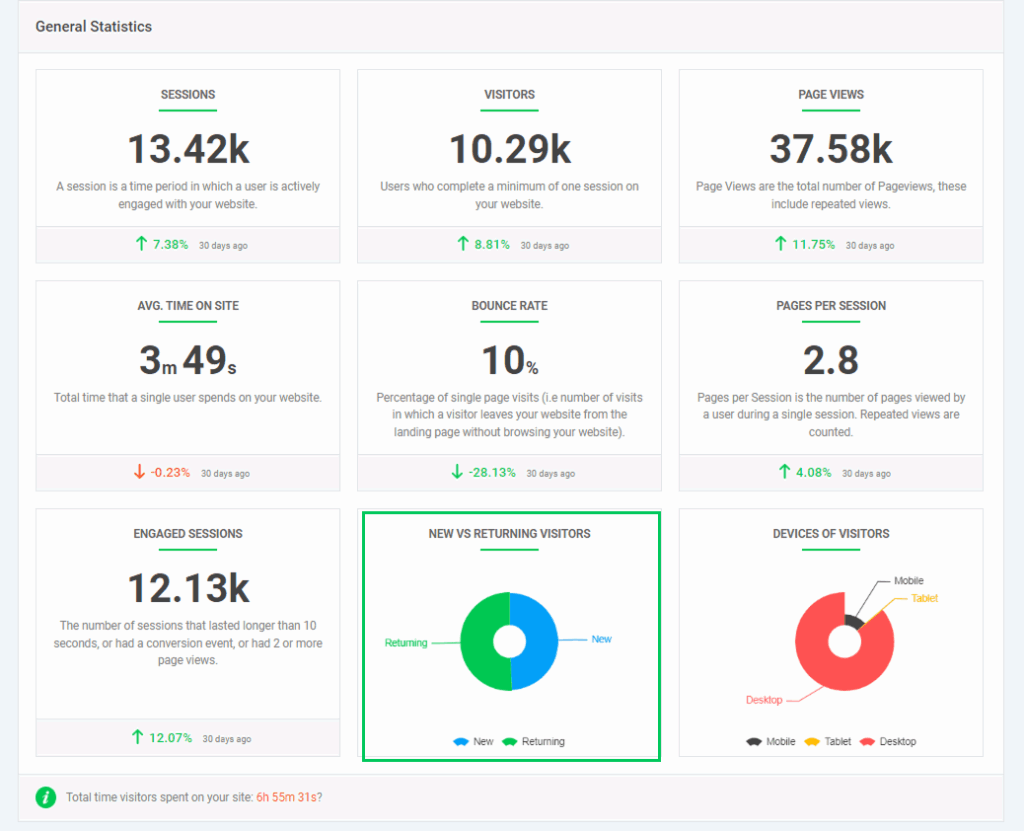
Analytify highlights both groups with clean graphs and percentages. You get a quick snapshot of visitor loyalty without any manual setup.
This instantly shows how many people come back to your site. It also shows how engagement changes and which content encourages repeat visits.
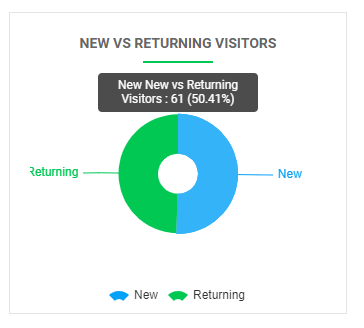
After viewing your new vs returning users, explore the full Analytify dashboard. All your essential statistics are organized in one place.
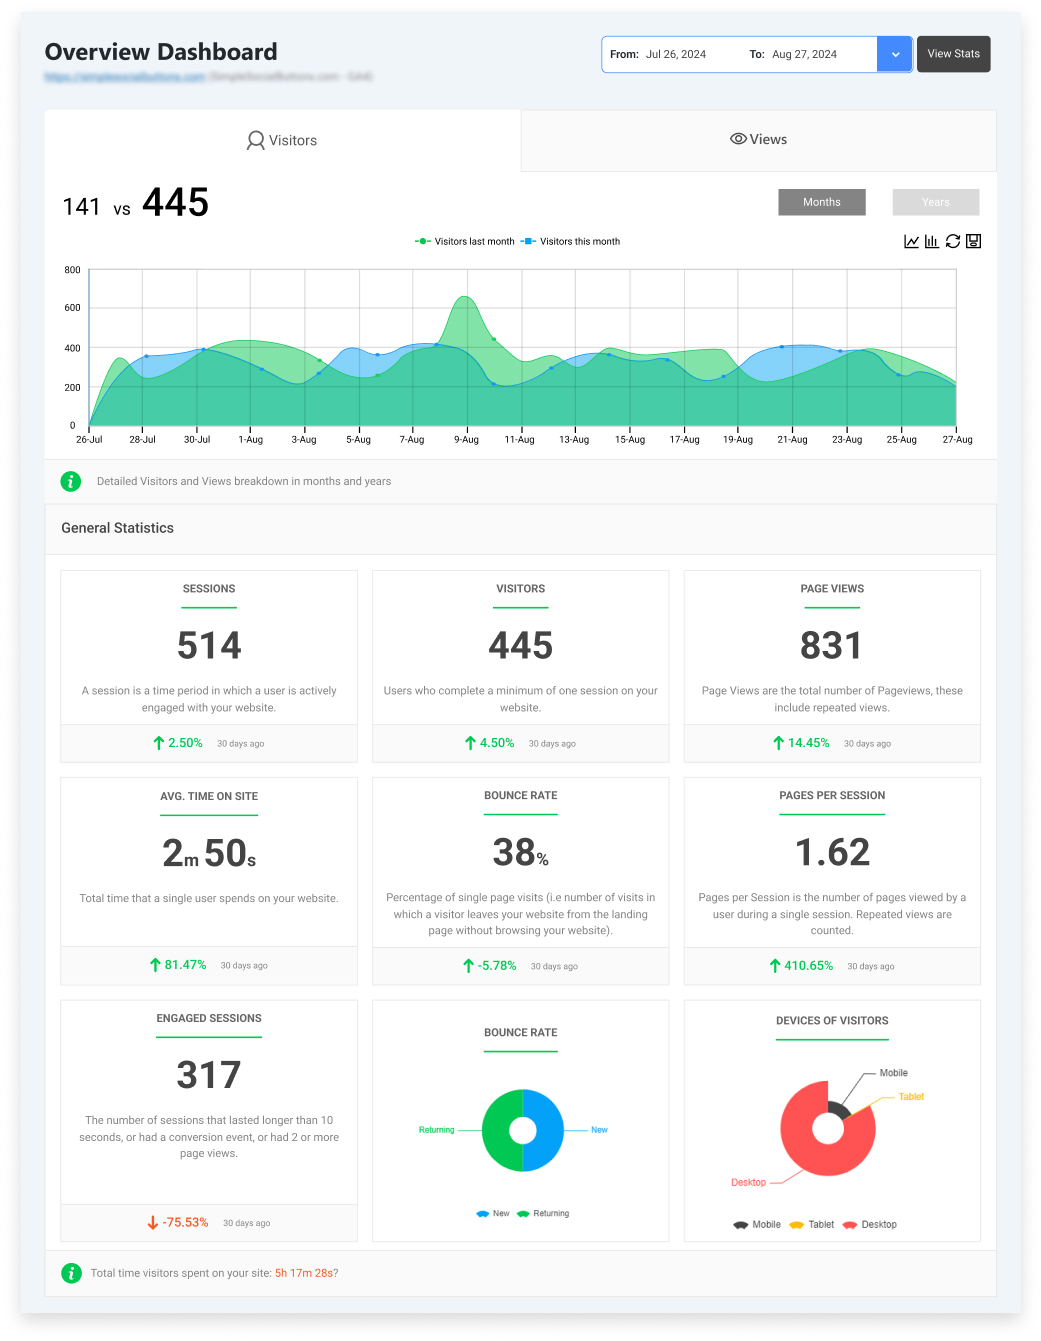
From WordPress user behavior stats to engagement trends, everything is laid out visually. You can understand your audience without digging through GA4 reports.
One standout feature of Analytify is the real-time traffic dashboard. It lets you track live user activity on your website.
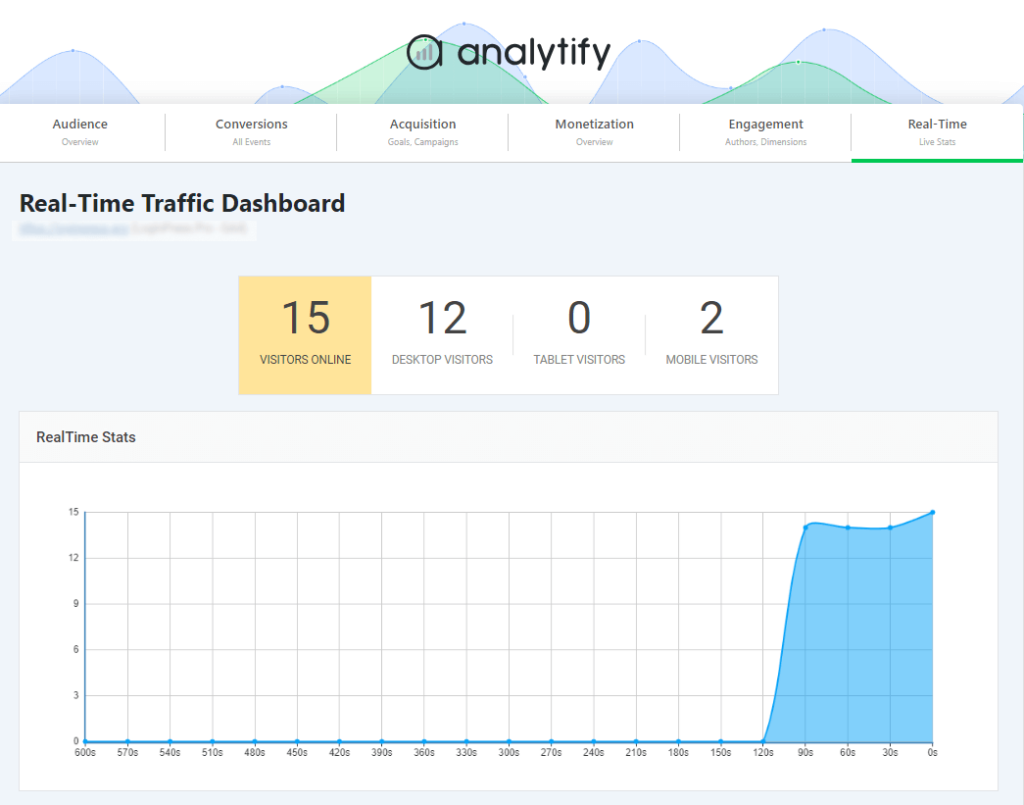
You can see who is on your site right now. You can also see which pages they browse and how they interact with your content. This is extremely useful for monitoring active campaigns, launches, or peak traffic moments.
Unlike GA4, there’s no need to configure complex segments or filters. Analytify collects, organizes, and presents everything automatically.
Together, these features turn GA4’s complicated data into a user-friendly experience. You understand your audience, strengthen engagement, and track returning visitors with complete clarity.
Expert Strategies to Increase Returning Users
Increasing returning users is one of the strongest ways to grow your website. Returning visitors engage more, convert better, and build long-term trust.
Here are key strategies to boost loyalty using content, engagement techniques, and better user experience:
1. Optimizing Content for Loyalty
Fresh, helpful content is one of the best ways to turn new users into loyal returning visitors. Strong content encourages people to revisit your site. GA4 makes it easier to analyze returning users and see what works.
- Update evergreen content: Refresh timeless posts with new stats, examples, and tips. This keeps returning users engaged and maintains strong WordPress user behavior stats.
- Add personalized recommendations: Suggest related posts, products, or guides based on user behavior to boost repeat visits.
- Create value-focused content: Returning users often seek in-depth, problem-solving content, so offer guides, tutorials, and ongoing updates.
2. Engagement Tactics
Engagement tactics help you stay connected with your audience even after they leave your website. These methods encourage users to revisit, strengthening both engagement and conversions.
- Email newsletters: Send helpful updates, new content alerts, or exclusive resources to bring users back regularly.
- Push notifications: Short, targeted notifications can remind users of new posts, offers, or features, keeping your site top-of-mind.
- Retargeting campaigns: Use ads to reconnect with past visitors. New vs returning users analytics shows how well this improves return rates.
3. UX and Navigation Improvements
A smoother, faster, and more intuitive website experience is essential for turning first-time visitors into repeat users. Better UX naturally increases return visits and strengthens your overall performance.
- Improve site speed: Faster loading times reduce frustration and increase the chances of users coming back.
- Use clear CTAs: Simple, visible calls to action show users what to do next. This improves engagement and long-term retention.
- Enhance mobile experience: Since many users return through mobile devices, improving navigation, layout, and readability boosts user satisfaction.
Advanced Tips for Interpreting User Behavior in WordPress
Three advanced techniques interpret WordPress user behavior: cohort analysis, traffic-source segmentation, and predictive engagement insights. Here is each one:
1. Cohort Analysis
Cohort analysis is a way to understand how specific user groups behave over time. A cohort is a group of users who share a common characteristic, usually the date they first visited your site.
By grouping users based on their acquisition date, you can compare how each cohort engages with your website.
This makes it easier to see which groups return more often. You also see which interact more with your content and how behavior shifts week after week.
These insights help you identify strong content, improve retention, and adjust your strategy to keep users coming back.
2. Segmenting by Traffic Source
Not all traffic behaves the same, and that’s why segmenting users by traffic source is so valuable. Start by grouping users by source: organic search, email campaigns, social media, or referral links.
This makes it easier to identify which channels bring loyal or high-engagement users, and which channels need more attention.
With tools like GA4 and Analytify, you can quickly compare session duration, pages viewed, and return visits for each source. Use the results to optimize your marketing.
3. Predictive Engagement Insights
If you want to stay ahead, predictive analytics helps you understand your audience’s future behavior. GA4’s predictive metrics show how likely users are to return, engage, or convert based on past actions.
These insights help you forecast return visitor trends and identify users with high conversion potential. You can then plan content or campaigns accordingly.
When paired with Analytify’s simplified reporting inside WordPress, you can make better decisions without leaving your dashboard. See how Analytify stacks up against the other Google Analytics plugins for WordPress.
Frequently Asked Questions About New vs Returning Users
1. Which GA4 report shows where users are coming from?
GA4 shows where users are coming from in the Traffic Acquisition report, helping you understand overall WordPress user behavior. This report breaks down all traffic sources, including Organic Search, Social, Email, and Referral channels. You can also switch to Source/Medium to get even deeper insight into which platforms drive quality visitors.
2. How do I find new vs returning users in GA4?
You can find new vs returning users in every GA4 report, after adding new user and returning user as metrics. This section shows a clear breakdown of first-time visitors and returning visitors, helping you understand user loyalty and repeat engagement. You can also analyze returning users in GA4 by checking their session activity, time spent, and conversions.
3. What does Google Analytics use to distinguish between new and returning users?
Google Analytics uses a unique device ID or user ID to differentiate new vs returning users. When someone lands on your site for the first time, GA4 records them as a new user. If the same device or user ID returns later, they are counted as a returning visitor. This is the foundation for new vs. returning user analytics and helps you measure long-term engagement metrics in GA4.
4. What is the total users vs new users vs returning users?
Total Users represent all visitors, both new and returning, during a given period. New Users are first-time visitors to your site, while Returning Users are people who have returned after a previous visit. Comparing these metrics helps you understand overall reach, loyalty, and which users engage the most.
5. Can Google Analytics recognize returning users?
Yes, Google Analytics can recognize returning users by matching stored user IDs or device IDs from past visits. When someone comes back using the same browser or device, GA4 tracks them as a returning visitor. This makes it easy to analyze returning users in GA4 and measure loyalty, engagement, and repeat conversions.
Final Thoughts: New vs Returning Users
This guide explored why tracking new vs returning users matters. It also showed how these insights support your WordPress growth. You learned how engagement metrics in GA4 reveal what attracts first-time visitors and what keeps returning users active.
We also covered step-by-step methods for viewing and customizing new vs returning user analytics across GA4 reports. We showed how to create user segments and interpret results to understand your WordPress user behavior stats.
Finally, you learned strategies to increase returning users through content updates, engagement tactics, and UX improvements. You also learned advanced techniques such as cohort analysis and traffic-source segmentation.
Combine GA4 insights with Analytify’s simplified WordPress dashboards. You can easily analyze returning users in GA4 and improve engagement. You can also build a website that turns visitors into loyal repeat users.
For your better understanding, you can read:
- Analyzing Content Engagement with Google Analytics 4 Funnels
- How to Add a User to Google Analytics Easily
- 11 Key Customer Engagement Metrics To Measure
Which group performs better on your site, new users or returning users? Share your experience or questions below, we’d love to hear your findings!