9 Best User Behavior Analytics Tools (2026)

User behavior analytics tools show you exactly how visitors interact with your website or app. They reveal where users click, where they stop scrolling, where they drop off, and what drives them to convert.
Choosing the right tool depends on what you need: traffic analysis, heatmaps, session recordings, or product-level event tracking.
In this article, I’ll share 9 best user behavior analytics tools and compare their features, pricing, and benefits to help you choose the right one.
User Behavior Analytics (TOC)
What Is User Behavior Analytics?
User behavior analytics is the process of tracking and analyzing how users interact with a website or app. It identifies patterns in clicks, scrolls, page visits, form submissions, and drop-off points to help businesses improve user experience and increase conversions.
What user behavior analytics tracks:
- Clicks and taps on buttons, links, and images
- Scroll depth on pages and landing screens
- Page visits and the order users navigate through them
- Time spent on individual pages
- Form interactions: fields completed, abandoned, or skipped
- Video plays, downloads, and other engagement events
What Does User Behavior Tracking Tell You?
User behavior tracking reveals navigation patterns, engagement hotspots, drop-off points, and behavioral trends. This data tells you what is working on your site, what is causing friction, and where to focus improvements for better conversions.
| Insight Type | What It Shows | Business Action |
|---|---|---|
| Navigation patterns | How users move between pages and in what order | Improve site structure and internal linking |
| Engagement hotspots | Most clicked buttons, most-read content, highest-traffic pages | Prioritize and replicate what works |
| Drop-off points | Where users leave a checkout, form, or sign-up flow | Fix the friction causing abandonment |
| Behavioral trends | Repeated actions: frequent searches, return visits to specific pages | Create content and features for high-demand areas |
| Device behavior | How mobile vs. desktop users interact differently | Optimize the weaker experience |
Benefits of User Behavior Analytics
The main benefits of user behavior analytics are improved user experience, higher conversion rates, personalized marketing, better decision-making, and reduced churn. These advantages apply across all types of user behavior analytics software, from free tools to enterprise platforms.
| Benefit | What It Means in Practice |
|---|---|
| Improved user experience | Find and fix friction points before they drive users away |
| Higher conversion rates | Identify exactly where users drop off and remove those barriers |
| Personalized marketing | Use behavioral segments to deliver campaigns matched to user intent |
| Better decisions | Replace assumptions with real data on what users actually do |
| Reduced churn | Spot early warning signs in behavior before users cancel or leave |
Key Metrics in Behavioral Analytics
The most important behavioral analytics metrics are heatmaps, session duration, bounce rate, conversion funnels, and event tracking. Monitoring these consistently gives you a complete picture of how users engage with your platform.
| Metric | What It Measures | What a Poor Score Signals |
|---|---|---|
| Heatmaps | Where users click, scroll, and hover on a page | Key content or CTAs are being missed |
| Session duration | Average time users spend per visit | Content is not relevant or engaging enough |
| Bounce rate | Users who leave after one page without interacting | Page does not match user intent or loads too slowly |
| Conversion funnels | User paths from start to goal completion | Drop-off at a specific step requiring a fix |
| Event tracking | Specific actions: button clicks, video plays, form submissions | Key features or CTAs are underperforming |
Best User Behavior Analytics Tools: Comparison Table
Below is a quick comparison of the best user behavior analytics tools based on their key features and pricing:
| Tool | Key Features | Free Version | Starting Price (Paid Plans) |
| Google Analytics | Behavior flow, audience segmentation, event tracking | Yes (GA4) | $50,000/year (GA360) |
| Analytify | WordPress integration, heatmaps, campaign tracking | Yes (limited features) | $99/year (Pro plan) |
| Hotjar | Heatmaps, session recordings, feedback tools | Yes (limited features) | $32/month (Observe plan) |
| Crazy Egg | Heatmaps, A/B testing, confetti reports | No | $29/month (Basic plan) |
| Mixpanel | Funnel analysis, cohort tracking, event monitoring | Yes (limited events) | $25/month (Startup plan) |
| FullStory | Session replays, heatmaps, conversion analysis | Yes (limited features) | Contact for pricing |
| Smartlook | Session recordings, event tracking, funnel analysis | Yes (limited features) | $55/month (Pro plan) |
| Heap Analytics | Auto event tracking, behavioral cohorts, real-time data | Yes (limited features) | Contact for pricing |
| Kissmetrics | Customer journey tracking, revenue analysis, cohorts | No | Contact for pricing |
Join 50,000+ beginners & professionals who use Analytify to simplify their Google Analytics!
9 Best User Behavior Analytics Tools (2024)
Understanding and optimizing user behavior is essential for any business. Here’s a list of the best user behavior analytics tools in 2024. Each tool is evaluated based on its features, pricing, and suitability for different needs.
1. Google Analytics
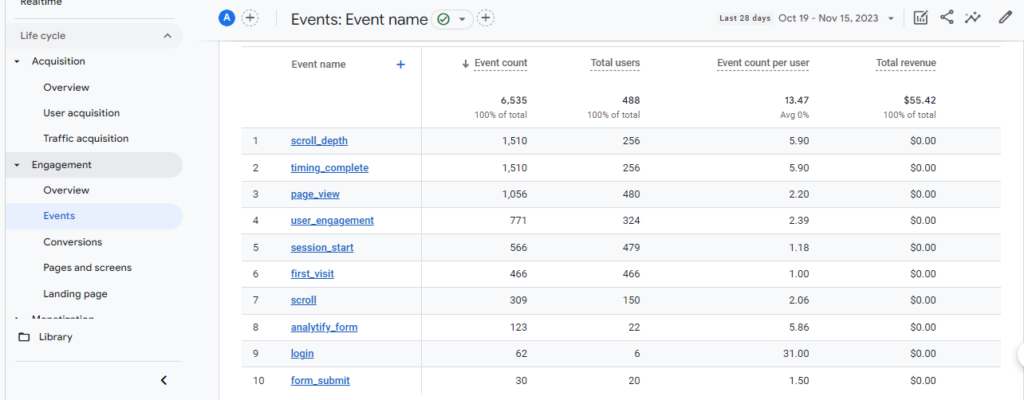
Google Analytics 4 is the most widely used web analytics platform in the world. It tracks user behavior through event-based reporting, giving you detailed data on traffic sources, engagement, and conversions. It is free for most businesses.
Key features:
- Behavior flow reports: visualize the paths users take through your site
- Event tracking: monitor clicks, downloads, video plays, and custom events
- Audience segmentation: analyze specific user groups for targeted insights
- Real-time reporting: see live user activity as it happens
- Search Console integration: connect keyword data to behavioral metrics
| Plan | Cost | Best For |
|---|---|---|
| GA4 Standard | Free | All businesses |
| Google Analytics 360 | From $50,000/year | Large enterprises needing higher data limits and SLA support |
Best for: Businesses of all sizes needing free, comprehensive web analytics with deep Google ecosystem integration.
2. Analytify
Analytify is the best user behavior analytics tool for WordPress users. It connects GA4 directly to your WordPress dashboard, turning complex analytics data into simple, readable reports without requiring technical expertise..

Key features:
- GA4 integration inside WordPress: all behavior data visible without opening GA4
- General statistics: sessions, bounce rates, page views, new vs. returning visitors
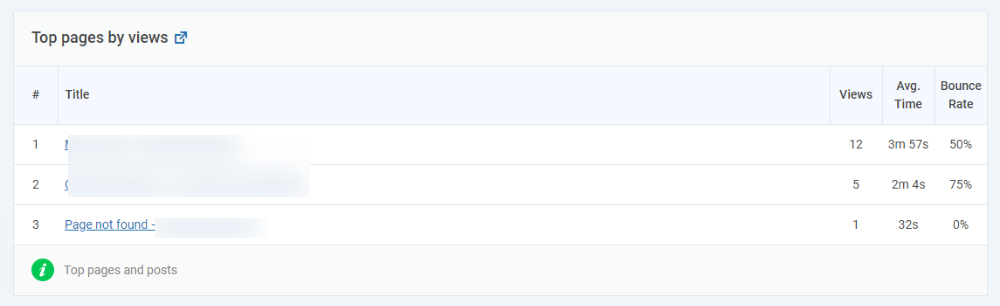
- Top pages report: see which content attracts the most traffic
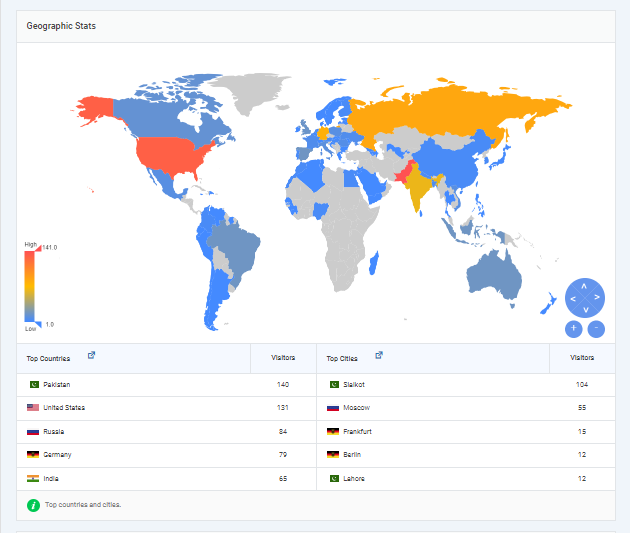
- Geographical Data: Visualize visitor locations with a map highlighting countries and cities driving traffic to your site.
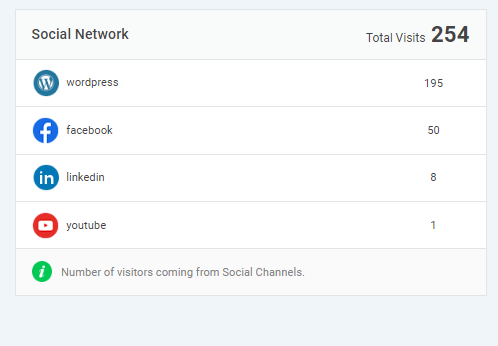
- Social Media Statistics: Assess the effectiveness of your social media efforts by tracking traffic from various platforms.
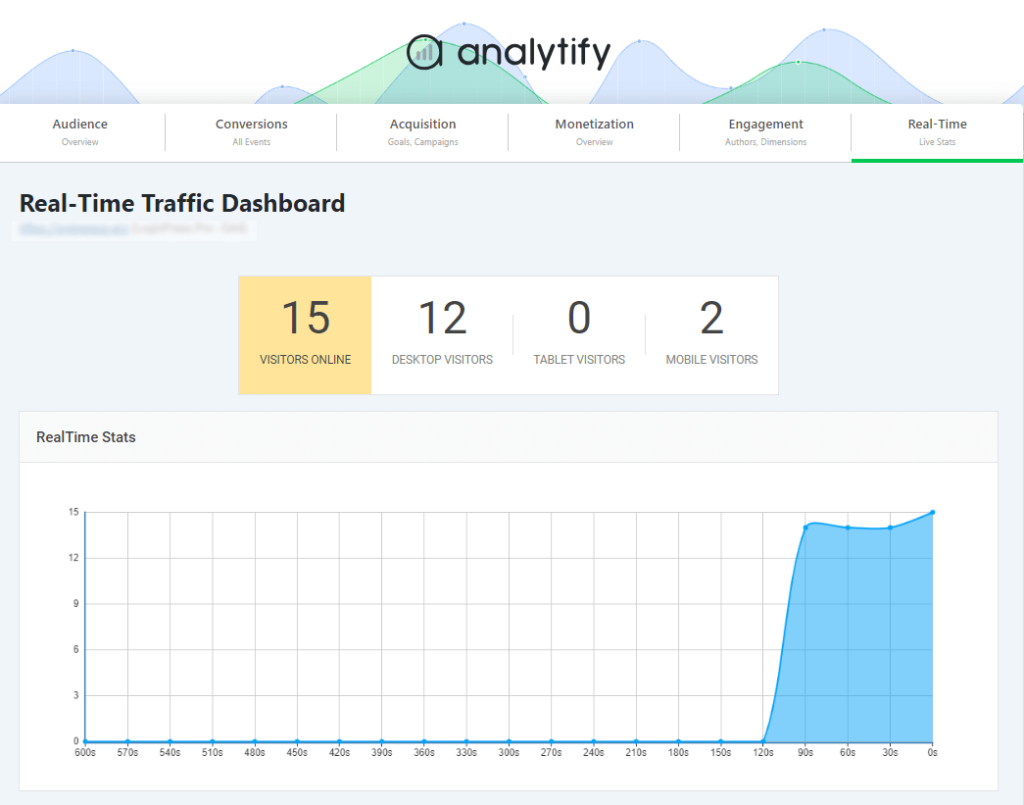
- Real-Time Reporting: View live data on current visitors, including their locations and active pages, enabling immediate insights into user engagement.
- System Statistics: Analyze the operating systems, browsers, and devices your visitors use, aiding in optimizing your site’s compatibility and performance.
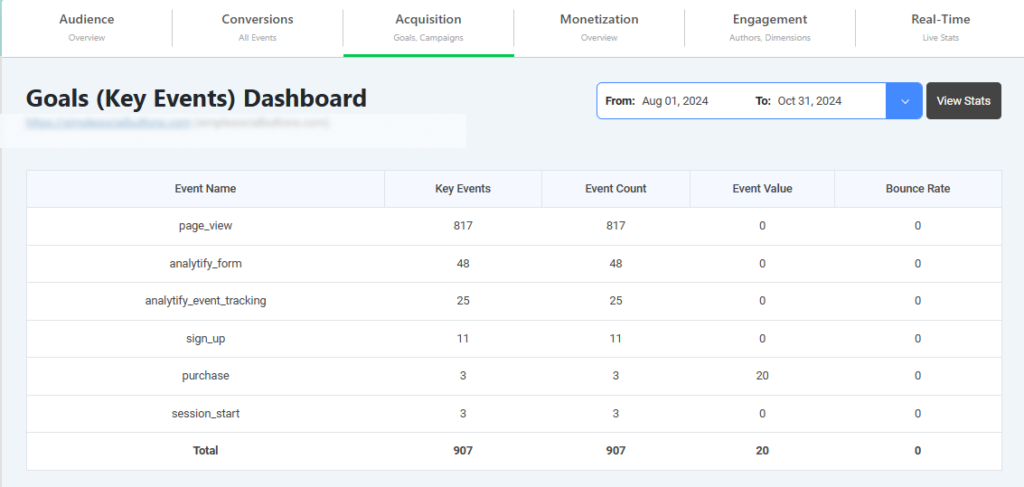
- Goal Tracking: Monitor goal completions, conversion rates, and related metrics to evaluate the effectiveness of your website in achieving desired actions.
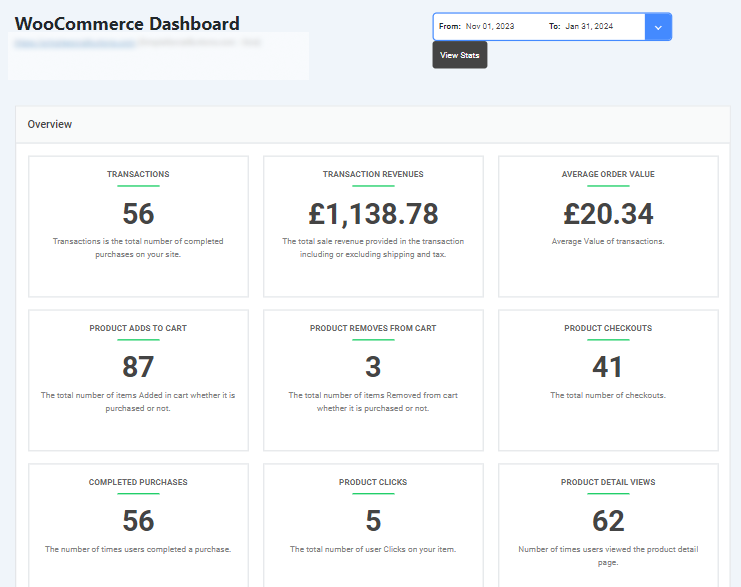
eCommerce Compatibility: Offers in-depth analytics for WooCommerce and Easy Digital Downloads, making it perfect for online stores.
By presenting this data in an accessible and user-friendly manner, Analytify enables you to make informed decisions to enhance user experience and achieve your website’s objectives.
- Pricing:
- Free Version: Provides basic features for small sites or beginners.
- Premium Plans: These start at $99/year and go up to $499, and they offer advanced reports, campaign tracking, and priority support.
If you’re looking for a tool that integrates seamlessly with WordPress and prioritizes ease of use, Analytify is the perfect choice for you!
3. Hotjar
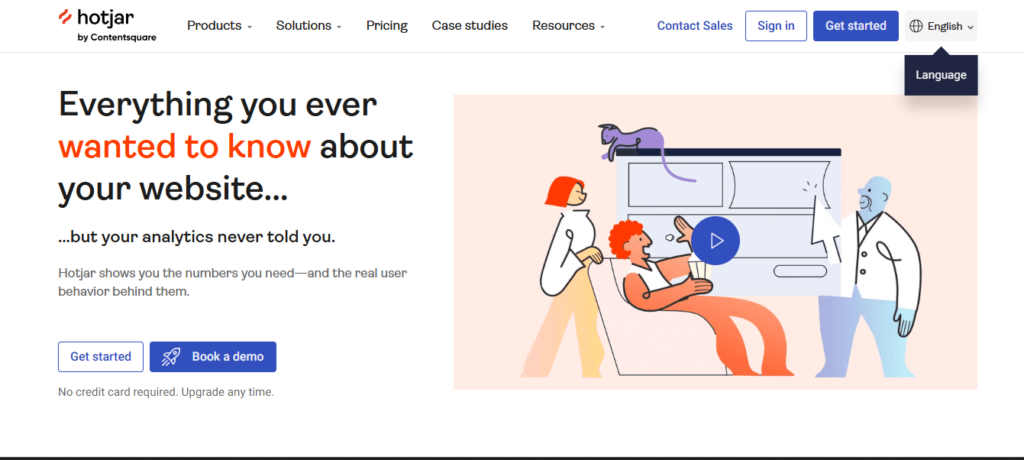
Hotjar provides visual user behavior insights through heatmaps, session recordings, and on-site feedback tools. It is one of the most popular tools for understanding what users do on individual pages.
- Key Features:
- Heatmaps: Visualize where users click, move, and scroll.
- Session Recordings: Watch real user sessions to identify usability issues.
- Feedback Polls and Surveys: Collect user opinions directly on your site.
- Conversion Funnels: Analyze where users drop off in key processes.
- Pricing:
- Basic Plan: Free with limited features.
- Plus Plan: $39/month, offering more sessions and data storage.
- Business Plan: Starts at $99/month for advanced features and increased data.
4. Crazy Egg
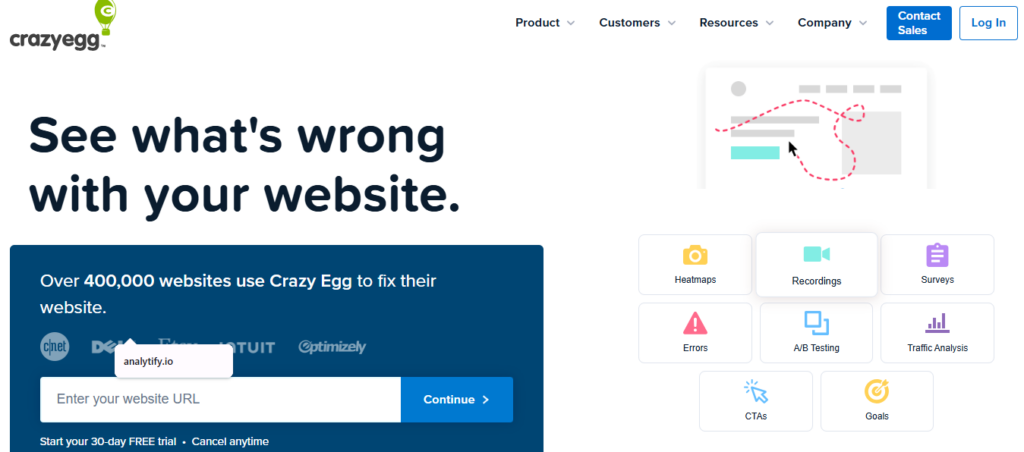
Crazy Egg offers heatmaps, scroll maps, confetti reports, and A/B testing to help businesses understand and improve page performance. Unlike Hotjar, it includes A/B testing natively.
- Key Features:
- Heatmaps and Scroll Maps: Understand user engagement on pages.
- Confetti Reports: Break down clicks by referral sources and other criteria.
- A/B Testing: Test different versions of pages to see what performs best.
- User Recordings: Watch individual user sessions to identify issues.
- Pricing:
- Basic Plan: $29/month for small websites.
- Standard Plan: $49/month with additional features.
- Plus Plan: $99/month for higher traffic sites.
5. Mixpanel
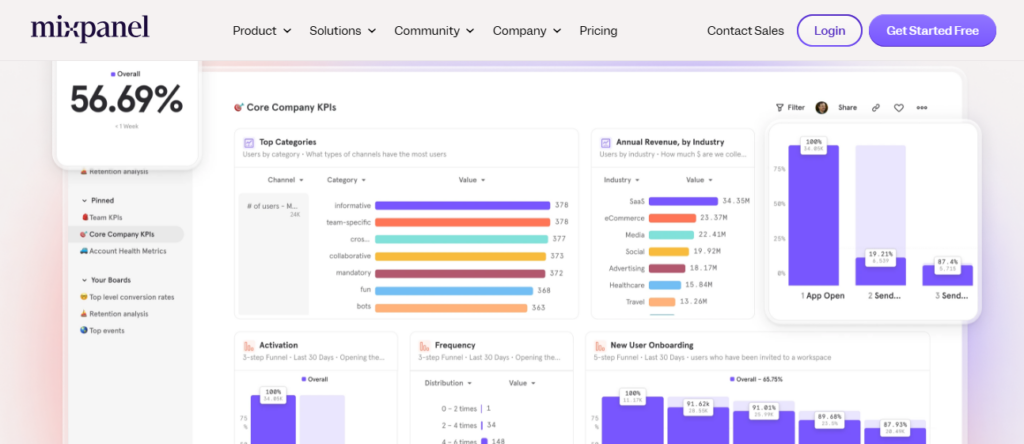
Mixpanel is a product analytics platform focused on individual user behavior. It tracks specific events, builds conversion funnels, and measures retention at the user level, making it ideal for SaaS and app products.
- Key Features:
- Event Tracking: Monitor specific user actions across platforms.
- Funnel Analysis: Understand conversion rates and identify drop-off points.
- Cohort Analysis: Analyze user retention over time.
- A/B Testing: Experiment with different features to see what users prefer.
- Pricing:
- Free Plan: Up to 20M events per month.
- Growth Plan: Starts at $25/month for additional features.
- Enterprise Plan: Custom pricing for large organizations.
6. FullStory
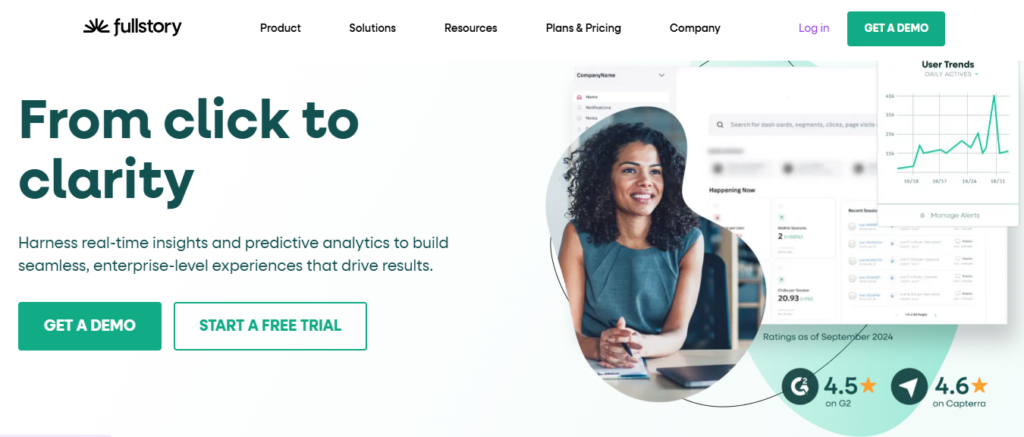
FullStory is a digital experience intelligence platform that combines session replay, heatmaps, error tracking, and AI-powered insights. It is built for teams that need deep behavioral analysis across complex web applications.
- Key Features:
- Session Replays: Watch how users interact with your site in real time to uncover usability issues.
- Heatmaps: Identify the most and least engaged areas of your site.
- Conversion Funnels: Analyze where users drop off in critical processes.
- Error Tracking: Detect and resolve bugs affecting the user experience.
- AI-Powered Insights: Automatically surface meaningful trends in user behavior.
- Pricing:
- Free Plan: Limited features with restricted session replays.
- Business Plan: Custom pricing based on the size and needs of the organization.
7. Smartlook
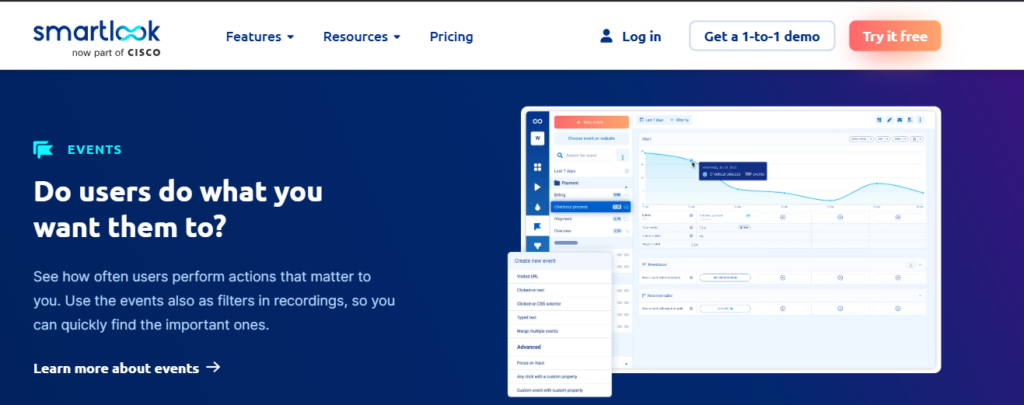
Smartlook is a beginner-friendly user behavior analytics tool offering session recordings, event tracking, and funnel analysis. It is more affordable than Hotjar or FullStory while covering the core visual analytics needs.
- Key Features:
- Session Recordings: Replay user actions to identify bugs or confusion.
- Event Tracking: Set up events without requiring complex coding.
- Funnel Analysis: Track and optimize the steps users take toward conversion.
- API Integrations: Integrates with tools like Slack, HubSpot, and Google Analytics.
- Pricing:
- Free Plan: Basic features and limited session recordings.
- Paid Plans: Start at $31/month for additional sessions and features.
8. Heap Analytics
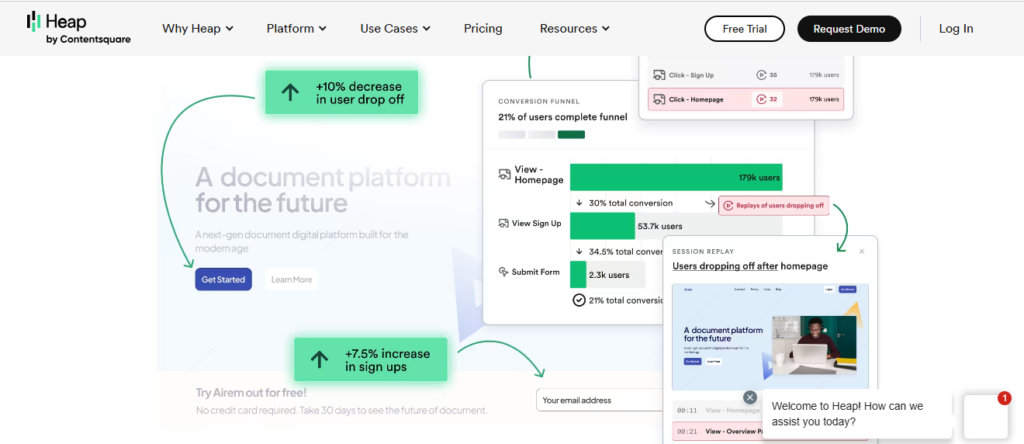
Heap Analytics automatically captures every user action on your site without requiring manual event setup. This makes it one of the fastest tools to get full behavioral data from day one.
- Key Features:
- Automatic Event Tracking: Tracks every user action on your site without manual configuration.
- Behavioral Cohorts: Segment users based on their actions to understand trends.
- Funnel Analysis: Visualize how users navigate through your site.
- Real-Time Reports: Access instant insights for faster decision-making.
- Pricing:
- Free Plan: Covers basic features for small businesses.
- Enterprise Plan: Custom pricing for advanced features and higher data limits.
9. Kissmetrics
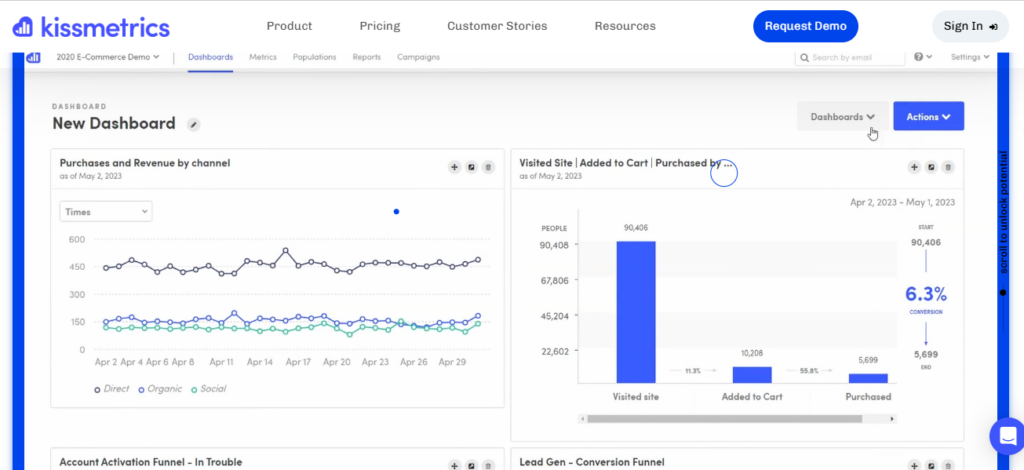
Kissmetrics tracks individual customer journeys from first visit to purchase and beyond. It is built for SaaS and ecommerce businesses that need to connect behavioral data to revenue and retention outcomes.
- Key Features:
- Customer Journey Tracking: See how individual users interact with your site.
- Funnel Analysis: Identify drop-off points and optimize conversions.
- Cohort Reports: Analyze user retention over time.
- Revenue Tracking: Understand the lifetime value of your customers.
- Pricing:
- Custom Pricing: Based on the size and needs of the business.
How to Use User Behavior Monitoring to Grow Your Business
User behavior monitoring drives business growth when you act on the data, not just collect it. The five highest-impact actions are: fixing drop-off points in user journeys, optimizing content layout, improving conversion funnels, personalizing experiences by segment, and using behavioral data to guide A/B tests.
| Growth Action | How Behavioral Data Guides It | Tool to Use |
|---|---|---|
| Fix drop-off points | Heatmaps and session recordings reveal exactly where users abandon a form or checkout | Hotjar, Smartlook, FullStory |
| Optimize content layout | Scroll maps show which sections users read; reorganize based on real engagement | Crazy Egg, Hotjar |
| Improve conversion funnels | Funnel reports show which step loses the most users; test alternatives | Mixpanel, Heap, Kissmetrics |
| Personalize user experiences | Behavioral cohorts reveal which segments respond to which content or offers | Mixpanel, Kissmetrics |
| Guide A/B testing | Identify underperforming elements first; test targeted changes based on behavior data | Crazy Egg, Mixpanel |
User Behavior Analytics (FAQ)
1. How does user behavior analytics work?
User behavior analytics works by placing a tracking script on your website or app that records user interactions in real time. The data, including clicks, scrolls, page visits, and session durations, is processed and displayed in dashboards, heatmaps, session recordings, and funnel reports. Businesses use these insights to identify friction, optimize flows, and improve conversion rates.
2. What are the examples of user behavior analytics?
Common examples of user behavior analytics include:
Heatmaps showing which areas of a landing page receive the most clicks
Session recordings of users abandoning a checkout form at a specific field
Funnel reports showing that 60% of users drop off at the payment step
Cohort analysis showing that users who watch a demo video retain at 2x the rate
Real-time dashboards showing a traffic spike after a social media post
3. What is the difference between UBA and UEBA?
User behavior analytics (UBA) focuses on how individual users interact with a website or product. User and entity behavior analytics (UEBA) is a cybersecurity concept that extends UBA to include non-human entities like servers, applications, and devices. UEBA is used to detect security threats and anomalies. UBA tools like those in this guide focus on product and website optimization, not security monitoring.
4. What is the meaning of behavior analytics?
Behavioral analytics is the study of how people interact with digital systems. It collects data on user actions and applies analysis to identify patterns, predict future behavior, and optimize experiences. In a marketing and product context, behavioral analytics helps businesses understand what drives engagement, conversions, and retention.
5. What are user behavior analytics tools?
User behavior analytics tools are software platforms that track, record, and analyze how users interact with websites and apps. They include heatmap tools, session recording platforms, product analytics software, and web analytics platforms. Examples include Google Analytics, Hotjar, Mixpanel, FullStory, and Analytify.
6. How do user behavior analytics tools help in business growth?
User behavior analytics tools drive business growth by replacing assumptions with data. They show you exactly where users struggle, what content performs best, and which steps in your conversion funnel lose the most people. Acting on these insights reduces friction, improves user experience, and increases conversion rates.
7. Why choose Analytify for behavioral analytics?
Analytify is the best user behavior analytics tool for WordPress because it brings GA4 data directly into your WordPress dashboard. You get real-time traffic, engagement metrics, top pages, geographic data, goal tracking, and WooCommerce analytics without leaving WordPress or navigating GA4’s complex interface. It starts at $99 per year, making it more affordable than most standalone behavioral analytics platforms.
Final Thoughts
The best user behavior analytics tool depends on what you need to measure and what platform you use.
| Your Situation | Best Tool |
|---|---|
| WordPress site wanting simple GA4 reporting | Analytify ($99/year) |
| Need heatmaps and session recordings | Hotjar or Smartlook |
| SaaS or app product team needing user-level data | Mixpanel or Heap Analytics |
| Need heatmaps plus A/B testing in one tool | Crazy Egg |
| Enterprise needing session replay with AI insights | FullStory |
| SaaS or ecommerce connecting behavior to revenue | Kissmetrics |
| General web analytics with no budget | Google Analytics 4 (free) |
Start with the tool that matches your current platform and analytics maturity. You can always layer in more specialized tools as your needs grow. If you’re a WordPress user, Analytify stands out for its simplicity and seamless integration.
We hope this article helped you choose the best user behavior analytics tool.
You may also like to read 9 Best Content Audit Tools to Improve Rankings (2024).
Want a broader view of your site’s performance? See How to Build a Website Analytics Dashboard for Your Business.
We would love to hear from you about which behavior analytics tool you found best for your needs.