How to Build AI-Optimized Reports Using Analytify (for Teams & Clients)

An AI-optimized analytics report is a structured summary of your WordPress analytics data that AI tools and large language models (LLMs) can read and interpret accurately.
With a clean report, AI tools such as LLMs and virtual assistants can spot trends, identify issues and give clear guidance.
Disorganized data causes misunderstandings and delays decisions. Analytify shows GA4 data in summarized dashboards inside WordPress, which gives you a cleaner starting point than raw GA4 reports.
I show you how to prepare your WordPress data, build AI-optimized analytics reports in Analytify, and share them with teams and clients. This guide is for site owners, agencies and marketers who report to clients or colleagues.
AI-Optimized Analytics Reports (TOC):
Preparing Your WordPress Data for AI Reporting
To prepare your WordPress data for AI reporting, filter irrelevant traffic, clean URLs, standardize naming and remove duplicates.
Raw analytics reports often include noise, so AI works best with clean, structured and consistent data.
The three most important metric groups to focus on are traffic, conversions, and engagement. These signals help AI understand both visibility and user behavior.
Raw analytics data isn’t AI-friendly because it often includes noise. This can mean mixed traffic sources, duplicate URLs, inconsistent naming, or inflated session counts from bots or internal visits.
When AI analyzes messy data, it may produce misleading insights or incorrect patterns. That’s why it’s important to build clean data summaries before using analytics reporting for AI.
General Data Preparation Steps
These steps apply to any analytics setup, not just one tool:
- Filter irrelevant traffic such as internal visits, bots, and spam.
- Clean URLs by removing unnecessary parameters and duplicates.
- Standardize page, event, and conversion naming, so AI reads them consistently.
- Remove duplicates caused by multiple URLs pointing to the same content.
Recommended Metrics for AI Analysis
| Metric Type | Example Metrics | Why AI Needs It |
| Traffic | Sessions, users, page views | Shows visibility trends |
| Engagement | Engagement rate, time on page | Measures content quality |
| Conversions | Sign-ups, downloads, purchases | Connects traffic to outcomes |
Once your data is clean and structured, AI can detect patterns more accurately and highlight meaningful changes. This general preparation makes it easier for tools like Analytify to present AI-ready insights directly inside WordPress. The next section shows how.
How to Build AI-Optimized Reports in Analytify (Step by Step)
Join 50,000+ beginners & professionals who use Analytify to simplify their Google Analytics!
Analytify is a Google Analytics plugin for WordPress that shows essential GA4 metrics directly on your dashboard, making performance easy to understand at a glance.
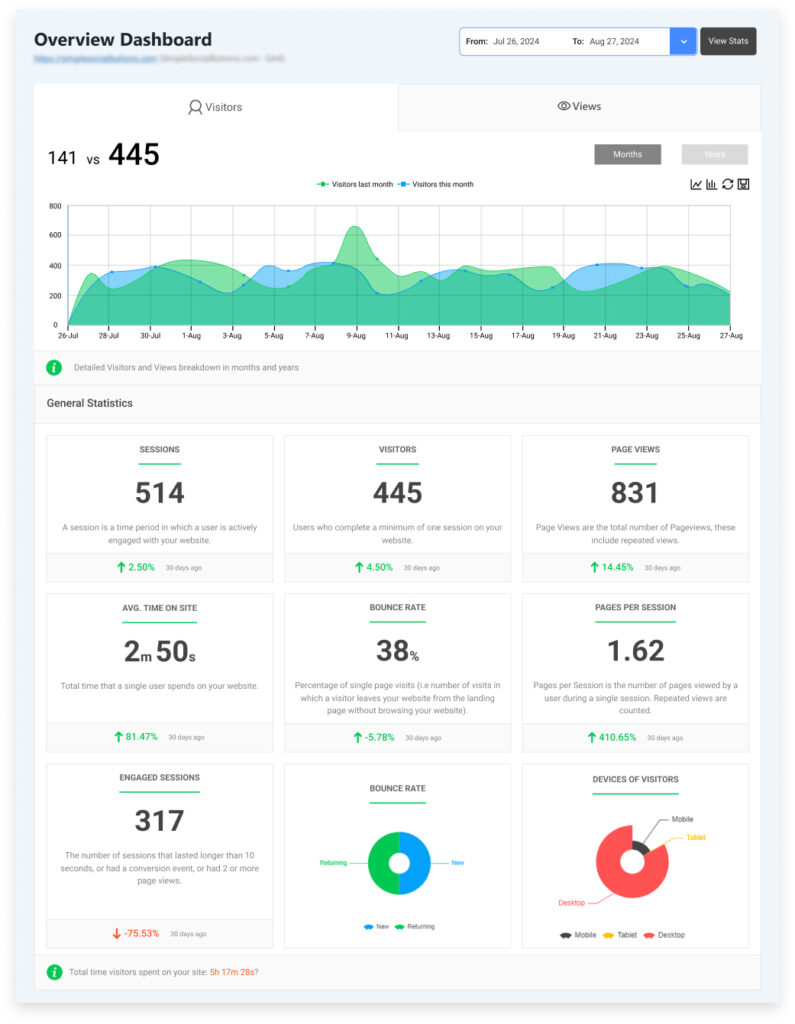
Analytify presents GA4 data in well-structured, summarized dashboards that are easier for AI tools to parse than raw GA4 reports.
You build an AI-optimized analytics report in Analytify in four steps: choose the report type, apply filters, use summarized dashboards, and export or schedule the report. Each step removes noise, improves clarity or structures data so AI systems can read it accurately.
Follow the steps given below to create AI-optimized analytics reports in Analytify:
Step 1: Choose the Right Report Type
Start by selecting the report that matches your goal. Analytify offers the following reports:
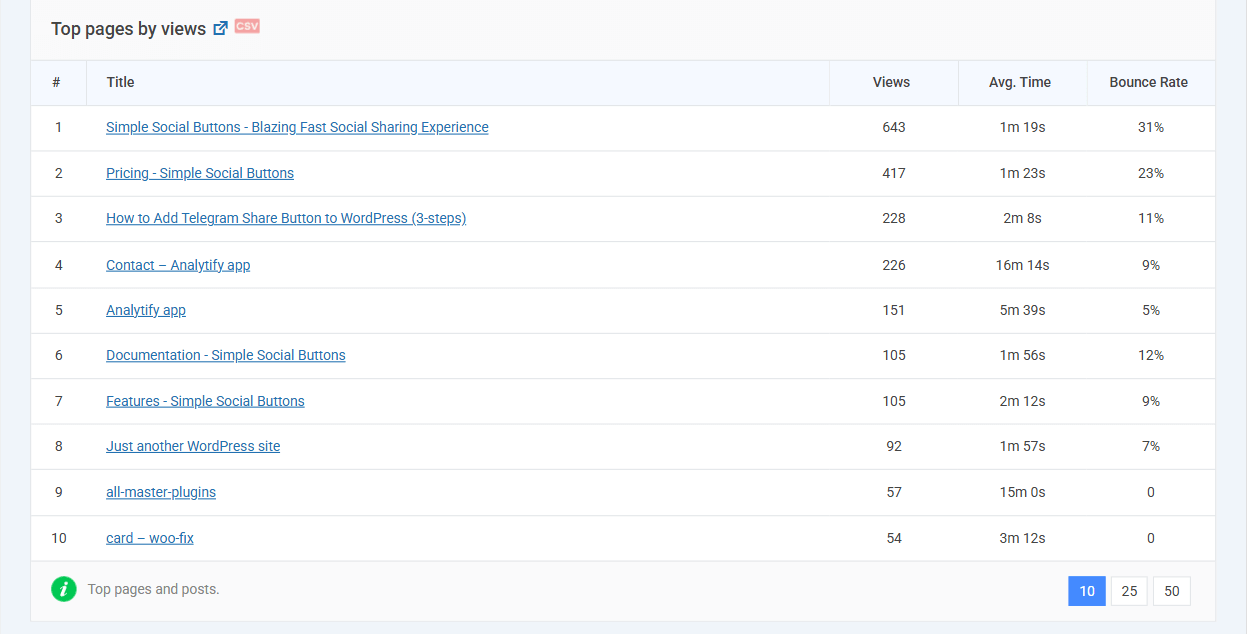
- Pages Report
Highlights top-performing pages based on traffic and engagement. AI can quickly identify which content drives the most value.
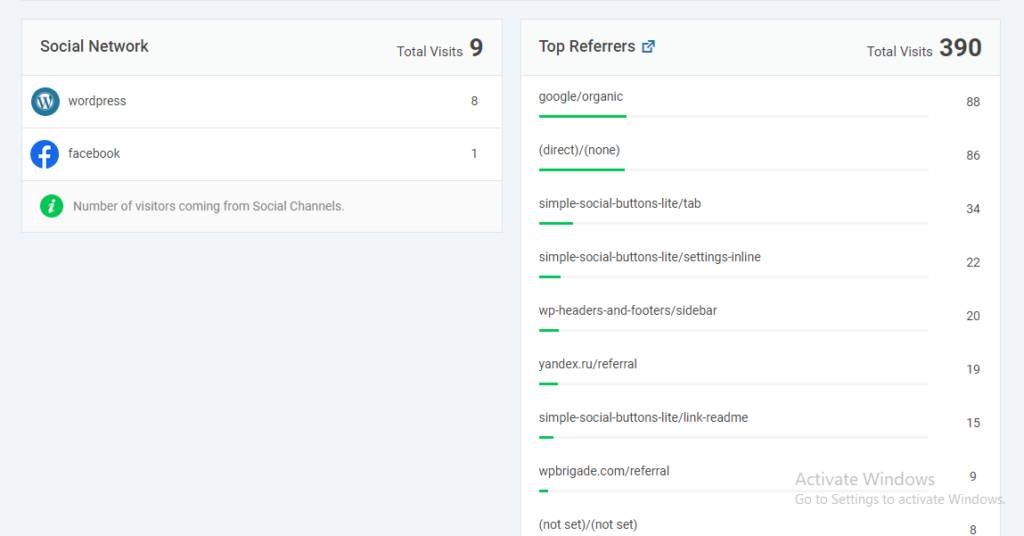
- Traffic Sources Report
Breaks down where visitors come from, including organic search, direct, and referrals. This helps AI detect traffic patterns and channel performance.
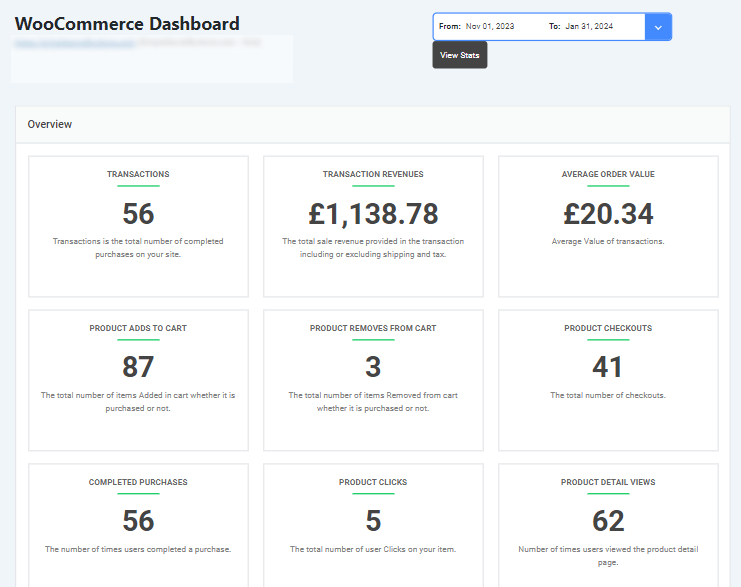
- E-commerce Report
Focuses on conversions, revenue, and product performance. AI uses this data to connect user behavior with business outcomes.
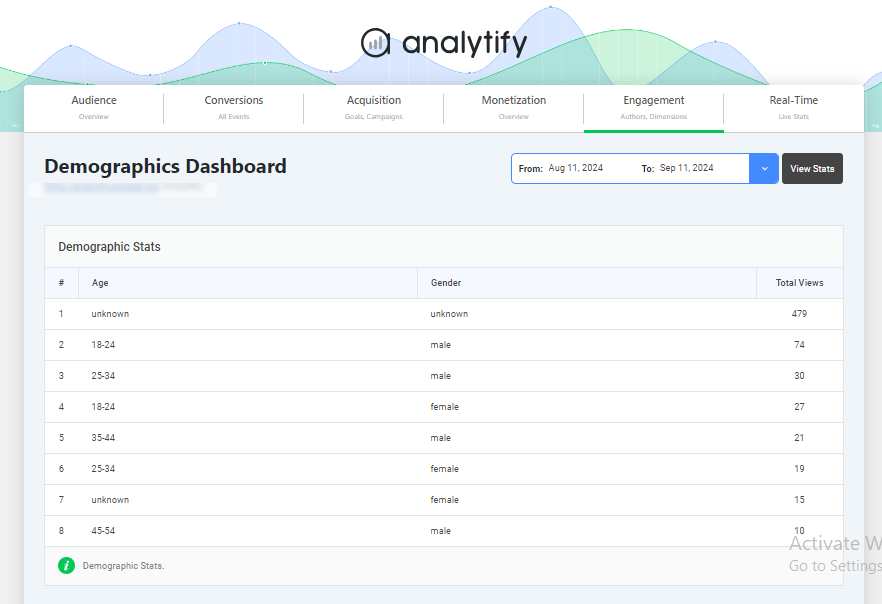
- Audience Report
Shows user behavior, including sessions, engagement, and demographics. This helps AI understand how visitors interact with your site.
Choosing the right report type keeps AI focused on relevant metrics and makes the report easier to interpret.
Step 2: Apply Filters to Remove Noise
- Filters and segments play an important role in analytics reporting for AI.
- Use them to exclude internal traffic, bots, or irrelevant pages.
- You can also segment users by device, traffic source, or location.
- This reduces noise and helps build clean data summaries, allowing AI to focus on meaningful patterns instead of distorted signals.
Step 3: Use Summarized Analytics Dashboards
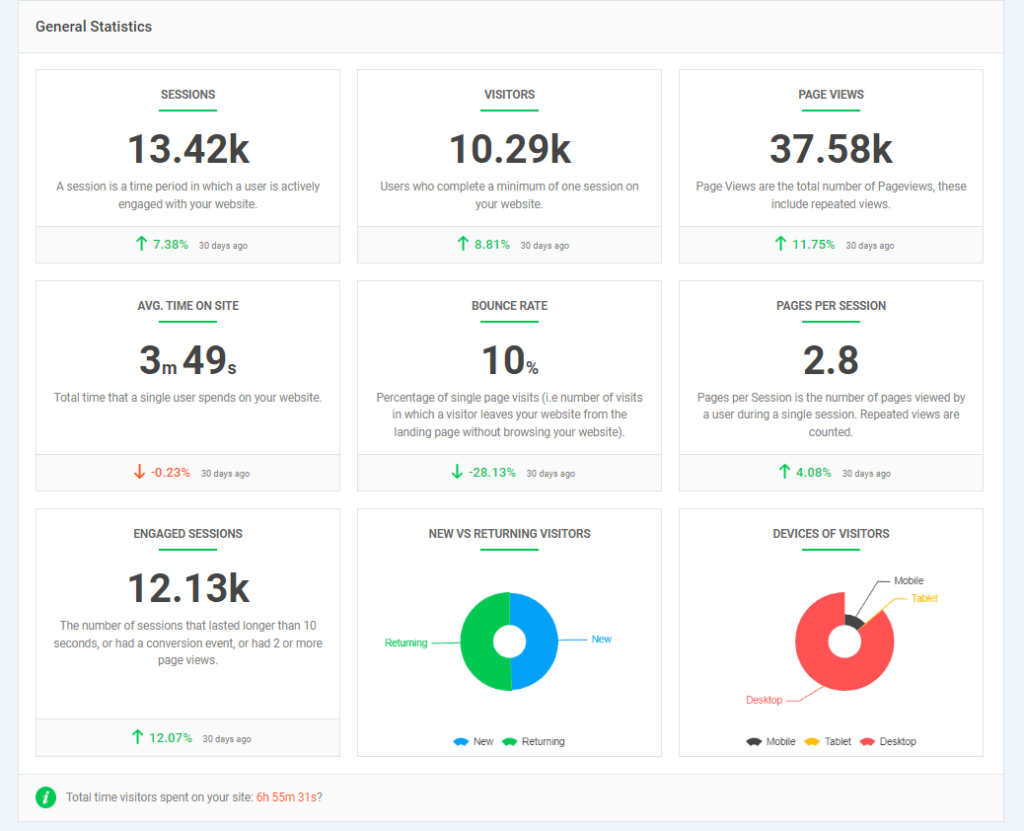
Analytify dashboards act as ready-made summaries. Instead of showing every metric at once, they highlight key numbers, trends, and changes.
These summarized views help AI quickly understand what matters most, such as traffic growth, drops in engagement, or changes in conversions, without scanning raw GA4 tables.
Step 4: Export or Schedule Reports for AI Ingestion
To use reports with AI tools, export them in structured formats like CSV or JSON. These formats are easy for AI systems to read and process.
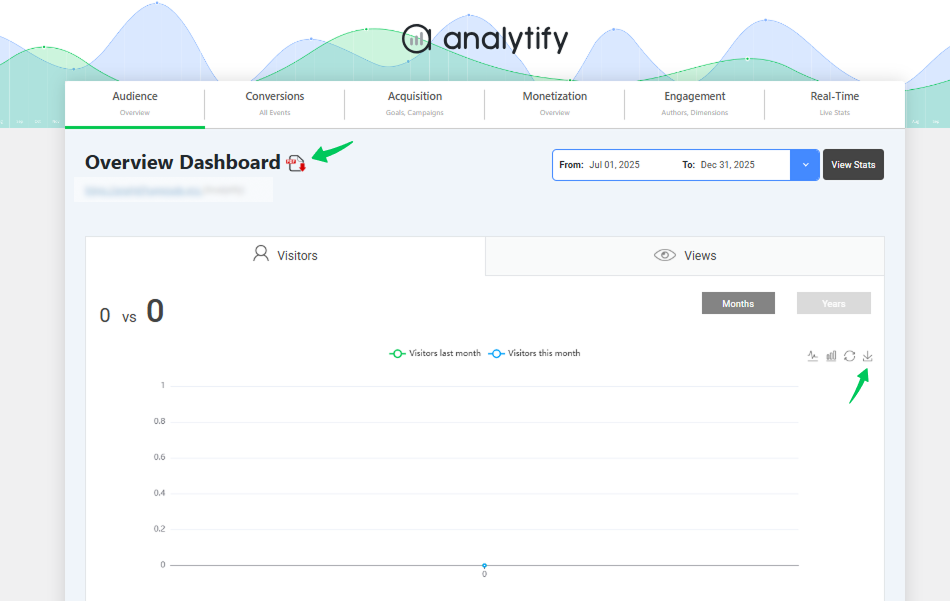
You can also schedule automated reports for teams or clients using Analytify’s Email Notifications add-on. Scheduled emails deliver regular, up-to-date data for AI analysis without manual sending.
Structuring Reports for AI/LLM Interpretability
Structure an AI-ready report with clear headings, short sections, consistent formatting and tables, so AI tools and LLMs can read it. This is called an LLM-ready report format.
AI tools that read text and tables rely on clear structure, simple language and well-organized data.
An AI-optimized report follows these rules:
- It should use clear headings, short sections, and consistent formatting to support AI-optimized reporting.
- Each section should focus on one idea, such as traffic trends, engagement, or conversions.
- Lists work better than long paragraphs, and tables are preferred over charts when the goal is to make the data easy for AI to interpret.
Structured reports allow AI systems to identify patterns, compare values and summarize insights accurately.
It’s also important to highlight key insights upfront. Instead of burying findings inside long explanations or nested dashboards, clearly state what changed and why it matters.
For example, write Organic traffic decreased by 18% after AI SERP rollout” rather than forcing AI to infer meaning from multiple metrics.
Avoid nested visuals, layered filters, or interactive elements that depend on human clicks, as these often break AI understanding.
Example: AI-Friendly Traffic Source Breakdown
| Traffic Source | Sessions | % Change | AI Insight |
| Organic Search | 12,400 | -18% | Likely impacted by AI answers |
| Direct | 6,100 | +5% | Brand awareness remains stable |
| Referral | 3,200 | +2% | External links unaffected |
| Paid Search | 1,900 | 0% | No AI-related impact |
This table format makes AI-optimized reporting easier. Each row contains one idea, and changes are clearly labeled, allowing AI to summarize trends without confusion.
By structuring reports this way, you reduce interpretation errors and improve insight quality. Whether you use spreadsheets, dashboards, or exports, a clean LLM-ready report format ensures AI focuses on detection and understanding.
Enhancing Reports for AI Insights
After creating structured reports, the next step is to enhance them with context and trends, allowing AI to generate more detailed insights.
As AI plays a bigger role in analyzing analytics, report structure matters as much as the data. Clean tables alone are not enough.
AI understands reports better when they clearly show trends, highlight important changes, and briefly explain why those changes happened.
Instead of treating all numbers the same, an AI-ready analytics report helps AI focus on what truly matters and identify the most important signals.
How Context Improves AI Data Interpretation
AI models analyze relationships and changes over time. Without context, they may misread normal fluctuations or overlook important signals. Explanations help AI interpret data correctly, mainly when changes are influenced by external factors such as:
- Seasonality or recurring trends
- Campaign launches or promotions
- Algorithm or AI SERP updates
- Content updates or site changes
Adding this context reduces misinterpretation and improves insight quality.
How to enhance reports for AI insights
Start with visual and structural clarity. Reports should clearly show patterns and highlight what deserves attention:
- Include trend lines alongside raw numbers to show growth, decline, or stability.
- Add short annotations for unusual spikes or drops to explain their cause.
- Highlight anomalies so AI focuses on meaningful changes rather than noise.
- Metric clarity is equally important. Clearly define what each metric represents, such as how sessions, engagement rate, or conversions are calculated.
- Use consistent units, date formats, and naming conventions across all reports. When the same metric is labeled differently, AI may treat it as unrelated data.
- For more advanced AI-optimized reporting, optional tags or metadata can guide AI interpretation:
- Mark’s primary KPIs versus supporting metrics.
- Label diagnostic signals separately from performance metrics.
For better understanding, you can check this example:
Before enhancement, a report may show a traffic drop with no explanation. After enhancement, the same report includes a trend line, an annotation noting an AI SERP update, and a summary confirming stable engagement.
A trend line, an annotation and a summary turn raw data into clear, AI-ready insights.
Sharing and Automating AI-Optimized Reports
Share AI-optimized reports by scheduling automated report emails, exporting structured files, and posting insights in team tools.
Analytics reporting for AI works best when reports are delivered on time, in a clean format, and are easy for both teams and AI systems to access.
The main goal of sharing AI-optimized Analytics reports is to:
- Support faster collaboration across teams
- Enable quicker decision-making using up-to-date data.
- Help teams respond quickly to trends without waiting for manual updates.
- Reduce manual effort and reporting errors through automation.
- Ensure everyone works with the same, consistent data.
With Analytify, you can automate and simplify this process:
- Schedule automated report emails for teams or clients
- Deliver summarized dashboards that are easy to read and AI-friendly.
- Export reports in formats like CSV or JSON to build clean and condensed analytics views for AI ingestion
Using Analytify, you can schedule automated report emails that deliver key metrics directly to your inbox or your clients’ inboxes.
These reports present simplified metric overviews that are easy to read and simple for AI tools to interpret.
For detailed analysis, exporting reports in structured formats such as CSV or JSON helps build clean data summaries that AI models can easily interpret.
AI-optimized analytics reports can also be shared via collaboration tools such as Slack, Microsoft Teams, or internal dashboards.
Sharing in these tools keeps insights accessible without logging into multiple platforms.
A simple workflow to follow is:
- Schedule automated reports
- Export structured files when needed
- Share insights across teams and tools.
Use Cases: How Teams & Clients Benefit from AI-Optimized Reports
Marketing teams, clients and product managers each use AI-optimized reports differently.
AI-optimized analytics reports help teams and clients make quicker and better decisions.
Unlike traditional reports, these AI-ready analytics reports are well structured and clearly explained. This makes them easy to understand and simple to act on for both humans and AI systems.
Summarized dashboards, trend patterns and context make each metric more useful. The examples below show how each role uses the reports:
Marketing Teams
- A marketing team can use AI-optimized reports to identify trends, such as which campaigns drive the most engagement or which content performs best.
- With trends and context in one report, teams can adjust strategies without waiting for manual analysis.
Clients
- Clients benefit from getting organized reports that clearly show key metrics and practical insights.
- Instead of going through raw data, they can focus on what matters, like areas that need improvement or campaigns that are doing well, making teamwork faster and easier.
Product Managers
- With AI-ready analytics reports, they receive condensed analytics views that show how users interact with different features and which features are used the most.
- Clear trend indicators and simple annotations help them understand whether changes are positive or need attention.
- This leads to better product planning, faster updates, and features that align more closely with user needs.
The following table summarizes how different teams use AI-optimized reports and the insights they gain:
| Report Type | AI Benefit | Practical Insight |
| Marketing Campaigns | Trend prediction | Adjust campaigns for better results |
| Client Dashboard | Clear summary | Focus on important performance areas |
| Product Usage | Simple metrics & notes | Decide which features to prioritize |
AI‑Optimized Analytics Reports: Best Practices and Common Pitfalls
To maintain accuracy and consistency in AI-ready analytics reports, follow these best practices and avoid common pitfalls in AI-optimized reporting:
- Use Clear Headings: Using vague or unclear headings can confuse AI interpretation, so always use clear, descriptive headings that explain exactly what the data shows.
- Keep Metric Names Consistent: Renaming the same metric differently in separate reports can confuse analysis, so keep metric names, formats, and units consistent across all reports.
- Present Data in Text or Tables: A common mistake is embedding critical numbers inside charts or images, whereas the best practice is to present essential data in text or tables, not just in pictures or screenshots.
- Update Templates Regularly: Relying on outdated report templates can lead to inaccurate or irrelevant insights. So, it’s important to update report templates and metadata regularly to align with current goals and tracking.
- Validate Data and Avoid Low-Value Metrics: Overloading reports with unnecessary or low-value metrics and skipping data checks before sharing reports with AI systems can mislead AI analysis. Adding basic validation checks before giving it to the AI improves data accuracy and completeness.
For quick questions between scheduled reports, Analytify MCP brings AI-powered analytics to Claude and ChatGPT, using the same GA4 property your reports use.
FAQs: AI‑Optimized Analytics Reports
1. What is an AI‑optimized analytics report?
An AI‑optimized analytics report is a carefully structured and formatted report to make it easy for AI tools, such as large language models (LLMs), to understand the data. It organizes metrics, trends, and context in a way that the AI can accurately interpret and analyze.
2. Why is analytics reporting for AI different from traditional reporting?
AI reporting requires clean, structured data with clear headings so models can interpret it correctly. It allows AI to automatically identify trends, patterns, and anomalies. Traditional reports often rely on visuals alone, which can make automated analysis less accurate.
3. How do I build clean data summaries for AI‑ready analytics?
To build clean data summaries, organize key metrics in text or tables, standardize naming and formats, and remove noise. So, AI systems can process the data without confusion.
4. How can AI help improve analytics reporting for AI workflows?
AI can automate repetitive tasks such as synthesizing KPI trends, producing narrative summaries, and highlighting anomalies. That will speed up insights and reduce human effort.
5. How does AI summarize insights from dashboards?
AI can read exported data from dashboards, such as CSV files. It identifies key trends, patterns, and anomalies in the data. Then it generates written summaries of important metrics in plain language.
Final Thoughts: AI-Optimized Analytics Reports
An AI-optimized analytics report is clean, structured and explained: filter noise, use clear headings and tables, add context to changes, and share the report on a schedule. Analytify supports this with summarized dashboards, exports and scheduled report emails.
For further guidance, you can read:
- GA4 Insights for AI Content: How to Analyze Pages That Rank in AI Answers
- AI-Powered SEO Experiments: How to Analyze Test Results with Analytify
- Best AI Visibility Tools: Complete Guide for SEO Professionals
Which benefits of AI-ready analytics reports have helped you the most? Share your experiences in the comments below!