What is Google Analytics Benchmarking? (Explained 2026)
Have you ever wondered how your website compares to others in your industry?
Google Analytics Benchmarking is a feature that lets you measure your website or app’s performance against similar businesses using industry benchmarks, peer group comparisons, and percentile insights.
Benchmarking is essential because it helps you to find strengths, identify gaps, and spot opportunities for growth by comparing your performance with industry standards.
In this guide, you’ll learn what benchmarking in Google Analytics is, how GA4 benchmarking works, the prerequisites to access it, and how to interpret benchmarking data.
Let’s get started!
Google Analytics Benchmarking (TOC)
What is Google Analytics Benchmarking?
Google Analytics Benchmarking is a feature in Google Analytics 4 (GA4) that lets you compare your website or app performance with that of similar businesses (your peer group) in your industry.
It helps you understand whether your key metrics, such as user acquisition, engagement, retention, and monetization, are performing above, below, or on par with industry averages.
For example, if your bounce rate was higher than the industry average, it could signal issues with user experience or content quality.
When enabled, Google Analytics benchmarking report shows:
- Your metrics (solid line)
- Median performance of peers (dotted line)
- Peer group range (25th–75th percentile) (shaded area)

Google Analytics industry benchmarking helps you see how your data stacks up against others in your industry so that you can identify strengths, gaps, and growth opportunities.
Key Features of GA4 Benchmarking
The following are the Key features of Benchmarking:
1. Peer Groups
- Peer groups are determined automatically based on your industry category, URL, app attributes, and other relevant factors.
2. Percentile Comparison
- You can compare your performance against:
- Median (50th percentile)
- 25th percentile (lower range)
- 75th percentile (upper range)
- This gives a clear idea of where your business stands in the competitive landscape.
3. Data Privacy & Quality
- All benchmarking data is encrypted and anonymized.
- Benchmarks are only available if:
- Enough comparable properties exist.
- Your property meets Google’s minimum user and data thresholds.
4. Fresh Data
- Benchmarking metrics are updated daily.
- This ensures you always compare against current industry trends.
Key Metrics Available for Benchmarking in GA4
Google Analytics 4 covers four main categories of benchmark metrics: Acquisition, Engagement, Monetization, and Retention. These give you a view of how your business compares to others.
1. Acquisition Metrics
These show how effectively you attract new users.
- New user rate: The percentage of first-time visitors compared to returning ones.
- Sessions: Number of total visits to your site or app.

2. Engagement Metrics
These measures show how users interact with your content.
- Average engagement time per session: The average time users actively spend on your site/app.
- Events per session: Average number of actions (clicks, scrolls, form submissions, etc.) users take.
- Engagement rate: Percentage of engaged sessions out of total sessions.
- Bounce rate: Percentage of sessions where users leave without meaningful interaction.
- Pages per session: Average number of pages a user visits in one session.
3. Monetization Metrics
These help evaluate revenue performance compared to peers.
- Average revenue per user (ARPU): Total revenue divided by active users.
- Average revenue per paying user (ARPPU): Revenue per user who made a purchase.
- Transactions per user: Average number of purchases made by each user.
- First-time purchaser rate: Percentage of new users who make a purchase.
- Add-to-cart per user: Average number of times users add products to their cart.

4. Retention Metrics
These measure your ability to keep users coming back.
- Daily Active Users (DAU) / Monthly Active Users (MAU): Ratio showing user stickiness.
- Daily Active Users (DAU) / Weekly Active Users (WAU): Another measure of short-term retention.
- Weekly Active Users (WAU) / Monthly Active Users (MAU): Reflects mid-term retention.
- Retention rate: Percentage of users who return after their first visit.

GA4 Benchmarking covers the full customer journey from how you acquire users to how they engage, whether they convert, and how often they come back, so you can see precisely where you lead or lag compared to your industry.
How to Access Benchmarking Data in Google Analytics
Before you can start comparing your site with industry benchmarks, you’ll need to enable the feature in Google Analytics 4. Follow these simple steps for finding benchmarking in GA4:
Step 1: Enable it first
- Sign in to your Google Analytics account. Select the property where you want to view benchmarking data.
- Go to Admin at the bottom of the left-sided menu.

- Then, click on Account details under the Account settings.

- Next, turn on Modeling contributions & business insights. Save changes.

Note: After enabling, benchmarking does not appear instantly. It can take a few days (sometimes weeks) before Google makes the data available.
Step 2: Go to the Home page in GA4
- On the left-hand menu, click Home (not Reports).
- You’ll see the Overview cards (e.g., Users, Engagement, Revenue, Retention).
Step 3: Click on a metric in an Overview card
- Choose a card like Active Users.
- Click on the dropdown arrow parallel to the metric value or name. The list of options will appear.
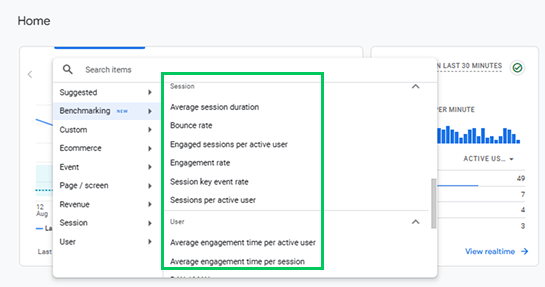
Step 4: Expand the Benchmarking category
- In that dropdown, you should select Benchmarking (new); this is the category you need to expand.
- Expand Benchmarking, then pick a metric (e.g., Bounce rate, Session key event rate, DAU/MAU, Engagement rate, ARPU).

Step 5: View the Benchmarking Chart
When benchmarking is turned on, the overview graph will display:
- Your property’s performance (solid line)
- Median of your peer group (dotted line)
- Shaded range representing the 25th–75th percentile of the peer group
You can hover over the chart to see detailed values.
Why You Might Not See It Yet
If you don’t see “Benchmarking” in the dropdown:
- You only recently enabled the setting (data needs time to process).
- Your property doesn’t yet meet minimum data thresholds.
- GA4 Benchmarking data is only available for dates after May 30, 2024.
- If your date range is set to Today, benchmarking won’t appear.
Interpreting Benchmarking Data
After setting up Google Analytics benchmarking, let’s know how to interpret this benchmarking data:
1. Percentiles Explained
Benchmarking data is often displayed in percentiles, which helps you understand how your site compares with peers.
- 25th Percentile (Lower Range): If your metric falls here, your performance is below most of your peers, indicating areas that need improvement.
- 50th Percentile (Median): This is the middle point of your peer group. Being at or around the median means your performance is average compared to similar businesses.
- 75th Percentile (Upper Range): Metrics here show you’re outperforming the majority of your peers, highlighting your strengths.

2. Analyzing Performance
You can analyze performance by comparing your metrics with the median:
- Above Median: If your metrics are above the 50th percentile, you’re performing better than most competitors. This highlights strengths you should maintain or leverage further.

- Below Median: If your data consistently falls below the median or into the 25th percentile range, it shows weak spots that require immediate attention.
- Consistency Across Metrics: Look for patterns. For example, strong acquisition but weak retention may suggest you attract visitors but struggle to keep them engaged.
3. Setting Goals
Finally, after analyzing your performance, you can turn insights into action by setting data-backed goals:
- Realistic Targets: Use the benchmarking data to create achievable goals rather than arbitrary targets. For instance, if you’re in the 25th percentile, aim first to reach the 50th percentile.
- Identify Opportunities: Spot areas where you lag and prioritize them for optimization. For example, if your engagement metrics trail those of your peers, focus on improving content or user experience.
- Track Progress: Regularly review benchmarking reports to monitor whether your strategies are pushing your metrics toward higher percentiles.
Interpreting GA4 benchmarking data means learning where you stand (percentiles), identifying strengths and weaknesses (analysis), and setting realistic, data-backed goals for improvement.
Limitations of Google Analytics Benchmarking
While benchmarking in Google Analytics is useful, it’s essential to understand its limitations:
- Generalized Data: You only see averages from your industry, not the exact performance of your competitors.
- No Full Control: You can’t choose specific competitors to compare against.
- Broad Categories: Peer groups are based on industry and region, so comparisons may not perfectly match your business type.
- Not Real-Time: Data updates daily, not instantly, so you can’t track immediate changes.
- Limited Detail: Since data is anonymized, you don’t get deep insights into why competitors perform better.
How Analytify Simplifies Google Analytics Benchmarking
Join 50,000+ beginners & professionals who use Analytify to simplify their Google Analytics!
While GA4 benchmarking is powerful, navigating its reports can feel overwhelming. That’s where Analytify comes in.
Analytify is one of the best Google Analytics WordPress plugins that lets you track performance without leaving your site. Analytify seamlessly integrates with GA4 and brings all key metrics right inside your WordPress dashboard.

This means you can monitor traffic, engagement, conversions, and benchmark insights in a simple, user-friendly way without navigating into complex GA4 reports.
In analytify you can,
Use Real-Time Dashboard: Track live user activity and engagement inside WordPress, giving you context for how immediate performance stacks up against expected benchmarks.

Detailed Engagement Reports: Track sessions, bounce rate, devices, and other user behavior in an easy-to-understand way.

Review Traffic Sources: Understand whether your traffic from search, social, or referrals is above or below average.

Track E-commerce Performance: Compare your sales, revenue, and conversion rates with industry averages while viewing detailed product performance inside Analytify.

Monitor Campaign Tracking: Link your GA4 benchmarking insights with Analytify’s UTM campaign reports to see if your marketing is driving results above or below industry levels.
Analyze Landing Page Engagement: Check how well your landing pages keep visitors engaged, and align this data with benchmarks to spot areas for improvement.

GA4 benchmarking shows you where you stand, and Analytify makes those insights easier to understand and act on. It’s the perfect companion for businesses that want benchmarking clarity without GA4’s complexity.
Frequently Asked Questions
1. What is benchmarking in Google Analytics?
Benchmarking in Google Analytics (GA4) lets you compare your website or app’s performance with similar businesses in your industry. It shows where you stand in terms of traffic, engagement, and other key metrics compared to peers.
2. What is benchmarking in Chrome?
Benchmarking in Chrome refers to testing browser performance, such as how fast Chrome loads websites, runs JavaScript, or handles graphics, usually compared to other browsers.
3. What are the three main types of benchmarking?
Internal Benchmarking: Comparing performance between teams, departments, or branches within the same company.
Competitive Benchmarking: Comparing performance directly with competitors.
Industry/Functional Benchmarking: Comparing with industry standards or leaders, even outside your direct competitors.
4. What are the five stages of benchmarking?
Planning: Identify what you want to benchmark.
Data Collection: Gather internal and external performance data.
Analysis: Compare data with benchmarks and find gaps.
Implementation: Apply changes and improvements based on findings.
Monitoring: Track progress and regularly benchmark.
5. What is benchmarking in data analytics?
Benchmarking in data analytics means measuring your performance metrics against standard values, competitors, or industry averages to understand if you’re doing better, worse, or equal to others.
6. What are Google Analytics industry averages?
Google Analytics industry averages are anonymized data collected across websites in the same category. These averages act as website analytics benchmarks to help you understand if your site performance is below, average, or above industry levels.
7. Why should I use website analytics benchmarks?
Website analytics benchmarks allow you to measure your site’s performance against industry peers. This helps in setting data-driven strategies, improving user experience, and achieving better marketing ROI.
Final Thoughts: Google Analytics Benchmarking
Throughout this guide, we explored everything you need to know to start using benchmarking in Google Analytics effectively. It lets you compare your site’s acquisition, engagement, monetization, and retention with Google Analytics industry averages.
It has key features like Peer group comparisons, percentile insights (25th, 50th, 75th), anonymized and encrypted data, plus daily refreshed metrics. The available benchmark metrics are from acquisition metrics (new users, sessions) to engagement (engagement rate, bounce rate), monetization (ARPU, ARPPU), and retention (DAU/MAU ratios).
We also discussed how to Access Benchmarking in GA4 and interpret benchmarking Data. Remember that GA4 benchmarking data is generalized, anonymized, not competitor-specific, and works best as a directional guide rather than an absolute performance measure.
Google Analytics benchmarking reports help you understand where your website stands, identify areas for improvement, and create smarter growth strategies backed by website analytics benchmarks.
For Further guidance, you can read:
- 10 Crucial E-commerce Metrics to Track in GA4
- How to Track Website Performance with GA4
- 13 Most Important Google Analytics Metrics to Track
Do you find Google Analytics industry benchmarking helpful in spotting opportunities, or do you prefer relying on custom analytics reports? Share your experience in the comments below!