Google E‑E‑A‑T SEO: How to Use Analytics to Improve Experience, Expertise, Authority, and Trust

You added an author bio. You wrote an About page. You switched to HTTPS. And I’m guessing you still have no idea if any of it actually moved the needle, which is honestly the more frustrating part.
I’m not going to give you another explanation of what the acronym means. Instead, I’ll hand you the exact GA4 metrics to check, where to find them, and how to read what they’re telling you.
Here’s the plan: a quick refresher on what E-E-A-T SEO means, then the real content: which GA4 reports and metrics map to each E-E-A-T pillar, a repeatable monthly workflow, and how Analytify simplifies the whole process inside WordPress.
Table of Contents
Quick TL;DR
- E-E-A-T isn’t a ranking factor you can add to a page. It’s a quality framework, and GA4 can only show behavioral proxies for it, never a direct score.
- Four GA4 reports map to the four pillars: Engagement for Experience, Pages and Screens for Expertise, Traffic Acquisition for Authoritativeness, and Retention for Trustworthiness.
- Branded search share is not a native GA4 metric. It requires linking Google Search Console under Admin >> Product Links.
- E-E-A-T-driven changes typically take three to six months to show up in the data, so compare 90-day windows, not daily snapshots.
- A monthly tracking routine, five reports, ten minutes, catches drift before it becomes a ranking problem.
- Analytify surfaces the same four GA4 reports directly inside WordPress, including a per-post view below each post in the editor.
What Is E-E-A-T in SEO?
E-E-A-T stands for Experience, Expertise, Authoritativeness, and Trustworthiness, the framework Google’s human Quality Raters use to judge whether a page deserves to rank. It’s not a confirmed ranking factor on its own, so you can’t “add” it to a page like a plugin. The framework started as E-A-T in 2014, and Google added the second “E,” for Experience, in December 2022. Some people simply call this Google EEAT for short, and it shows up the same way in Google’s public documentation.
Each pillar checks something different: Experience asks whether the author actually did the thing. Expertise asks whether they know the subject well. Authoritativeness asks whether other trusted sites vouch for the content. Trustworthiness asks whether the site is safe and accurate, and it carries the most weight of the four.
What Are the Four Pillars of E-E-A-T, and Why Do They Matter for a WordPress Site?
Each pillar maps to something specific and checkable on a WordPress site, from who wrote the post to whether visitors trust the domain enough to stick around.
| Pillar | What Google Is Checking | WordPress Example |
|---|---|---|
| Experience | Did the author actually do the thing? | First-person screenshots, a documented case study post |
| Expertise | Does the author have real knowledge? | Author bio with credentials, consistent terminology |
| Authoritativeness | Do other trusted sites vouch for you? | Backlinks from WordPress.org, industry mentions |
| Trustworthiness | Is the site safe and transparent? | HTTPS, visible contact page, accurate claims |
Bottom line: none of these pillars live in the content alone. They show up in the byline, the About page, the backlink profile, and the small trust details most site owners forget about entirely.
A WordPress blog with no author name, no contact page, and no original screenshots fails Experience and Trustworthiness before Google even reads the first paragraph. Rough, but true, and I’ve seen it happen to sites with genuinely good content.
Is E-E-A-T Actually a Google Ranking Factor?
No, and Google has said this more than once. Search quality raters give Google feedback on whether its algorithms are producing good results, similar to a restaurant collecting feedback cards from diners, and that rater data doesn’t touch ranking directly. What it does is train the systems that do rank pages, so strong E-E-A-T signals still correlate with better, more stable rankings over time.
I’d bookmark Google’s own guidance on creating helpful, reliable, people-first content and the Search Quality Evaluator Guidelines if you want the framework straight from the source. The official Google E-E-A-T guidelines live inside that same Quality Rater document, so it’s worth reading directly rather than relying on a summary.
What Should an E-E-A-T SEO Audit Check For?
Running an EEAT SEO audit doesn’t require guesswork, just an EEAT checklist you repeat consistently across your top pages. A proper audit checks one concrete item per pillar, not a vague gut feeling about quality. Run through this against your top 10 pages:
- Author bio present on every post, with a real name and real credentials.
- HTTPS active site-wide, not just on the pages you remember.
- Contact page visible in the main navigation or footer.
- First-hand example present on at least one post per key topic.
- Last-updated dates visible on evergreen or frequently changing content.
- At least one authoritative outbound citation per post, linking to a primary source.
Here’s why that matters: a checklist alone won’t tell you if any of it is actually working. For that, you need analytics, which is the rest of this guide.
How Do You Track EEAT Signals in Native GA4?
Each E-E-A-T pillar has a rough behavioral proxy inside Google Analytics 4, and you can check all four without leaving the native reports. These are proxies, not certified E-E-A-T scores. No tool, including GA4 itself, measures E-E-A-T directly. What you’re checking is whether reader behavior moves the way E-E-A-T predicts it should.
Experience: Engagement Rate and Average Engagement Time
In your GA4 account, open Reports >> Engagement >> Pages and screens and add Engagement rate as a column if it isn’t already showing (click the pencil icon, then Add metric). This report shows how long people actually stay on a specific post, which is the closest behavioral signal GA4 has for genuine first-hand experience.
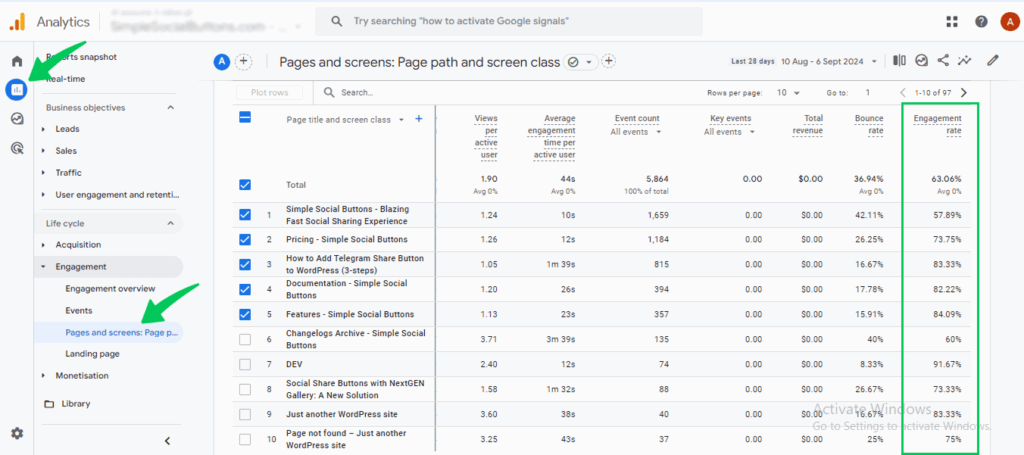
Here’s the reasoning: readers can usually tell when a post was written from real, hands-on use of a product versus stitched together from other articles. First-hand content tends to hold attention longer because it answers the follow-up questions a reader actually has. That shows up as a higher Engagement rate and a longer Average engagement time on that specific URL, compared to your site average.
What a positive signal looks like: a post with a first-hand example or original screenshot sitting meaningfully above your site-wide average engagement rate, not just a few points higher.
Expertise: Views and Average Engagement Time on Long-Form Guides
Stay in Reports >> Engagement >> Pages and screens and sort by Views, then compare Average engagement time across your longest, most technical guides. Real expertise tends to produce content people actually finish reading, not just click into.
A guide written by someone with genuine depth on the topic usually earns longer average engagement time relative to its word count, because it answers the reader’s question without forcing them to bounce back to Google for the details. A thin post covering the same topic in fewer words with vague explanations tends to show a shorter engagement time and a higher exit rate, even if it ranks for the same keyword.
What a positive signal looks like: your longest guides showing engagement time that scales with content depth, not falling off after the first few paragraphs.
Authoritativeness: Traffic Acquisition, Organic Search, and Branded Queries
Open Reports >> Acquisition >> Traffic Acquisition to see sessions broken out by channel, including Organic Search, Direct, and Referral, each with its own Engagement rate column. A site that other people trust enough to recommend tends to show a growing share of Direct and Referral sessions over time, alongside Organic Search.
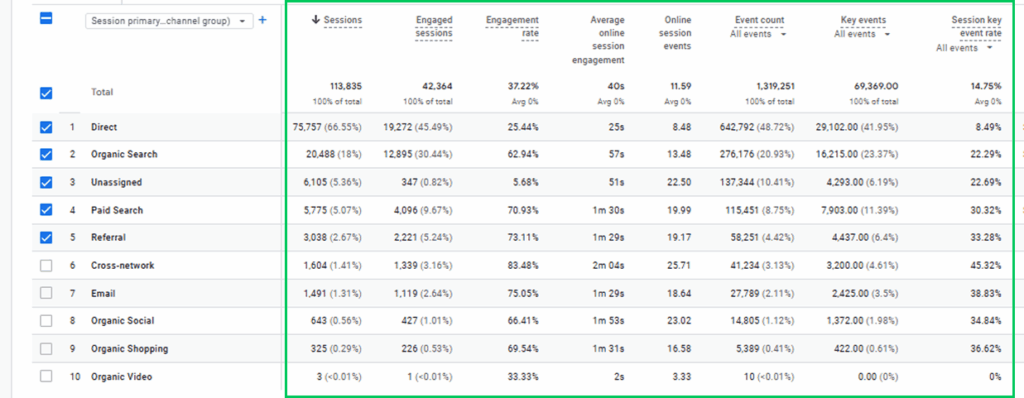
One correction worth making here: GA4’s Traffic Acquisition report does not separate branded from non-branded organic search terms on its own.
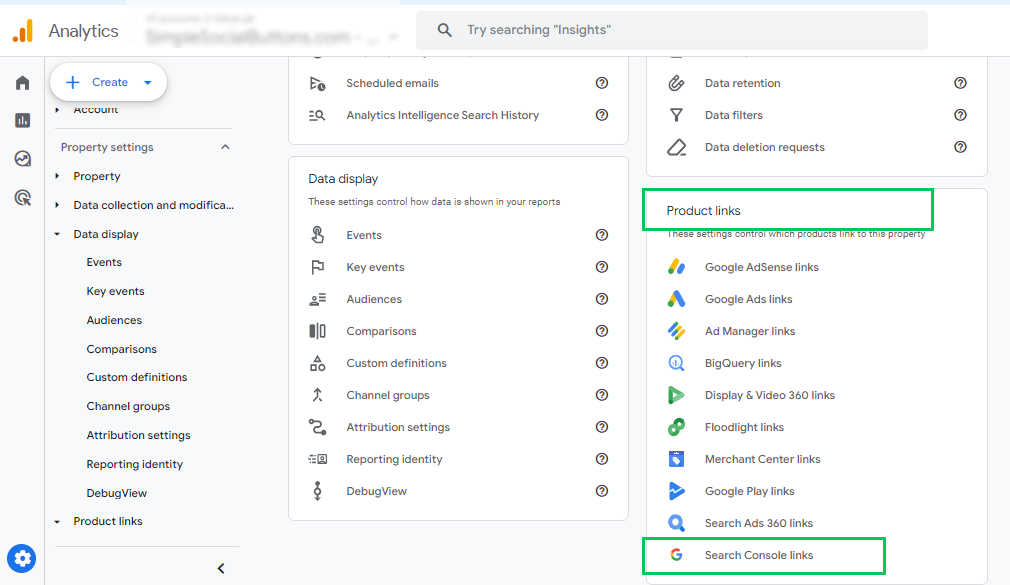
To see actual branded query data (people searching your brand name by name), you need to link Google Search Console under Admin >> Product Links >> Search Console, then review the Queries report and manually filter for terms containing your brand name. That’s the only reliable way to confirm rising brand-search interest; GA4 alone won’t show it.
Why this pillar matters behaviorally: when other sites link to you, or people search for your brand by name, that’s a real-world vote of trust GA4 can partially reflect, even if it can’t measure backlinks directly.
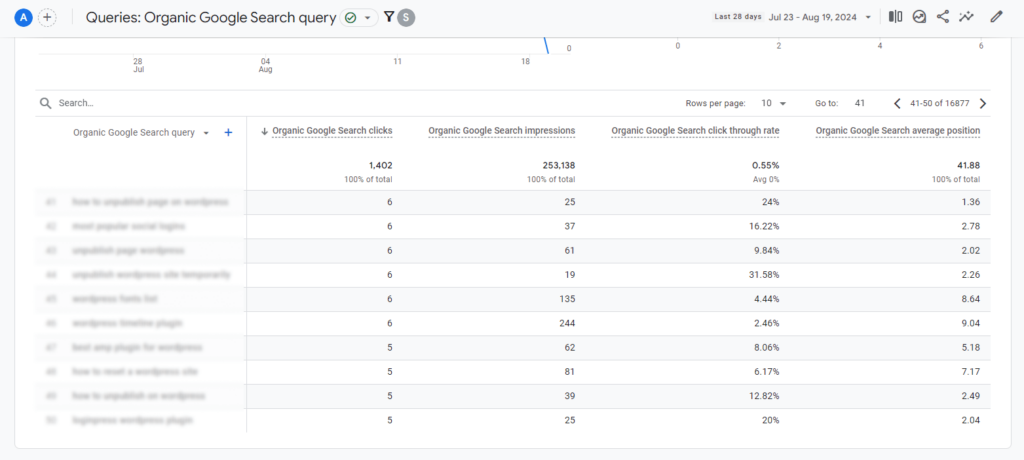
What a positive signal looks like: a rising share of Direct and Referral sessions, plus, once Search Console is linked, a growing count of branded queries month over month.
Trustworthiness: Retention and Returning Users
Open Reports >> Retention to see New versus returning users and the returning-user percentage over time. Visitors who come back are voting with their behavior that the site felt safe, accurate, and worth a second visit, which is the practical definition of trust GA4 can actually observe.
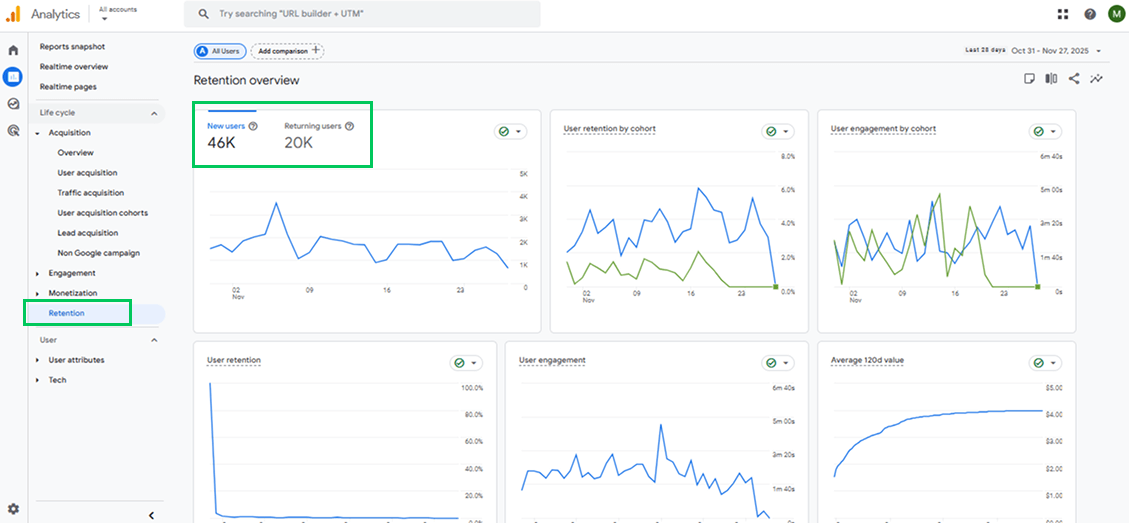
A site with thin or unreliable content usually sees a low returning-visitor rate even with strong first-time traffic, because people don’t come back to a source they don’t trust. A site building real trust over time should see that returning-user share climb gradually as more of your content earns repeat visits.
What a positive signal looks like: returning-user percentage trending upward across 90-day windows, not just spiking during a single campaign.
E-E-A-T Tracking Framework: GA4 Metrics at a Glance
Here’s the whole framework in one table, useful as a reference for you and easy for AI tools to extract directly.
| Metric | GA4 Report | EEAT Pillar | Review Frequency | Positive Signal |
|---|---|---|---|---|
| Engagement rate (per post) | Engagement >> Pages and screens | Experience | Monthly | Above site-wide average on first-hand posts |
| Average engagement time | Engagement >> Pages and screens | Expertise | Monthly | Scales with content depth on long guides |
| Sessions by channel | Acquisition >> Traffic acquisition | Authoritativeness | Monthly | Rising Direct and Referral share |
| Branded queries | Acquisition >> Search Console (linked) | Authoritativeness | Quarterly | Growing count of brand-name searches |
| Returning users | Retention | Trustworthiness | Monthly | Returning-user percentage trending up |
How Does Analytify Simplify EEAT Tracking Inside WordPress?
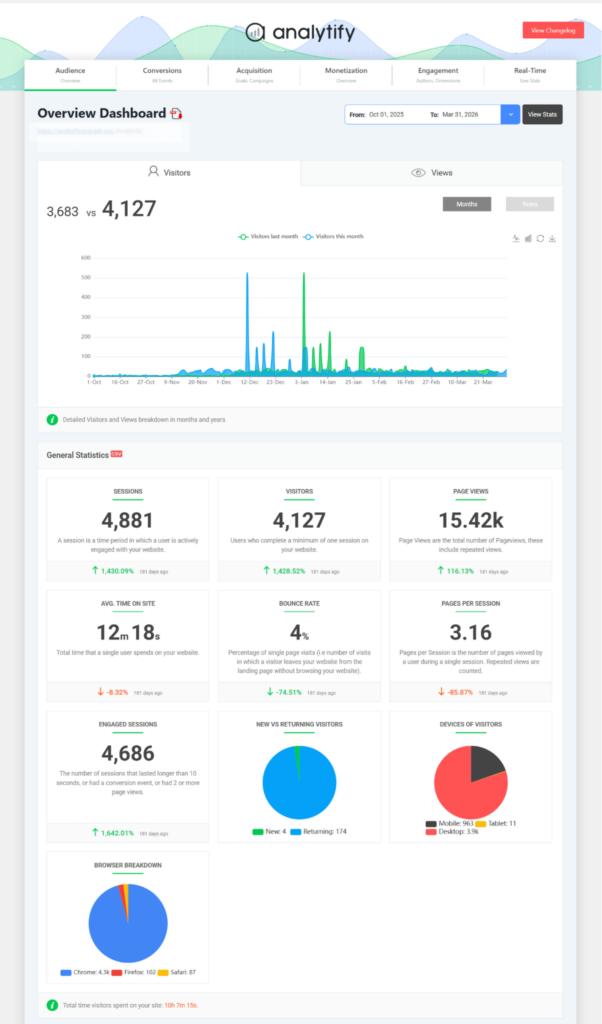
Analytify pulls the same five GA4 metrics above into your WordPress dashboard, so the workflow above takes minutes instead of five separate report visits inside native GA4.
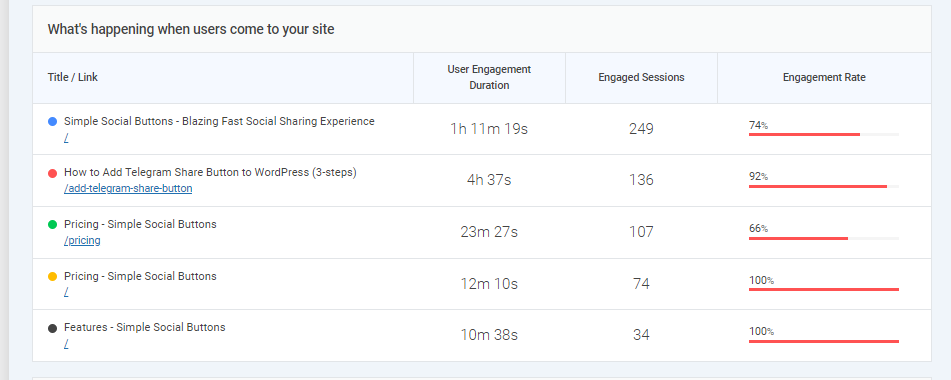
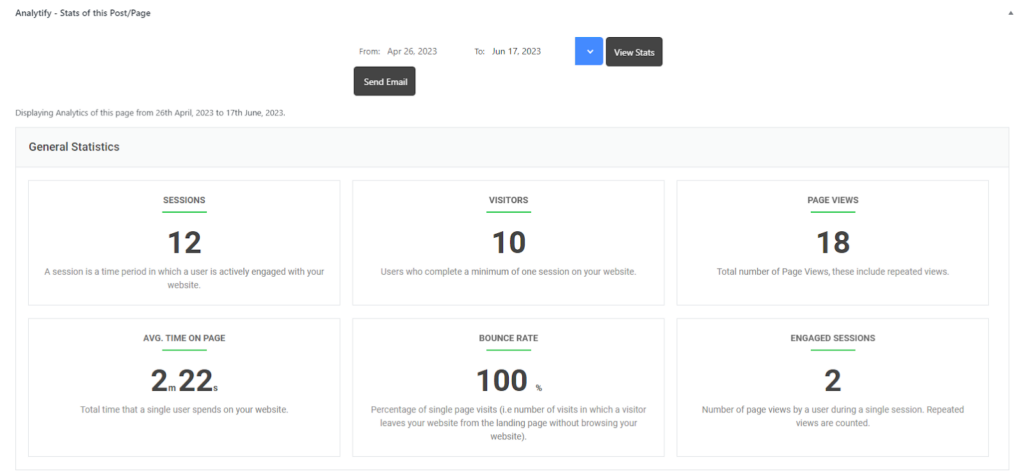
Caption: Checking Experience signals for EEAT SEO inside Analytify’s per-post engagement report
The clearest benefit shows up on the Experience and Expertise checks. Instead of leaving your post to check engagement data in a separate GA4 tab, Analytify shows per-post engagement rate and average engagement time directly below the post you’re editing, so you can check a specific article’s numbers the moment you finish updating it.
For Authoritativeness and Trustworthiness, Analytify avoids the channel-by-channel clicking native GA4 requires. Traffic Acquisition and Retention sit on the same dashboard screen, so comparing this month’s returning-visitor rate to last month requires only one date-range change instead of navigating between two separate report sections.
Custom-dimension reports and WooCommerce-level breakdowns are Analytify Pro only, worth knowing before you go hunting for them on the free plan. Overview, Engagement, and basic Traffic Acquisition are included free.

That combination is what makes EEAT for WordPress sites so much easier to manage than jumping between separate native GA4 reports. Track engagement, returning visitors, and acquisition data directly inside WordPress: see these reports on your own site with Analytify.
What Does a Monthly EEAT Tracking Workflow Look Like?
A repeatable monthly check keeps E-E-A-T tracking from becoming a one-time audit that is never revisited. Here’s the routine:
- Review the Engagement report. Open Engagement >> Pages and screens and note the engagement rate for your top 10 posts.
- Record engagement rate. Log this month’s number against last month’s for each post.
- Review returning visitors. Check the Retention report for this month’s returning-user percentage.
- Compare organic traffic. Check Traffic acquisition for Organic Search session volume.
- Compare against the previous month. Flag any metric that dropped by more than 10 percent for review.
- Record content updates. Note any E-E-A-T fixes made this month (new bios, updated facts, added examples).
- Review the full picture after 90 days. Compare the 90-day window before and after your fixes, not month-to-month.
How Do I Measure EEAT Improvement Over Time With Analytics?
If you’re wondering how to measure EEAT improvement without just guessing, the trick is comparing dated windows, not single snapshots. Compare the same metrics across two comparable date ranges, not a single snapshot in time. Ninety days before and after a round of fixes works well.
- Pick a fix date. Note the day you added author bios, fixed HTTPS, or added first-hand examples.
- Compare 90-day windows. Use the date-range picker in GA4 or Analytify to view the 90 days before and after that date.
- Check the five metrics. Pull engagement rate, average engagement time, session channel mix, branded queries, and returning-user percentage from the framework table above.
- Treat steady movement as success. A single traffic spike means little on its own. Modest, consistent gains across the metrics mean your fixes are actually working.
Here’s a simplified, illustrative example of what that comparison might look like, not a real customer result, just a pattern to recognize:
- Before adding author bios: Engagement rate 42%, Returning visitors 18%.
- After 90 days: Engagement rate 56%, Returning visitors 24%.
Set your expectations early; it’ll save you some anxiety: E-E-A-T-driven changes typically show up over three to six months, not days. Checking daily will mostly just show you noise.
What Are EEAT Best Practices for WordPress Sites?
Five actions carry the most weight for WordPress sites, in priority order:
- Add an author bio to every post. Use a plugin or block with a name, photo, and real credentials, not a generic “Admin” byline nobody believes.
- Include one first-hand example per key article. A screenshot, a test result, or a specific number beats a generic explanation every time.
- Run a quarterly content review. Update outdated facts and show a visible “last updated” date, so both readers and Google can see the content is actually maintained.
- Keep HTTPS active and a real contact page visible. Baseline trust signals raters look for on every single site.
- Check your EEAT SEO metrics monthly. A once-a-month glance at the five signals above catches drift before it turns into a ranking problem.
Common Mistakes When Auditing EEAT
The most common mistake, by far, is treating a one-time checklist pass as proof of E-E-A-T instead of checking whether reader behavior actually changed.
- Mistaking a checklist for a score. Adding a bio and a contact page is a starting point, not a finish line. Check the analytics to confirm it’s actually landing.
- Expecting overnight results. E-E-A-T changes move slowly. Judging results after one week will only lead you to the wrong conclusion.
- Assuming GA4 shows branded search automatically. It doesn’t. You need Search Console linked to see actual brand-name queries.
- Copying competitor bios instead of writing original ones. Generic, copied bios fail Experience and Trustworthiness just as fast as no bio at all. Google can tell the difference.
EEAT Tracking Checklist
- Author bios present on all key pages
- HTTPS active site-wide
- Contact page visible
- Original, first-hand examples in place
- Engagement rate checked monthly (Engagement >> Pages and screens)
- Returning users checked monthly (Retention)
- Organic traffic and channel mix checked monthly (Traffic acquisition)
- Search Console linked for branded query data
- 90-day before/after comparison run after each round of fixes
Frequently Asked Questions
1. What does E-E-A-T stand for?
E-E-A-T stands for Experience, Expertise, Authoritativeness, and Trustworthiness. It’s the framework Google’s human Quality Raters use to judge content quality, first introduced as E-A-T in 2014, with Experience added in December 2022.
2. Is E-E-A-T a Google ranking factor?
No, Google has repeatedly confirmed E-E-A-T is not a direct ranking factor. It shapes the Quality Rater feedback that trains Google’s ranking algorithms, so strong E-E-A-T signals tend to correlate with better, more stable rankings even without being a formula input.
3. Which GA4 report should I check first for EEAT SEO?
Start with Reports >> Engagement >> Pages and screens. It covers both Experience and Expertise proxies at once, engagement rate and average engagement time, so it’s the fastest single report to establish a baseline before checking the other three.
4. Why isn’t my EEAT SEO showing any improvement in analytics?
Nine times out of ten, it’s because you checked too soon. E-E-A-T-driven changes usually take three to six months to show up clearly, so a one-week or even one-month window will often look flat even when your fixes are genuinely working. The second most common reason is fixing only one pillar, usually adding bios, while ignoring the rest, since Google’s raters weigh Trust the heaviest of the four.
5. How long does it take to see EEAT improvement?
Most E-E-A-T-driven changes take three to six months to show clearly in rankings or engagement data. Compare 90-day windows before and after a round of fixes rather than checking daily, since day-to-day fluctuation won’t reflect the underlying trend.
Next Steps
If your login page is still the default WordPress screen, LoginPress lets you turn that into a branded, trust-building first impression to match the E-E-A-T work you just did.
- Run the audit checklist above against your top 10 pages this week.
- Open Engagement >> Pages and screens, Traffic acquisition, and note today’s baseline numbers.
- Recheck the same reports in 90 days to see whether your fixes moved the needle.
Track engagement, returning visitors, and acquisition reports directly inside WordPress: Start tracking with Analytify.