What is a Dimension in Google Analytics (Explained 2026)
What is a Dimension in Google Analytics, and why does it matter in 2026?
If you’re using Google Analytics 4 (GA4), you’ve likely come across the term dimension. Understanding dimensions is more important than ever. They allow you to segment your audience, uncover trends, and make smarter marketing decisions, especially when paired with metrics.
In this guide, we’ll learn the concept of dimensions, how they differ from metrics, how to set them up in GA4, and how tools like Analytify make it easy to view and understand these insights, right from your WordPress dashboard.
Let’s get started!
GA4 Dimensions (TOC):
What is a Dimension in Google Analytics?
In Google Analytics 4 (GA4), a Dimension is a descriptive attribute or characteristic of your data. It helps you understand the context behind your numbers. While Metrics show you how much or how many (e.g., number of users or sessions), dimensions tell you more about who the users are and how they interact with your site or app.
For example, if you know 10,000 users visited your website (Metric), Dimensions can show:
- Device category: Which device did they use (mobile, desktop, or tablet)
- Browser: Where they came from (Google, Facebook, direct traffic)
- Geographic location: Which country or city they are located in
- Landing Page: Which page did they land on first
Each Dimension consists of the following:
- Dimension Name: This is the category or label used to describe the data (e.g., Device Category).
- Dimension Value: This is the actual value recorded for that category (e.g., Mobile).
These structural components help you understand and organize your data within a dimension in Google Analytics.
Why are Google Analytics Dimensions important?
In GA4, Dimensions are essential for segmenting and analyzing user behavior, as they enable you to break your audience into meaningful groups based on attributes such as device type, location, or traffic source.
This helps you spot trends, compare behaviors, and make smarter marketing decisions. For example, if users from mobile devices in the United States have a higher conversion rate than desktop users, it may signal that your mobile experience is more effective. However, you need to improve the experience for your desktop users.
In GA4, Dimensions and Metrics work together in every report. Let’s say you want to analyze the performance of your traffic sources. You can use Source/Medium as a Dimension and pair it with Metrics like Users, Engagement Rate, or Conversions to see which channels are most effective.
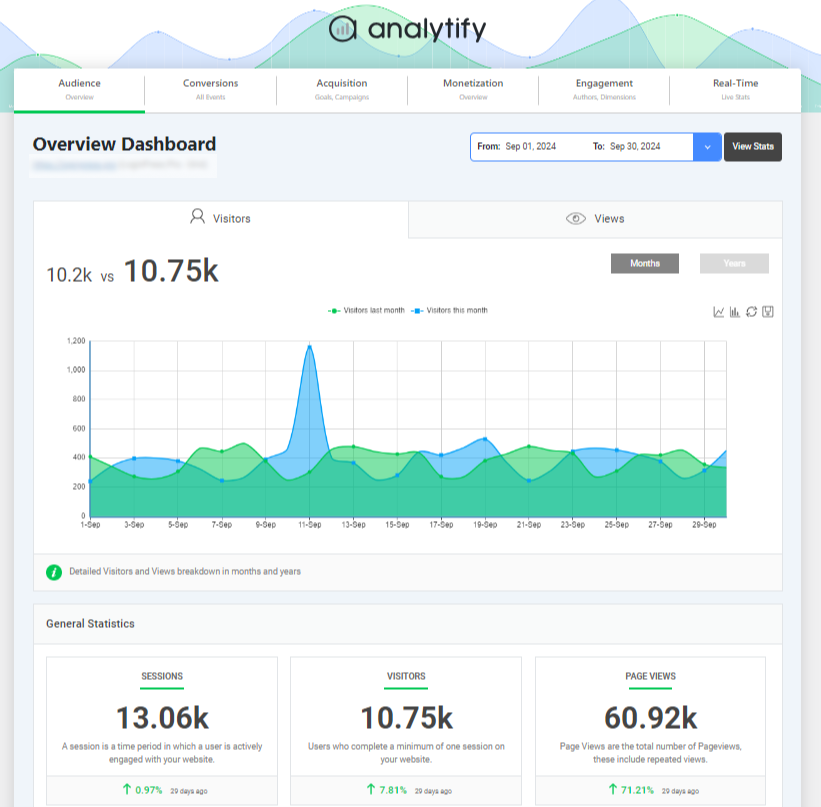
To make things even simpler, tools like Analytify bring these Dimensions directly into your WordPress dashboard. You can easily view reports broken down by location, devices, traffic sources, and more without needing to dig through the GA4 interface.
Dimensions vs. Metrics: A Comprehensive Difference
Dimensions in Google Analytics describe the qualitative attributes of your data, such as device type, traffic source, or page title, which provide context for user behavior.
Metrics are quantitative measurements in Google Analytics that show how much or how many, helping you understand user actions on your website or app. They provide the numerical values behind your data, allowing you to track performance over time. In GA4, Metrics help answer questions like:
- How many people visited my website? (Users)
- How often did people engage with my content? (Engagement rate)
- How many pages were viewed in total? (Page views)
- How many goals were completed? (Conversions)
The key differences between Dimensions and Metrics in Google Analytics are described below:
| Aspect | Dimensions | Metrics |
| Definition | Qualitative attributes that describe your data | Quantitative values that measure user behavior |
| Type of Data | Textual or categorical (who, what, where) | Numerical (how much, how many) |
| Purpose | Provide context and segment data | Measure performance and volume |
| Examples | Device type, Browser, Country, Traffic Source | Sessions, Page Views, Conversions, Bounce Rate |
Dimensions and Metrics work together to turn raw data into actionable insights. The conversion rate by traffic source is a practical example that shows how Dimensions link with Metrics to help you analyze user behavior effectively:
- Dimension: Traffic Source (e.g., Google, Facebook, Direct)
- Metric: Conversion Rate
If Google has a 5% conversion rate, Facebook has a 2% rate, and Google Ads has a 15% rate, you might consider investing more in Google Ads or analyzing why Facebook traffic converts less effectively.
Types of Dimensions in Google Analytics
In Google Analytics 4 (GA4), Dimensions are categorized based on the type of data they describe. The four main types of Dimensions are:
1. Session Dimensions
Session Dimensions describe the details of a single visit or session on your website or app. These include attributes like:
- Session duration
- Traffic source
- Landing page
- Session start timestamp
For example, you can track how long users from Google Ads stay on your site or which pages they land on most often. This helps identify high-performing campaigns or entry points that drive engagement.
2. User Dimensions
User Dimensions provide insights into the characteristics of your visitors. These are based on data such as:
- User location (country, city)
- Device type (mobile, tablet, desktop)
- Browser or operating system
- Language settings
By analyzing User Dimensions, businesses can tailor their content and UX design. For instance, if most visitors are using mobile devices from a specific region, optimizing your mobile site for that region can improve performance.
3. Event-based Dimensions
Event-based Dimensions in Google Analytics 4 (GA4) refer to attributes that describe specific user interactions tracked as events.
Unlike the older session-based model in Universal Analytics, GA4 is entirely event-driven, meaning every user action is captured as an individual event. Event Dimensions describe these actions, such as:
- Button clicks
- Video plays
- Form submissions
- Scroll depth
These Dimensions are valuable for understanding specific interactions. For example, tracking video engagement can help content creators see what content holds user attention and what needs improvement.
By using these Dimension types effectively, businesses can better understand their audience, improve user experience, and optimize their marketing strategies.
Practical Applications of Dimensions in Google Analytics
Here are the following practical applications of dimensions in Google Analytics:
Segmenting Traffic
Dimensions such as Device Category, Traffic Source, and Geographic Location enable you to break down your audience into specific segments. For example, by using the Device Category dimension, you can compare how users behave on desktops versus mobile devices. If mobile users have a lower engagement rate, this may signal a need for better mobile optimization.
Understanding User Behavior
User behavior varies widely based on location, technology, and content. Dimensions such as Country, City, or Browser help uncover patterns. For instance, if users from one country have a high bounce rate, you may need to localize your content or improve load times in that region. Similarly, Dimensions like Landing Page or Page Title reveal which content attracts the most traffic and holds user attention.
Refining Marketing Strategies
With Dimensions like Source/Medium or Campaign Name, you can see which marketing channels drive the most engaged traffic. If “Google / organic” brings more conversions than “Facebook/referral,” you may decide to invest more in SEO. This enables a more effective allocation of marketing budgets and enhanced campaign targeting.
Note: Analytify makes it easy to access and visualize these dimensions within your WordPress dashboard. No technical setup required, just clear, accessible insights for your site.
By applying Dimensions strategically, you turn raw data into actionable insights that directly support your goals.
How to Set Up Dimensions in GA4 (Step-by-Step Guide)
In this guide, we’ll cover the setup process for two types of dimensions in GA4:
- Standard dimensions ( Primary & Secondary )
- Custom dimensions
Set up Standard Dimensions
In Google Analytics 4 (GA4), you don’t need to set up standard dimensions manually. They are automatically tracked as part of GA4’s built-in data collection. They can be used as both primary and secondary dimensions in your reports.
These dimensions include commonly used attributes like:
- Device type
- Browser
- Country and city
- Traffic source (Source/Medium)
- Page path or landing page
- Language
- Platform (Web or App)
Here is how to view and access standard dimensions:
Step 1: Go to Your Reports
Log in to your Google Analytics 4 property and navigate to the Reports section from the left-hand menu.
Step 2: Choose a Report
Select any standard report, such as:
- User (Demographics or Tech)
- Acquisition (Traffic Acquisition)
- Engagement (Pages and Screens)
These reports already utilize standard dimensions, such as Country, Device Category, and Source/Medium.
Step 3: Add or Change Dimension
- Viewing the primary dimension displayed by default (e.g., Page title).
- You can also click the dropdown arrow next to the current dimension name in the table to select a different one, such as “City” or “Device category.”
- In the data table, click the “+” icon next to the primary dimension name (Page title).
- Select a second dimension from the list (e.g., Device category, Browser, or Country).
- GA4 will now display a secondary dimension alongside the original one for deeper comparison.
Set up Custom Dimensions:
While standard dimensions in GA4 may not capture all the unique actions or attributes relevant to your business, custom dimensions come in to fill the gap.
You may also want to define your custom dimensions based on specific business needs, such as tracking user roles, product categories, or button click labels. Let’s look at how to set them up.
Step 1: Log in to GA4
Go to Google Analytics and sign in to your GA4 account.
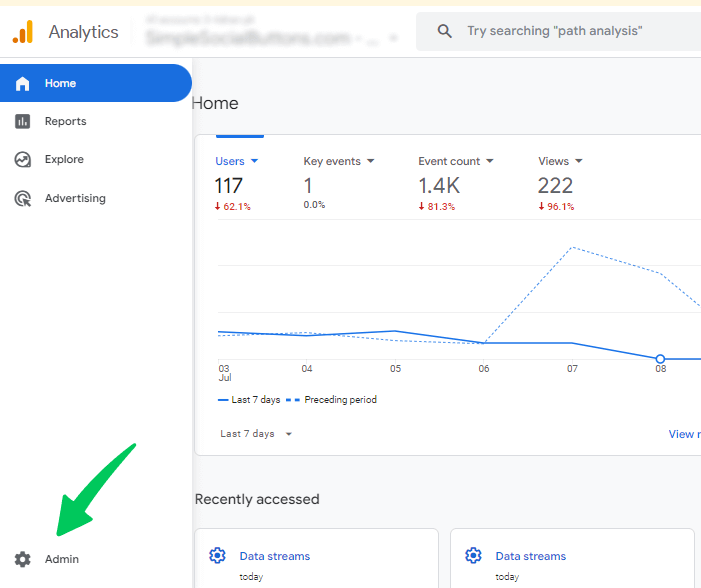
Step 2: Open the Admin Panel
In the lower-left corner, click on Admin to access your property settings.
Step 3: Navigate to Custom Definitions
Under your selected property, click on Custom Definitions.
Step 4: Create a New Custom Dimension
Click on the Create Custom Dimension button.
Enter the following information:
- Dimension Name (e.g., link URL)
- Scope: Choose either User or Event
- Description (optional)
- Event Parameter or User Property to associate with the dimension
Step 6: Save the Custom Dimension
Click Save, and GA4 will begin collecting data based on your custom setup.
Check out our complete guide: GA4 Custom Dimensions
A practical, easy-to-follow guide for users to set up custom dimensions in their Google Analytics 4 property.
How Analytify Helps to Configure GA4 Dimensions
Join 50,000+ beginners & professionals who use Analytify to simplify their Google Analytics!
Setting up and understanding GA4 dimensions and metrics can be complex, especially for beginners and non-technical users. Analytify removes this complexity.
Analytify, the best Google Analytics WordPress plugin, simplifies this process by offering a user-friendly interface within WordPress that displays your GA4 data. It allows you to view GA4 dimensions and metrics without needing to navigate into the GA4 dashboard.
Here’s how Analytify visualizes key GA4 data using dimensions and metrics:
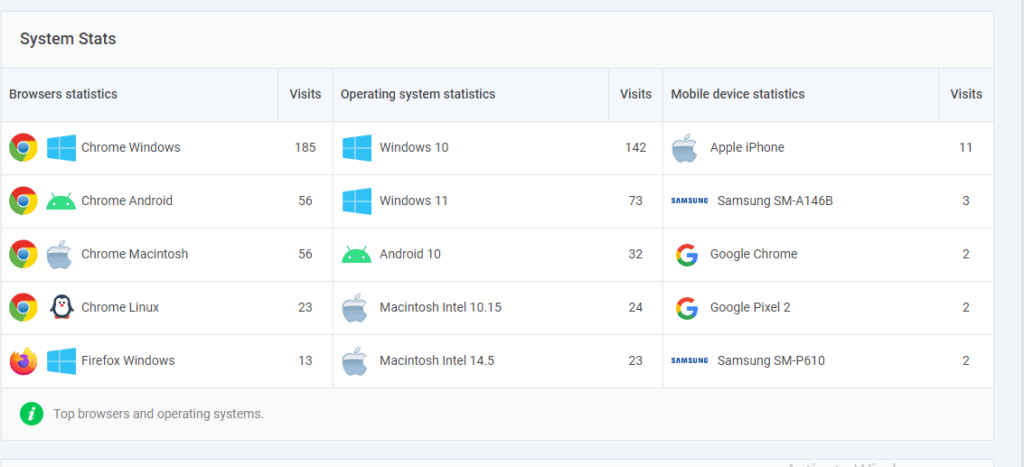
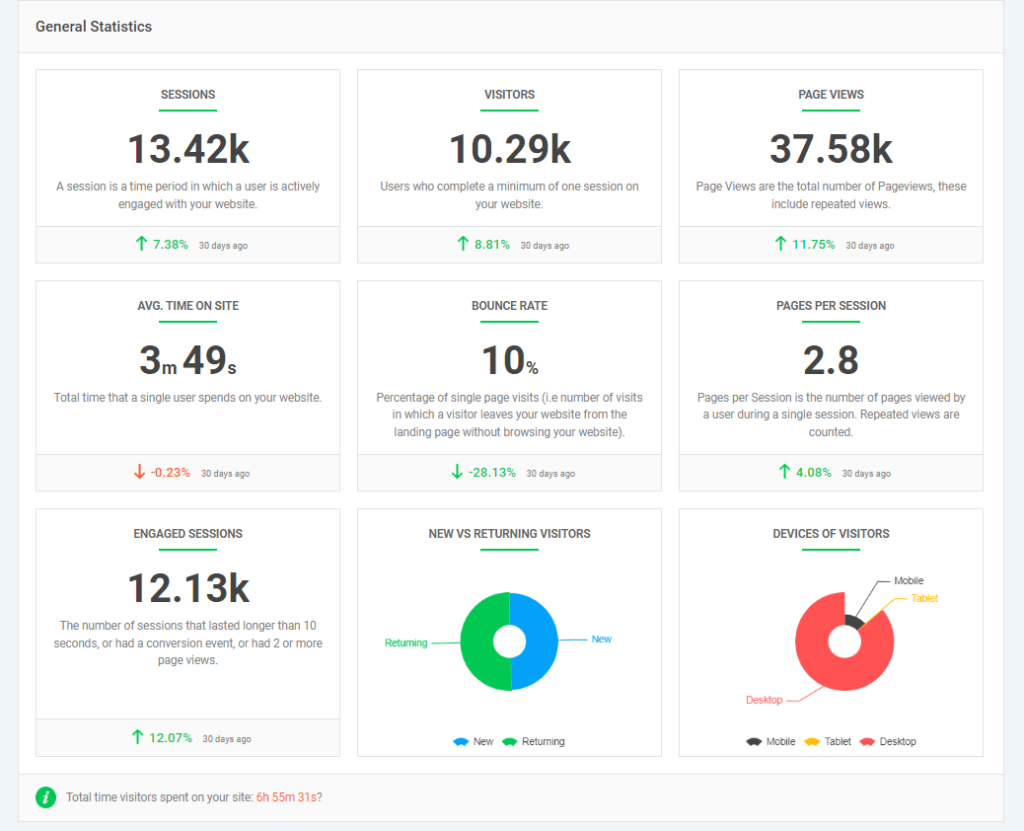
- Displays which devices, browsers, and operating systems users are using to visit your site, helping you understand the technical environment of your audience.
- Shows the age groups and genders of your visitors, providing insight into the demographic makeup of your audience for more effective targeting.
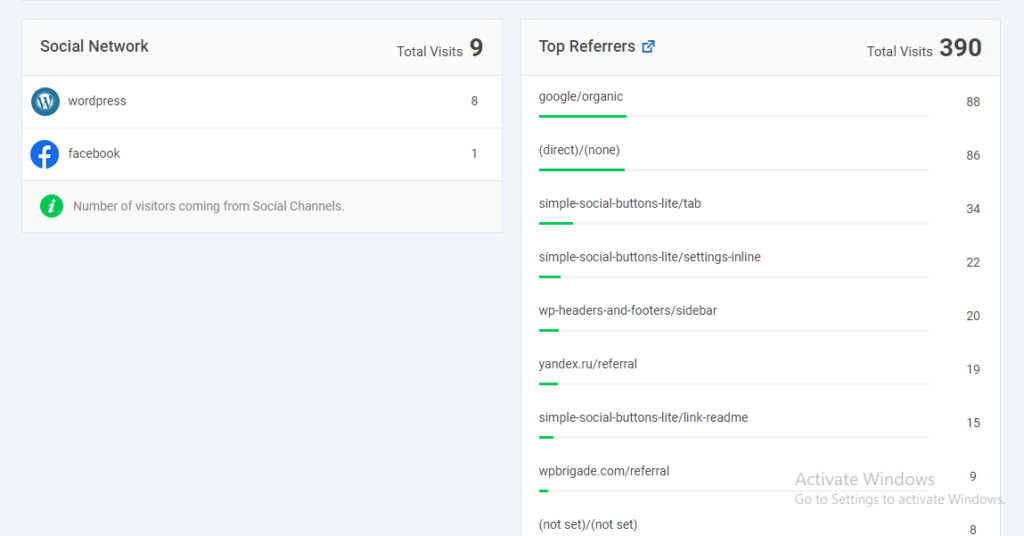
- Reveals where your visitors are coming from, including organic search, social media, referrals, or direct traffic. So you know which channels drive the most traffic.
- Provides an overview of key metrics (such as sessions, users, and bounce rate) alongside related dimensions in a simplified format.
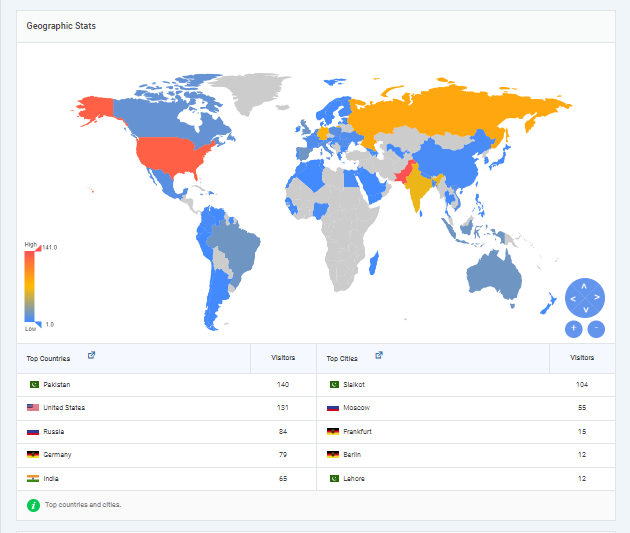
- Shows where your users are located by country, region, or city, helping you understand the geographic spread of your audience.
By mapping the right dimensions to the right metrics and visualizing them in categorized dashboards, Analytify makes GA4 reporting much more accessible, with no coding or manual setup required. Analytify makes it easier to understand how dimensions impact your site performance, all from your WordPress dashboard.
Frequently Asked Questions About Google Analytics Dimensions
1. What is a Dimension in Google Analytics?
A dimension in Google Analytics refers to a descriptive attribute or characteristic of your data, like a user’s location, device type, or traffic source. Dimensions help you understand what or who is interacting with your website or app.
2. How do Dimensions and Metrics work together?
Dimensions and metrics are paired to generate meaningful reports. For instance, you can measure the bounce rate (metric) by device category (dimension) to understand performance across devices.
3. Can I create custom GA4 Dimensions?
Yes, GA4 allows you to create custom dimensions to track data specific to your business, like user roles or author names. These go beyond default GA4 dimensions and require manual setup in the Admin panel.
4. Where can I see GA4 Metrics in reports?
You can view GA4 metrics in all standard and custom reports. They appear as numeric columns alongside dimensions and display values such as total users, average engagement time, and event counts.
5. Why is understanding Metrics vs Dimensions important?
Understanding metrics vs dimensions is key to analyzing your data effectively. Dimensions give context (like “Country”), while metrics provide measurement (like “Sessions”). Both are essential for building accurate GA4 reports.
6. What is a metric in Google Analytics?
A metric in Google Analytics is a quantitative measurement that tells you how much or how many. Metrics provide the numerical values behind user behavior—such as sessions, page views, bounce rate, conversion rate, and average session duration.
Final Thoughts: What is a Dimension in Google Analytics
We started by learning the definition of dimensions and how they differ from metrics. Dimensions provide the contextual “who, what, and how” behind that data, such as device type, traffic source, or geographic location. This combination is the foundation of all meaningful reporting in GA4.
We explored the three main types of GA4 dimensions: session, user, and event-based, and discussed their practical applications, such as segmenting traffic, understanding user behavior, or refining your marketing strategy.
Next, we walked through the step-by-step setup of dimensions in GA4, covering both standard dimensions (which are built-in and used as primary or secondary dimensions in reports) and custom dimensions. Then we highlighted how Analytify helps overcome the complexity of configuring and viewing GA4 dimensions and metrics. From system stats and demographic dashboards to geographic insights and traffic sources, Analytify displays structured data right inside your WordPress dashboard.
For further guidance, you can read:
- 7 Best User Engagement Metrics in GA4
- Custom Metrics in Google Analytics 4
- 11 Key Customer Engagement Metrics to measure
Which GA4 dimension do you find most useful for your business? Share your thoughts or questions in the comments. We’d love to hear from you!


