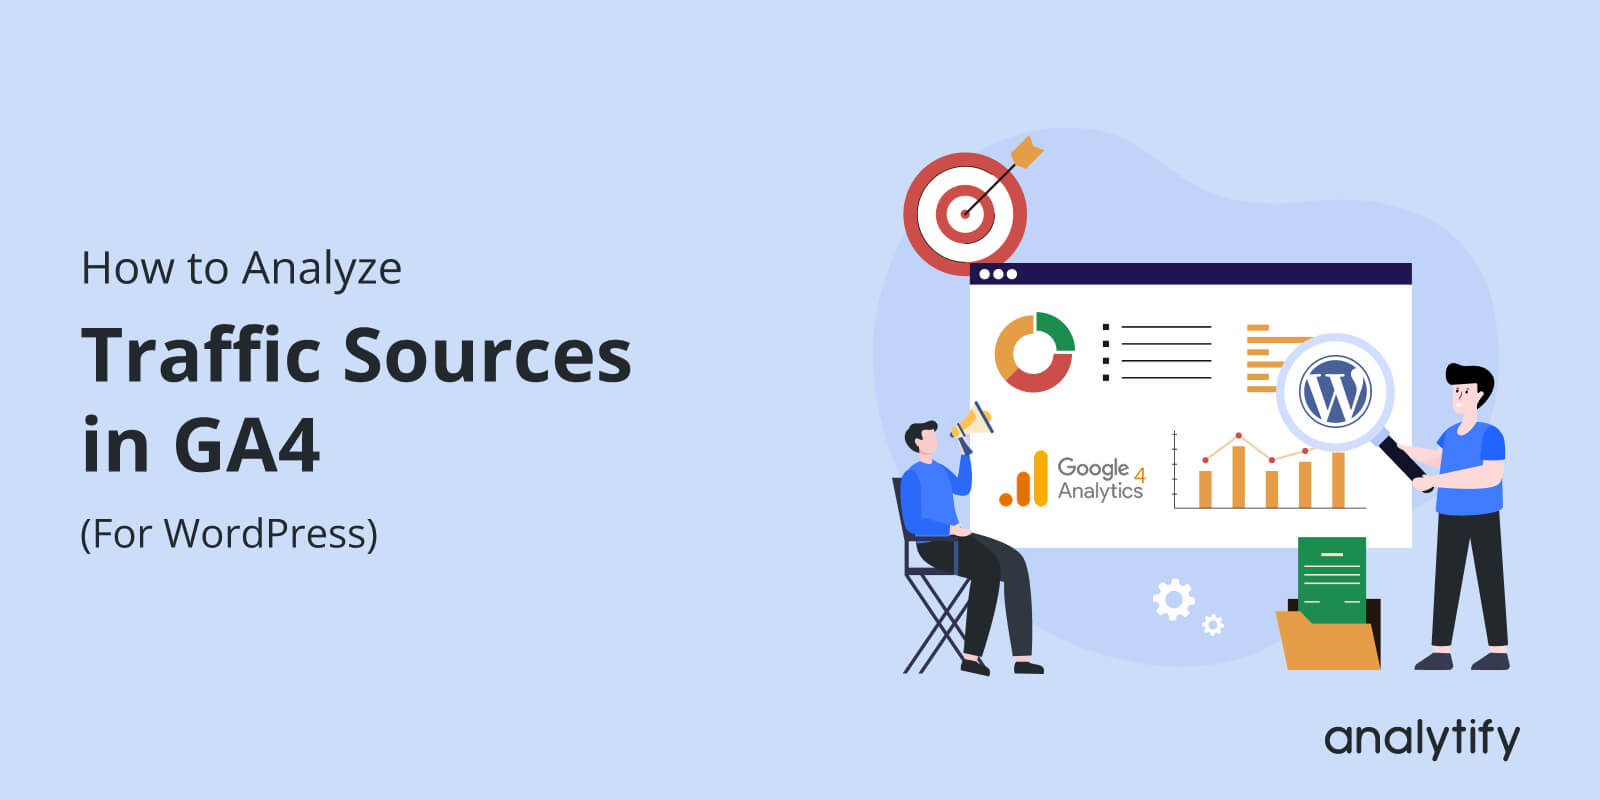
How to Analyze Traffic Sources in GA4 (Step-by-Step)
Are you struggling to understand GA4 traffic sources and identify which channels actually drive visitors to your site?
You’re not alone; many WordPress users find GA4 confusing, especially when trying to figure out where their traffic really comes from. Your website gets visitors from search, social, referrals, and paid campaigns, and knowing which channels work best can transform your marketing.
That’s why analyzing GA4 traffic sources matters. It shows how people find your site, which channels bring engaged users, and which ones need improvement. With these insights, you can boost SEO and refine your content.
In this guide, I will discuss how GA4 traffic sources work and how to analyze them step by step using the Acquisition reports. You’ll also learn how Analytify brings all GA4 traffic insights directly into your WordPress dashboard.
Let’s get started!
GA4 Traffic Sources (TOC):
What Are Traffic Sources in GA4?
Traffic sources in Google Analytics 4 explain where your website visitors come from and how they first arrive on your site.
In simple terms, GA4 breaks down all incoming traffic into categories like organic search, paid search, social media, direct visits, referrals, email, and affiliate or campaign-based traffic.

These traffic sources in Google Analytics help you understand which platforms or marketing efforts are driving people to your website and how effective each channel truly is.
In GA4, the traffic source is recorded when a user begins a new session. It captures three key identifiers: source, medium, and campaign.
- The source tells you where the visitor came from (e.g., Google, Facebook, or a newsletter).
- The medium reveals how they arrived, for example, organic search, paid ads, or a referral link.
- The campaign dimension becomes essential when you use UTMs, helping you track specific marketing initiatives.
Understanding Google Analytics 4 traffic source is essential because it shows which parts of your marketing strategy are performing well and where improvements are needed.
If organic search is driving most visits, you know your SEO is strong. If paid campaigns are bringing traffic but not conversions, you may need to refine your targeting orlanding pages. Likewise, if social media sources show low engagement, your content or platform choice might need adjustment.
Tracking traffic sources in Google Analytics also helps you improve user experience. By seeing where users come from, you can optimize pages, fix navigation issues, and personalize content for different audiences.
Understanding GA4 Acquisition Reports
GA4 acquisition reports help you understand how people find your website and which channels bring the most valuable traffic.
Unlike the older Universal Analytics model, GA4 focuses on users and events, giving you a clearer view of visitor behavior from the moment they land on your site.
The Google Analytics acquisition report is divided into two main sections:
- User Acquisition: focuses only on first visits (new users).
- Traffic Acquisition: includes every session, new + returning users arrive on your site.

The User Acquisition report shows which channels are attracting new audiences, including organic search, social media, email, and paid campaigns.
The traffic Acquisition report shows the channels responsible for every visit. If you’re analyzing total performance, engagement, or conversions across all user types, the Traffic Acquisition report provides a more complete view.
GA4 uses a set of core metrics in its acquisition reports to help you understand how different traffic sources perform. These metrics highlight both the quantity and quality of visitors to your website.
- Users: Shows the number of people who visited your site. User Acquisition counts only new users, while Traffic Acquisition includes all users.
- Sessions: Represents a single visit to your website. One user can start multiple sessions, helping you see which channels drive the most activity.
- Engagement Rate: The percentage of sessions where users interacted meaningfully, such as scrolling, clicking, or staying on your pages for a specific time.
- Conversions (Key Events): Tracks important actions like purchases, sign-ups, or form submissions, showing which traffic sources drive your primary goals.
- Engaged Sessions: Counts sessions where users stayed at least 10 seconds, viewed 2+ pages, or triggered a conversion event.
- Average Engagement Time: The average time users spent actively interacting with your website during their sessions.

One of the most important views in this section is the source/medium report in GA4. This report tells you exactly where your traffic comes from (source) and how users arrived (medium).
For example, “google / organic” means someone came from a Google search, while “facebook/referral” indicates a visitor followed a link from Facebook.
This breakdown is crucial because it helps you understand which channels, campaigns, or platforms are performing well and which ones need attention.
Here are tips for beginners for navigating GA4 acquisition reports:
- Check the User Acquisition report separately to understand which channels bring new users.
- Use the source/medium dimension to see exactly where your traffic comes from and how users reach your site.
- Use the search bar in reports to quickly locate a specific traffic source or campaign.
- Look at Engagement Rate and Conversions, not just Users, to judge traffic quality rather than just volume.
- Add secondary dimensions (like landing page or device category) to understand how different users behave.
- Make sure all your marketing campaigns use UTM parameters so GA4 can accurately track your traffic sources.
How to Analyze Traffic Sources in GA4 (Step by Step)
Here are the following steps you should follow to analyze the traffic sources in GA4:
Step 1: Log in and Open your GA4 Property
Sign in to Google Analytics and choose the GA4 property for the website you want to analyze. Confirm you’re in the correct property and data stream before proceeding.
Step 2: Open the Traffic Acquisition Report
- Go to Reports >> Acquisition >> Traffic acquisition.

- This view shows session-based traffic by default and gives a quick channel-level snapshot (organic, paid, social, referral, direct). It’s the best place to start your analysis.

Step 3: Understand Channels, Source, Medium, and Campaign
- Channel / Default Channel Group = grouped channels like Organic Search, Paid Search, Social, and Referral.
- Source = the origin (e.g., Google, Facebook.com).
- Medium = how the visitor arrived (organic, cpc, referral).
- Campaign = the UTM campaign name used to tag specific promotions.
Use the Session source/medium and Session default channel group dimensions to see the split between channels and exact source/medium combinations. This breakdown is key to accurate UTM traffic analysis.
Step 4: Inspect Key Metrics
Look beyond Users and Sessions, evaluate Engagement Rate, Conversions (key events), Engaged Sessions, and Average Engagement Time for each source/medium. Sort by conversions or engagement rate to identify high-quality channels, not just high-volume ones.
Step 5: Change the Primary Dimension to View Data From Every Angle
- In the Traffic acquisition report, you can switch the primary dimension using the dropdown arrow in the table.

- Select options like Session source/medium, Session default channel group, Session campaign, or Session source.

This lets you analyze traffic at the channel, platform, or UTM campaign level, helping you see where your visitors come from with greater accuracy.
Step 6: Choose a Date Range to Focus Your Analysis
- Use the date selector in the top-right corner of GA4 to choose a specific period. You can select presets like Last 7 days, Last 28 days, This month, or apply a custom date range.

This ensures you’re measuring website traffic sources for the exact time frame you want to study.
Step 7: Apply Time Comparison for Performance Trends
- Click the Compare toggle in the date selector to compare your selected date range with a previous period (e.g., the previous week, the previous month, or the same time last year).

This feature helps you see if traffic sources are growing, declining, or stabilizing over time, making trend analysis much easier.
Step 8: Apply Filters to Narrow Down Insights
Use the Add filter option to view specific parts of your traffic. For example, filter by:
- Source/Medium (Google / organic, Facebook/referral, etc.)
- Default Channel Group (Organic Search, Paid Search, Social, Email)
- Campaign (UTM-tagged marketing campaigns)
- Device category (mobile, desktop)

Filters help you drill into one segment at a time and highlight which channels perform best for different audiences or campaigns.
Step 9: Use the Comparison Option to Compare Traffic Sources
- In the Traffic acquisition report, click the “Add comparison” button located on the top-left of the report.

- Choose a specific traffic source or channel, such as Organic Search, Referral, Paid Search, or Social, and add another one to compare side by side.

This lets you directly compare how different sources perform across users, sessions, engagement rate, and conversions.
Step 10: Export Data for Deeper Reporting
If you need custom charts or combined data, export the report to CSV, Google Sheets, or connect GA4 to BigQuery. Use exported data when building dashboards or performing advanced analyses in spreadsheets.

Step 11: Save Reports and Build a Routine
Save custom reports and check acquisition regularly. Use insights to reallocate budget or improve landing pages for channels that drive conversions.
How to Visualize Traffic Sources in WordPress with Analytify
Join 50,000+ beginners & professionals who use Analytify to simplify their Google Analytics!
For many website owners, analyzing traffic sources in Google Analytics 4 can feel overwhelming, especially for beginners. Important metrics such as source/medium, channels, conversions, and engagement are scattered across multiple menus, making it difficult to get a clear overview quickly. This is where Analytify comes in.
Analytify is the best Google Analytics plugin for WordPress. Analytify brings all your GA4 traffic sources directly into your WordPress dashboard. It makes analytics easy to read, beginner-friendly, and accessible without requiring a GA4 login every time.
With seamless GA4 integration, Analytify automatically pulls acquisition, behavior, and conversion data into simple charts and tables that provide actionable insights at a glance.

One of Analytify’s standout features is the Traffic Sources report on the WordPress dashboard. This report displays all visitor sources, including Organic Search, Paid Search, Social, Referral, Direct, and Campaign traffic. You can instantly see which channels are performing best without sifting through GA4 menus.

For websites running multiple marketing campaigns, the Campaign Tracking Addon takes this further by allowing you to track UTM-tagged campaigns. It will monitor campaign performance and analyze which marketing efforts are driving the highest conversions, all directly within WordPress.
Beyond traffic sources, Analytify provides a Devices report that shows how visitors access your site, whether via desktop, mobile, or tablet.

The Geographic report helps you understand where your visitors are coming from, making it easier to tailor content and campaigns for specific regions.

Analytify also includes a General statistics report that highlights key metrics, including conversions, engagement rate, new vs. returning users, and sessions. These insights let you evaluate the quality of your traffic and measure the effectiveness of your marketing campaigns in one place.

For real-time insights, the Real-Time Traffic dashboard shows live visitor activity, including current sessions and page views. This feature is perfect for monitoring campaigns as they launch or checking immediate user behavior after publishing new content.

Overall, Analytify simplifies WordPress traffic analysis, making it easier to measure website traffic sources, track campaigns, and optimize performance without switching multiple tools or opening the GA4 interface.
Advanced Tips for Traffic Source Analysis
Here are the following tips for tracking Traffic Source Analysis:
- Segment traffic by device, geography, or behavior
Add secondary dimensions such as device category (mobile, desktop, tablet), country, or user type (new vs returning) to see how different visitor types interact with your site. This helps uncover patterns in engagement and performance across channels. - Combine UTM campaigns with GA4 metrics.
Tag all marketing URLs with UTM parameters and analyze them alongside key metrics like engagement rate, conversions, and average engagement time. This approach reveals whichcampaigns drive meaningful actions rather than just raw traffic. - Identify high-converting traffic sources.
Sort your Traffic Acquisition report by conversions or key events to spot the most valuable channels. Focus your budget and content efforts on the sources that deliver the highest ROI. - Set up alerts for sudden traffic changes.
Use GA4’s insights and custom alert features to monitor spikes or drops in traffic from specific channels. Alerts help you respond quickly to opportunities or issues, such as a sudden increase in Organic Search or a drop in Referral traffic. - Focus on quality, not just quantity.
Beyond Users and Sessions, review Engagement Rate, Conversions, and Average Engagement Time for each source. This ensures you measure real value from your traffic rather than just volume. - Regularly review and optimize
Revisit your reports frequently to track trends, refine campaigns, and adjust strategies based on which traffic sources consistently perform best.
Common Mistakes to Avoid in Traffic Source Analysis
Here are the following common mistakes to avoid in traffic sources analysis:
- Ignoring UTM parameters
Many marketers forget to tag campaigns with UTM parameters, leading to inaccurate tracking in GA4. Without UTM parameters, GA4 cannot correctly attribute traffic, making it hard to measure campaign performance. Always use utm_source, utm_medium, and utm_campaign consistently. - Confusing sessions with users
GA4 tracks both users (individual visitors) and sessions (visits), but beginners often confuse the two. A single user can have multiple sessions, so always interpret metrics carefully to avoid overestimating traffic volume. - Overlooking referral spam
Spammy or fake referrals can inflate your traffic reports and mislead your analysis. Regularly review your referral traffic, apply filters, and exclude internal traffic to maintain accurate data. - Not cross-checking GA4 with WordPress analytics.
Relying solely on GA4 without comparing it to WordPress tools like Analytify can lead to missed insights or discrepancies. Cross-checking ensures consistency and helps you catch tracking issues early. - Focusing only on traffic volume
Looking at Users or Sessions alone may hide the real value of traffic. Always consider engagement, conversions, and quality to make informed decisions.
Frequently Asked Questions About GA4 Traffic Sources
1. What are traffic sources in Google Analytics?
Traffic sources in Google Analytics show where your website visitors come from, including channels such as Organic Search, Paid Search, Social, Referral, Direct, Email, and Campaign. Understanding this helps you accurately measure website traffic sources.
2. How to check the Google Analytics 4 traffic source?
To check GA4 traffic sources, go to Reports >> Acquisition >> Traffic Acquisition. Here you can view channels, sources/mediums, and campaigns that drive traffic to your website. You can also analyze traffic sources in GA4 by applying filters or comparisons for more detailed insights.
3. How to analyze website traffic with Google Analytics?
Use the Google Analytics acquisition report to see which channels drive users, check engagement metrics such as session duration and engagement rate, and monitor conversions. You can also analyze traffic sources in GA4 by segmenting users by device, geography, or campaign.
4. What are the different types of traffic sources?
The main types of GA4 traffic sources include:
Organic Search: visitors from search engines
Paid Search: traffic from ads
Social: traffic from social media platforms
Referral: visitors from other websites linking to yours
Direct: users typing your URL or with no referrer
Email / Campaigns: tracked via UTM parameters for UTM traffic analysis
5. How do you display traffic in GA4?
Traffic can be displayed in GA4 using charts, tables, and graphs. Switch dimensions like source/medium, channel, or campaign in the source medium report in GA4, and apply filters or comparisons to measure website traffic sources effectively.
6. What is the difference between users & sessions?
Users represent individual visitors to your website.
Sessions count visits, so one user can have multiple sessions.
Users show your audience size, while sessions measure overall activity, which is important for WordPress traffic analysis and understanding how visitors interact with your site.
Final Thoughts: GA4 Traffic Sources
We’ve explored GA4 traffic sources from every angle. Let’s quickly recap what we covered. We began by understanding what traffic sources are in GA4 and why they matter for accurate WordPress traffic analysis. Then we discuss the Google Analytics acquisition report step by step, learning how to analyze traffic sources in GA4 using key dimensions like source/medium, channels, and campaigns.
After that, we explored how Analytify simplifies everything by bringing GA4 traffic insights directly into your WordPress dashboard, making it easier to measure website traffic sources without the confusion of the GA4 interface.
We also covered advanced tips, such as using UTM parameters for traffic analysis, applying secondary dimensions, segmenting users, and focusing on high-converting channels. Then we followed with common mistakes to avoid to keep your data accurate.
For further guidance, you can read:
- What is Display Traffic in Google Analytics?
- Top 20 Marketing Hacks for Website Traffic Growth
- How to Track Website Traffic with Google Analytics 4
Have you tried analyzing GA4 traffic sources using Analytify on your WordPress site? Share your experience or any questions in the comments. We’d love to hear how you track and grow your traffic!