Google Tag Manager Preview Mode (A Complete Guide)
Are you looking for a way to use Google Tag Manager Preview Mode? If so, here is the guide for you.
Google Tag Manager is a powerful tool for managing tracking codes and tags without modifying your website’s code. But before publishing any changes, it’s important to test them. This is where Google Tag Manager Preview Mode comes in.
GTM Preview Mode helps you check if your tags are firing correctly. It shows real-time data about events, triggers, and variables. This allows you to debug and fix issues before your changes go live.
In this guide, you will learn what GTM Preview Mode is, why it’s useful, how to enable and use it effectively, and what best practices for debugging are.
Let’s get started!
Google Tag Manager Preview Mode (TOC):
What is Google Tag Manager Preview Mode?
GTM Preview Mode is a built-in debugging feature that allows you to test your tags before publishing them. It provides a detailed view of how tags behave on your website in real-time.
Why Use GTM Preview Mode?
- Ensures your tags fire correctly
- Helps debug tracking issues before going live
- Saves time by identifying errors early
- Prevents data discrepancies in analytics tools
When you enable Preview Mode, GTM loads a debugging panel. This panel shows:
- Which tags fired and which didn’t
- What triggers activated the tags
- The values of variables at different stages
- Data layer updates
Preview Mode is essential for making sure your tracking setup works as expected. Now, let’s move on to how you can enable it.
How to Enable Google Tag Manager Preview Mode
Before enabling Preview Mode, ensure you have GTM set up on your website. If you haven’t installed GTM yet, follow this Google Tag Manager Setup Guide.
Step-by-Step Guide to Enabling GTM Preview Mode
Step 1: Log into GTM: Open your Google Tag Manager account.
Step 2: Select Your Container: Choose the GTM container you want to debug.
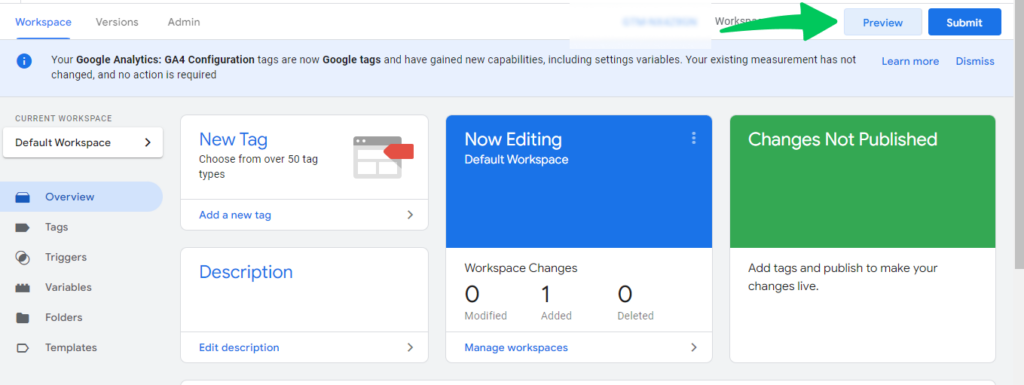
Step 3: Click on Preview: Find the Preview button in the top-right corner of the GTM dashboard and click it.
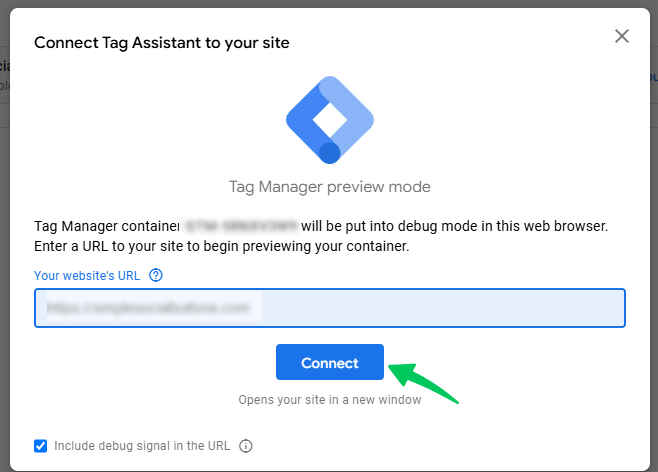
Step 4: Enter Your Website URL: A new window will open asking for the website URL where you want to test GTM tags.
Step 5: Enter the URL and click Connect.
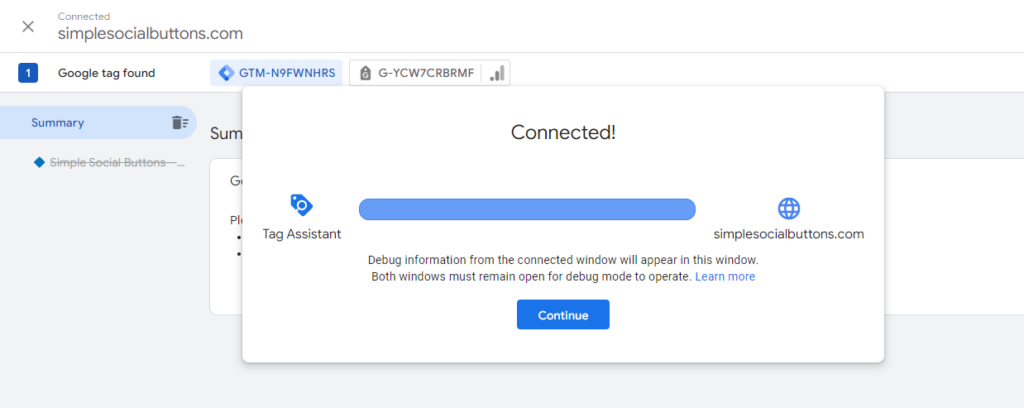
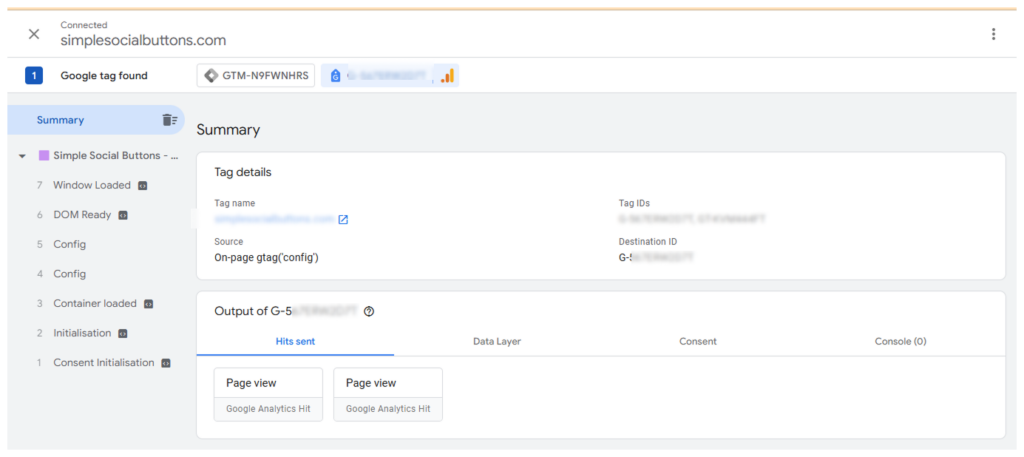
Step 6: Your website will open in a new tab with Tag Assistant Debug Mode enabled.
Step 7: Confirm Connection: Go back to the GTM Preview window and check if it shows Connected.
- If it says “Not Connected,” make sure your website has the correct GTM container installed.
Step 8: Start Debugging: Now, you can test how your tags fire in real-time.
Navigating the Debug Panel
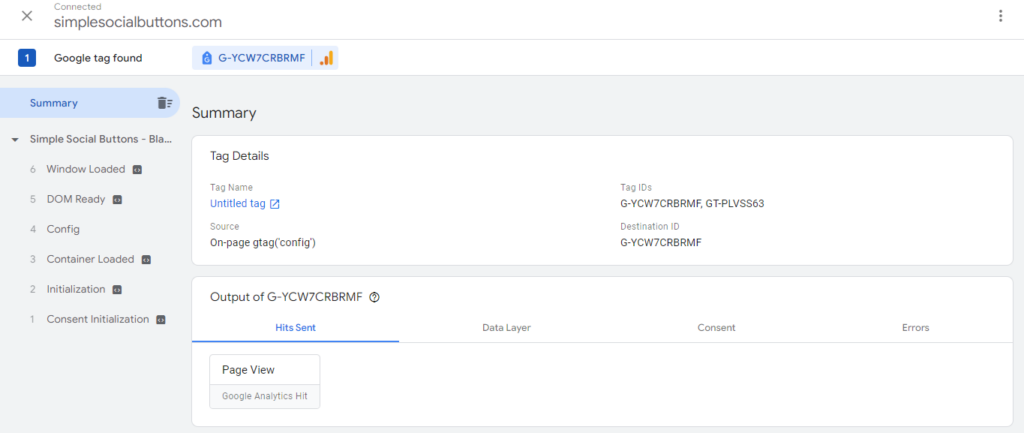
Once Preview Mode is active, you will see the Tag Assistant Debug Panel. It includes:
| Debug Panel Section | Purpose |
| Event Timeline | Displays all events triggered on the page. |
| Tags Tab | Shows which tags fired and which didn’t. |
| Variables Tab | Displays values for each GTM variable. |
| Data Layer Tab | Logs updates to the data layer. |
| Errors Tab | Highlights any issues with tag execution. |
With this setup, you can analyze your tags and fix any issues before publishing changes.
How to Use Google Tag Manager Preview Mode
Now that Preview Mode is enabled, here’s how you can use it effectively:
Step 1: Trigger Events on Your Website
Once Preview Mode is active, interact with your website to trigger events. For example:
- Click buttons that should fire tags.
- Submit forms to check conversion tracking.
- Navigate through pages to test pageview tracking.
Step 2: Analyze the Debug Panel
Look at the Tag Assistant Debug Panel to see:
- Which tags fired and their triggers.
- What data layer variables were captured?
- Any errors preventing tags from firing.
Step 3: Check Specific Tags
Go to the Tags Tab to view:
- Tags that fired successfully.
- Tags that failed to fire and their conditions.
- The reason why a tag did not fire.
Step 4: Review Variables
Open the Variables Tab to check:
- Values of GTM variables.
- Data layer information at each step.
- If the variables are passing the expected values.
Step 5: Debug and Fix Issues
If a tag is not firing:
- Check its trigger conditions.
- Ensure the required variables are defined.
- Verify that the GTM container is correctly installed.
After making changes, refresh Preview Mode and test again to confirm fixes.
Troubleshooting Common Issues in GTM Preview Mode
Sometimes, Preview Mode may not work as expected. Here are common issues and how to fix them:
1. GTM Preview Mode Not Connecting
Issue: The Preview panel says “Not Connected.”
Fix:
- Ensure your website has the correct GTM container installed.
- Disable browser extensions that may block scripts (e.g., ad blockers).
- Clear your browser cache and try again.
- Use an incognito window to rule out cookie-related issues.
2. Tags Not Firing
Issue: Some tags are not firing when expected.
Fix:
- Check trigger conditions to ensure they match the expected event.
- Verify that the necessary variables are available in the Variables Tab.
- Look at the Errors Tab for any tag-related issues.
3. Data Layer Values Not Updating
Issue: Your data layer variables are not updating correctly.
Fix:
- Use the Data Layer Tab to check the sequence of data updates.
- Ensure that variables are properly pushed into the data layer before they are needed.
4. Debug Panel Not Showing on Website
Issue: The Tag Assistant Debug Panel does not appear.
Fix:
- Ensure GTM is correctly installed and published.
- Disable browser extensions that may interfere.
- Try another browser or incognito mode.
By following these troubleshooting steps, you can resolve most GTM Preview Mode issues and ensure accurate tag tracking before publishing changes.
Best Practices for Using GTM Preview Mode
To make the most of GTM Preview Mode, follow these best practices:
- Test in an Incognito Window – This prevents conflicts with browser extensions or cached scripts.
- Use Clear Naming Conventions – Label your tags, triggers, and variables properly to simplify debugging.
- Check the Data Layer Regularly – Ensure variables are being passed correctly at each event.
- Verify Across Multiple Browsers – Some issues may be browser-specific.
- Use Console Logs for Debugging – Open the browser’s Developer Console (F12 or Cmd+Option+I) to track errors.
- Always Refresh Preview Mode – GTM doesn’t auto-refresh, so update it after every change.
- Publish Changes After Testing – Never push untested tags to production.
By following these practices, you can ensure accurate tracking, reduce errors, and optimize your GTM implementation.
Read more in detail about Google Tag Manager Best Practices (2025)
GTM Preview Mode for WordPress Users (With Analytify)
Join 50,000+ beginners & professionals who use Analytify to simplify their Google Analytics!
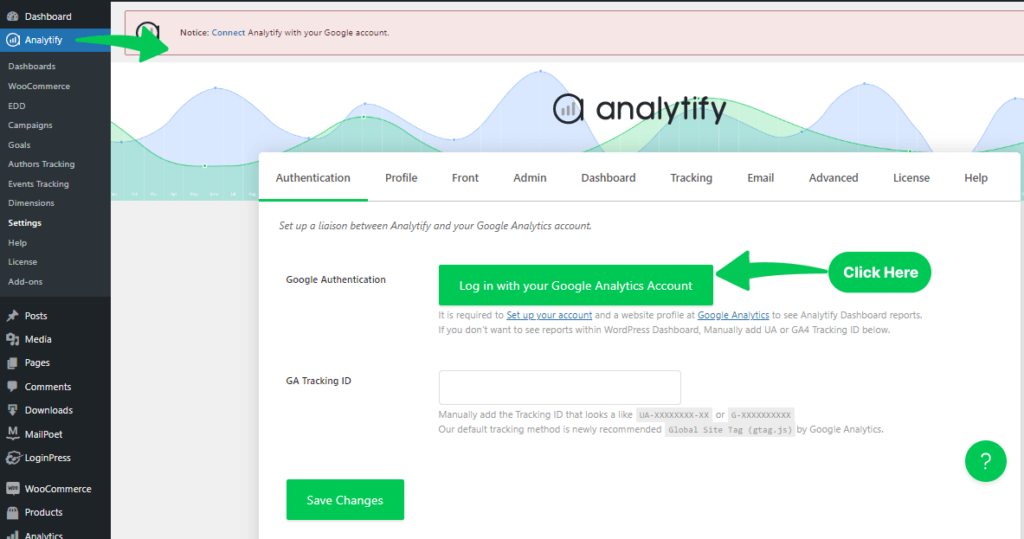
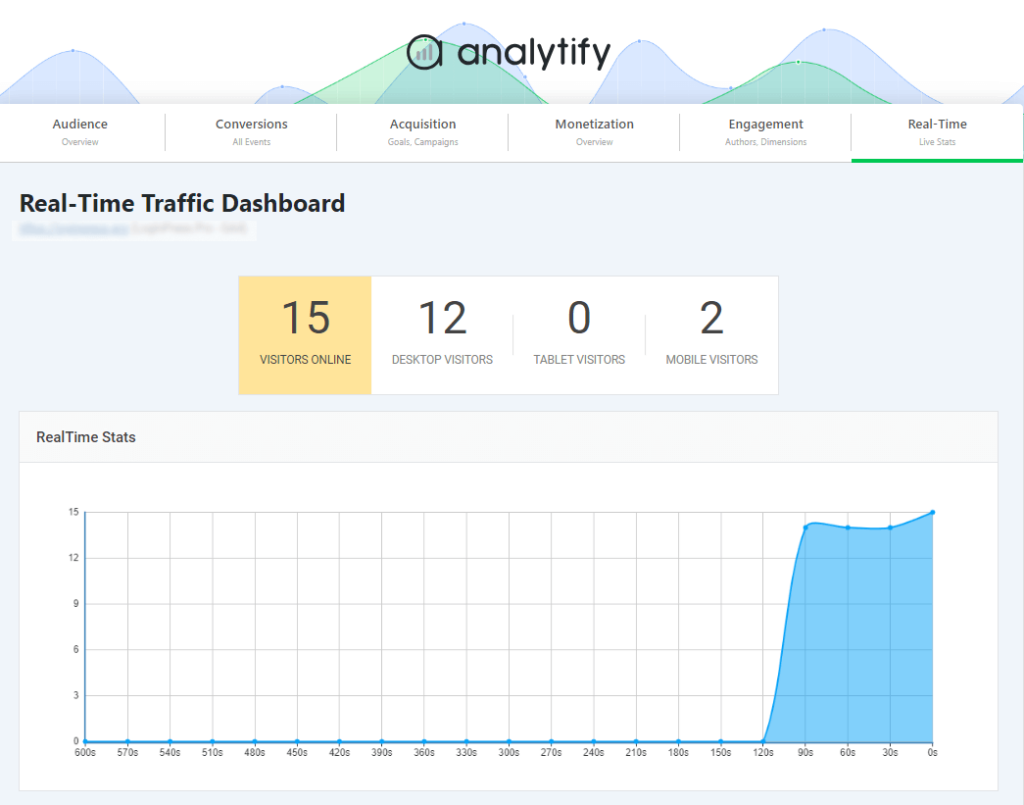
If you’re a WordPress user, tracking your website’s performance becomes even easier with Analytify. While Google Tag Manager helps manage and deploy tracking tags, Analytify simplifies GA4 integration and provides real-time analytics directly within your WordPress dashboard.
Why Use Analytify with GTM?
- Seamless GA4 Integration – Easily connect and manage GA4 without manually configuring tags.
- Real-Time Tracking Insights – Monitor GA4 events and conversions inside WordPress, helping you validate GTM setups.
- Error-Free GA4 Data Collection – Avoid misconfigured tracking by automating GA4 implementation with Analytify.
Using Analytify alongside GTM for tag debugging, WordPress users can ensure seamless tracking, accurate data collection, and effortless analytics management.
Google Tag Manager Debugging (FAQs)
1. What is Google Tag Manager Preview Mode?
GTM Preview Mode is a built-in debugging tool that allows users to test and verify their tags before publishing them. Google Tag Manager debug mode provides a real-time view of how tags behave on a website, showing which tags fire, the triggers that activate them, variable values, and data layer updates.
2. How do I enable Debug mode in Google Tag Manager?
To enable Google Tag Manager Debugger:
Log into your GTM account.
Select the desired container.
Click the “Preview” button in the top-right corner of the GTM dashboard.
Enter your website URL in the prompt and click “Start.”
Your website will open with the Tag Assistant Debug Mode enabled.
3. Why is Preview Mode in Google Tag Manager not connecting to my website?
If GTM debugger isn’t connecting:
Ensure your website has the correct GTM container installed.
Disable browser extensions that might block scripts, such as ad blockers.
Clear your browser cache and cookies.
Try using an incognito window to rule out cookie-related issues.
4. How do I exit GTM Debug Mode?
To exit the preview Mode:
Close the Tag Assistant Debug Panel tab.
In the GTM interface, click on the “Leave Preview Mode” or “Exit” button.
Clear your browser cookies if the Preview Mode persists.
5. Why are my tags firing in Preview Mode but not after publishing?
If tags work in Preview Mode but not live:
Ensure you’ve published the latest container version after testing.
Verify that the triggers and conditions are correctly set.
Check for any conflicts or errors in the live environment that might prevent tags from firing.
GTM Preview and Debug Mode: Final Thoughts
Google Tag Manager Preview Mode is an essential feature for debugging and testing your tracking setup. By using it correctly, you can:
- Ensure accurate tag firing
- Identify and fix errors before publishing
- Improve the reliability of your analytics setup
Following the steps to enable Debug Mode and the best practices outlined in this guide, you can confidently use Google Tag Manager Preview Mode to optimize your tracking implementation.
Further Readings:
- How To Check If Google Tag Manager Is Working? (6 Ways)
- Understanding GA4 DebugView (Google Analytics 4)
- Google Ads Conversion Tracking With GTM (Explained 2025)
We hope this guide helped you understand preview and debug mode in Google Tag Manager. If you have any queries, please contact us in the comment box below.

