Google Tag Manager Not Working? 6 Ways to Check and Fix It

The fastest way to check if Google Tag Manager is working is to inspect your source code for the gtm.js script. You can also run GTM’s built-in Preview Mode. Both take under two minutes and tell you definitively whether your tags are live.
If GTM isn’t set up correctly, your Google Analytics data will be incomplete or wrong. Every decision built on that data then rests on bad information.
Below are 6 reliable ways to check, ranked from fastest to most thorough. You also get the most common reasons GTM stops firing and how to fix each one.
Is the Tag Manager Working (TOC):
Why Checking Google Tag Manager Status is Important
A broken GTM setup silently corrupts your analytics. Tags stop firing, but your dashboard keeps showing numbers. Nothing looks wrong until you compare against a source you can trust.
- Accurate Data Collection
GTM ensures all tracking codes on your website work properly. If you don’t check Google Tag Manager status, you risk collecting incomplete or inaccurate data. That leads to poor decisions. - Efficient Tag Management
Managing tags directly in GTM is easier than modifying website code. However, errors in your GTM setup can disrupt analytics and marketing tools. - Enhanced User Experience
A properly functioning GTM setup makes sure your tracking scripts don’t slow down your website. It also keeps them from conflicting with site performance. - Integration with Analytics Tools
GTM acts as the backbone for tools like Google Analytics, Facebook Pixel, and others. A small issue in GTM can cascade into larger problems across your analytics stack.
Check GTM’s status periodically. Your website’s data stays accurate, and you make better decisions for growth.
6 Ways to Check if Google Tag Manager is Working
You can check that Google Tag Manager works in five ways. Inspect the source code, use Preview mode, or test with Screaming Frog. Use a browser extension, Chrome Developer Tools, or GA4 DebugView. Here are the 6 ways to check if Tag Manager is working or not:
Method 1: Inspect the Source Code
One of the simplest ways to check if Google Tag Manager is working is to inspect your website’s source code. Here’s how:
- Open Your Website: Go to the homepage or any page where GTM is supposed to be implemented.
- View the Source Code:
- On Windows: Right-click anywhere on the page and select “View Page Source,” or press Ctrl + U.
- On Mac: Press Cmd + Option + U.
- Search for the GTM Script: Use Ctrl + F (Windows) or Cmd + F (Mac). This opens the search bar.
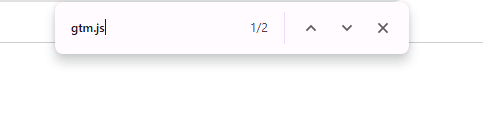
Then, type gtm.js.
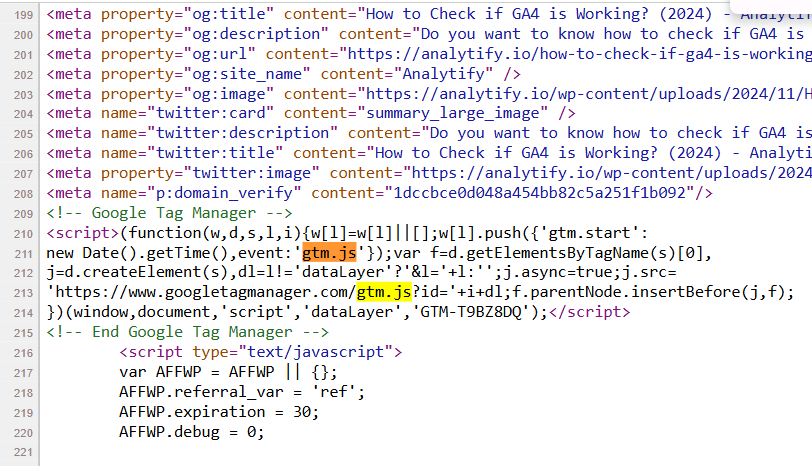
- Verify the GTM Code:
- Look for a <script> tag that contains the URL: https://www.googletagmanager.com/gtm.js.
- Check for the <noscript> tag as well. This optional code is usually placed immediately after the <body> tag for improved tracking.
Key Tip:
Ensure there are no modifications to the GTM script, such as altered quotation marks or missing characters. Errors can occur if the code is copied or shared through tools like Word files. They sometimes break the formatting.
When This Method Is Useful
Inspecting the source code quickly confirms whether GTM is on your site. It doesn’t guarantee that GTM is functioning correctly. For deeper testing, combine this with other methods.
Method 2: Use Preview and Debug Mode
Google Tag Manager’s Preview and Debug Mode is one of the most reliable ways to check GTM. It shows whether GTM works correctly. It allows you to test tags, triggers, and variables in real-time without affecting regular website visitors. Here’s how to use it:
- Enable Preview Mode:
- Log in to your Google Tag Manager account.
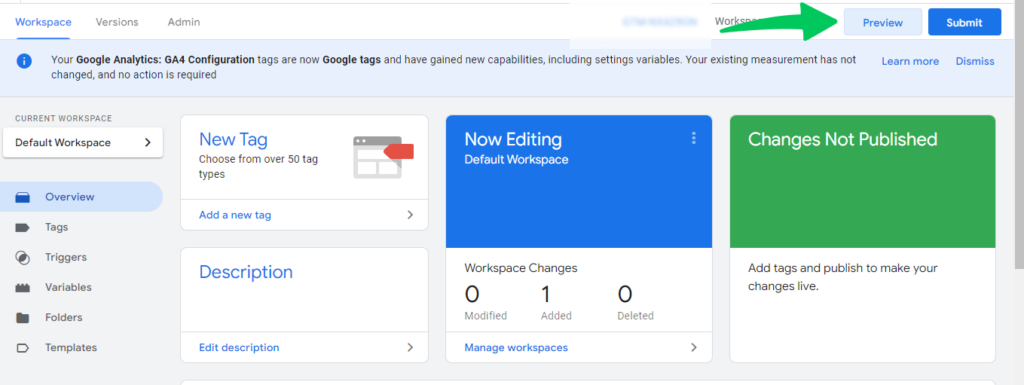
- In the top-right corner of the dashboard, click the Preview button (next to the Submit button).
- Enter Your Website URL:
- A popup will appear, asking you to enter your website URL. Enter the address and click Connect.
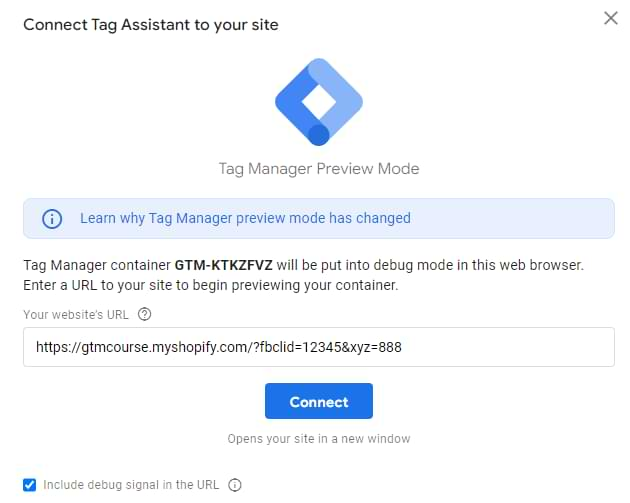
- This will open your website in a new tab with the Preview Console connected.
- Check the Debug Console:
- At the bottom of the new tab, you should see the Debug Console showing all the tags firing on the page.
- Navigate through your website, triggering events like page views or button clicks, and watch for tags firing as expected.
- Verify Events and Tags:
- Look at the events listed in the Debug Console (e.g., Pageview, Click, Form Submit) and ensure the associated tags are firing correctly.
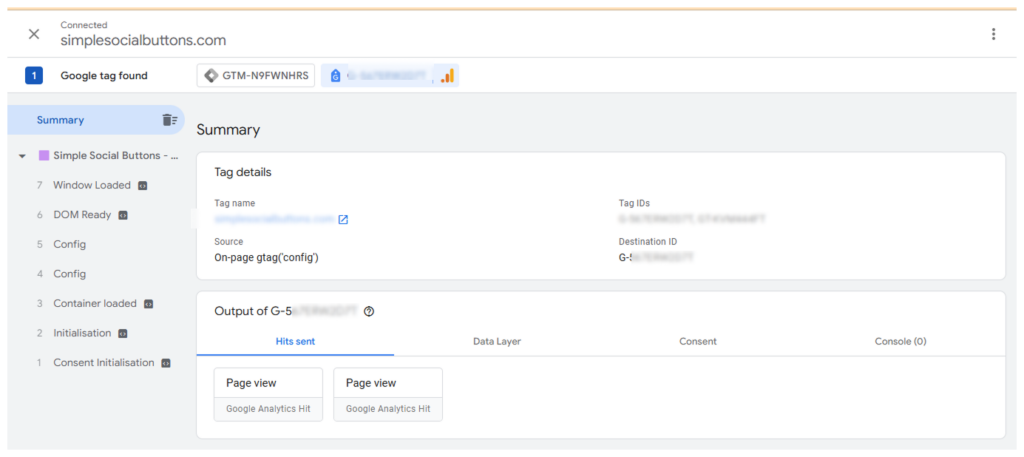
- Review Tag Details:
- Click on a specific tag in the Debug Console to see more details about its execution, including trigger conditions and variables.
Troubleshooting Tips:
- If the Preview and Debug Console don’t appear, double-check the GTM ID in your container settings.
Why This Method Is Essential
Preview Mode provides real-time feedback on whether your GTM setup is working as intended. It’s especially useful for testing specific events or troubleshooting issues before publishing changes.
Method 3: Test with Screaming Frog
A web crawler like Screaming Frog is an effective way to check the Google Tag Manager (GTM) script. It shows whether the script is correctly implemented across all pages of your website. Here’s how to do it:
- Download and Install Screaming Frog:
- If you don’t already have it, download Screaming Frog from their official website.
- Install and open the application.
- Set Up a Custom Search:
- Go to Configuration >> Custom >> Search in Screaming Frog’s menu.
- Add a search condition for the GTM script by entering https://www.googletagmanager.com/gtm.js in the search field.
- Ensure the condition is set to “Does Not Contain” to identify pages missing the GTM script.
- Start Crawling Your Website:
- Enter your website URL in the search bar and click Start.
- Screaming Frog will begin crawling your site and checking for the presence of the GTM script on each page.
- Review the Results:
- Once the crawl is complete, navigate to the Custom Search tab.
- Check the list of pages where the GTM script is missing.
- Take Action:
- If some pages don’t have the GTM script, add it manually or contact your developer to fix the issue.
Why Use Screaming Frog?
This tool is particularly useful for websites with numerous pages or complex templates. It ensures that the GTM script is implemented consistently across your entire site.
Method 4: Use Google Tag Manager Checker Browser Extensions
Browser extensions like Google Tag Assistant are a quick, user-friendly way to verify Google Tag Manager (GTM) on your website. These extensions are specifically designed for testing tags and debugging common issues.
Here’s how to use them:
- Install a Tag Manager Checker Extension:
- Go to your browser’s extension store (e.g., Chrome Web Store).
- Search for Google Tag Assistant or other GTM-related extensions like TagDebugger or GA Debugger.
- Install and activate the extension.
- Visit Your Website:
- Open your website in a new browser tab.
- Activate the extension by clicking its icon in your browser toolbar.
- Analyze the Results:
- The extension will scan your site and display all active tags, including GTM.
- Look for the GTM container ID (e.g., GTM-XXXXXX) and check if it’s firing as expected.
- Check for Errors:
- Some extensions highlight errors or misconfigurations in your GTM setup, such as duplicate tags or improperly placed scripts.
- Test Tags in Real-Time:
- Trigger specific events or navigate through your website to see how tags respond. The extension will display real-time updates.
Why Use Browser Extensions?
- Ease of Use: These tools provide a quick overview of your GTM implementation. You don’t need to inspect code or use complex tools.
- Error Detection: They identify common issues like missing scripts, duplicate tags, or misfires.
Bonus Tip:
Pair browser extensions with GTM’s Preview Mode for deeper insights into how your tags are firing.
Method 5: Use Chrome’s Developer Tools
Chrome’s Developer Tools provide a deeper way to test Google Tag Manager (GTM). They show whether GTM functions correctly on your website. By using the Console and Network tabs, you can monitor tag activity and identify issues. Here’s how:
- Access Developer Tools:
- On Windows: Press Ctrl + Shift + I or right-click anywhere on the webpage and select Inspect.
- On Mac: Press Cmd + Option + I.
- Open the Network Tab:
- Once the Developer Tools panel is open, click on the Network tab at the top.
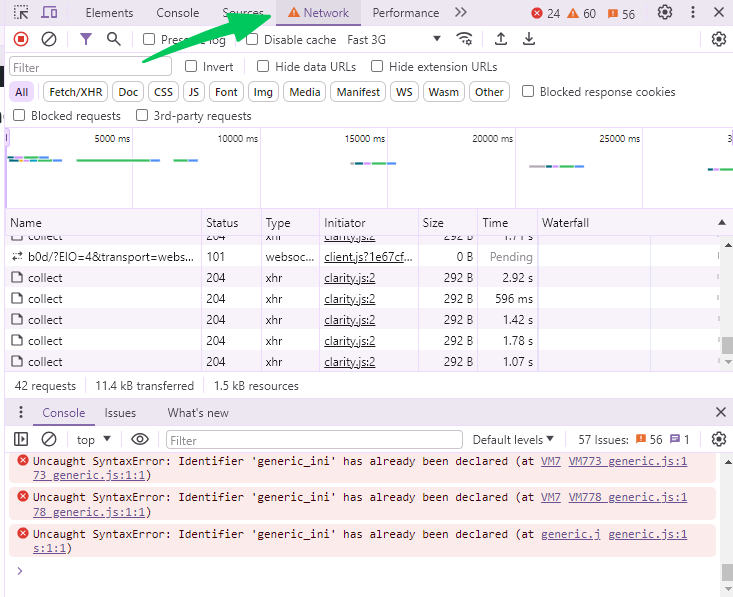
- In the search bar, type gtm.js to filter for requests related to Google Tag Manager.
- Refresh the Page:
- Reload your website while keeping the Developer Tools open.
- Look for a request at https://www.googletagmanager.com/gtm.js.
- Check the Status Code:
- If the status is 200, it means the GTM script was successfully loaded.
- If you see errors (e.g., 404), there might be issues with your implementation.
- Inspect the Console Tab:
- Switch to the Console tab in Developer Tools.
- Look for warnings or errors related to GTM.
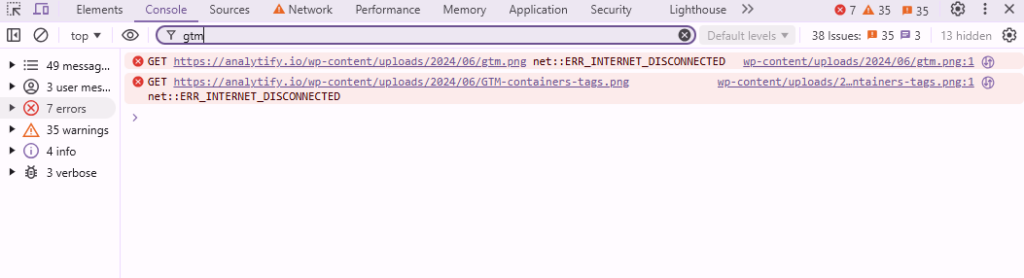
- Any errors mentioning gtm.js or Google Tag Manager could indicate a misconfiguration.
- Trigger Events and Observe:
- Perform actions on your website, like clicking buttons or navigating between pages.
- Watch the Network tab to ensure events related to GTM are firing correctly.
Why Use Developer Tools?
- Detailed Insights: Developer Tools provide a comprehensive look at how GTM interacts with your website.
- Real-Time Monitoring: You can track events as they occur and troubleshoot issues on the spot.
Bonus Tip: Use Developer Tools alongside GTM’s Preview Mode for a more thorough analysis of your tags and events.
Method 6: Check Google Analytics DebugView
You may have integrated Google Tag Manager (GTM) with Google Analytics 4 (GA4). The DebugView feature in GA4 helps verify that data from GTM is sent correctly. This method is especially useful for tracking specific events like page views, clicks, or custom conversions.
Here’s how to use DebugView:
- Enable Preview Mode in GTM:
- Log in to your GTM account and click on the Preview button in the top-right corner.
- Enter your website’s URL to connect it with the GTM Debug Console.
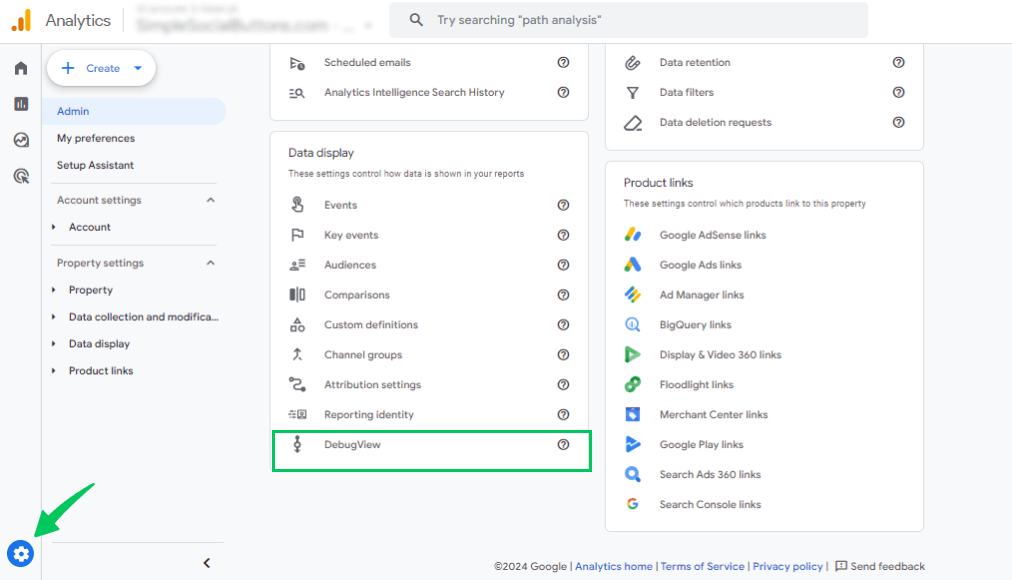
- Access DebugView in GA4:
- Log in to your GA4 account.
- Navigate to Admin >> DebugView under the Property settings.
- Trigger Events on Your Website:
- While in Preview Mode, perform actions on your website that you want to track (e.g., navigate pages, click buttons, or submit forms).
- These actions will trigger events that should appear in DebugView.
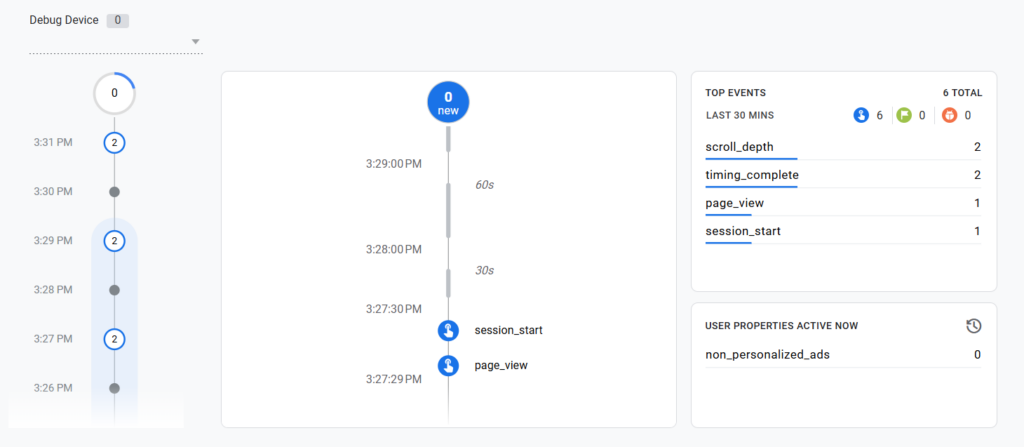
- Monitor Events in DebugView:
- In GA4 DebugView, you’ll see a timeline of events (displayed as dots) on the right side of the screen.
- Click on each event to see detailed information about the parameters and user properties.
- Verify Correct Tracking:
- Ensure that events like page_view, click, or custom events are firing as expected.
- If certain events are missing, revisit your GTM setup to check for misconfigurations.
Why Use DebugView?
- Real-Time Data: DebugView shows live event data, making it easy to spot issues immediately.
- Detailed Insights: You can see which parameters and properties are being sent to GA4, ensuring your tracking is accurate.
Troubleshooting Tips:
- If no data appears in DebugView, double-check the GTM container ID and GA4 property settings.
- Allow a few minutes for DebugView to process events, as there may be slight delays.
Bonus Tip:
Use Analytify to simplify the process of monitoring Google Analytics data directly from your WordPress dashboard.
Why is Google Tag Manager Not Working? Common Causes and Fixes
| Symptom | Likely Cause | Fix |
|---|---|---|
No gtm.js request in the Network tab | Container snippet is missing or was removed from the theme | Reinstall the GTM snippet in the <head>, or use Analytify to add it without editing code. |
gtm.js loads but tags don’t fire | Trigger conditions are misconfigured | Open Preview Mode, click the tag, and check its trigger conditions against the actual page event. |
| Tags fire in Preview but not live | Container was tested in Preview but not published | In GTM, click Submit, not just Preview, to push the container live. |
| Duplicate tags fire twice | GTM snippet was added twice, such as manually and through a plugin | Check the page source for two googletagmanager.com/gtm.js script tags and remove one. |
| Data is missing from GA4 only | GTM fires correctly, but the GA4 tag’s Measurement ID is incorrect | Confirm the Measurement ID in the GA4 tag exactly matches your GA4 property. |
| Works on desktop but not mobile | A mobile-specific trigger or Consent Mode block is preventing the tag | Check Consent Mode settings and mobile-specific triggers using Preview Mode during an actual mobile session. |
Analytify: Simplify Google Tag Manager Testing and Analytics
Managing and testing Google Tag Manager (GTM) can be a time-consuming process, especially for WordPress users. That’s where Analytify comes in. With Analytify, you can monitor your GTM implementation and Google Analytics data without exploring complex code or technical tools.
Join 50,000+ beginners & professionals who use Analytify to simplify their Google Analytics!
Why Use Analytify for Website Analytics?
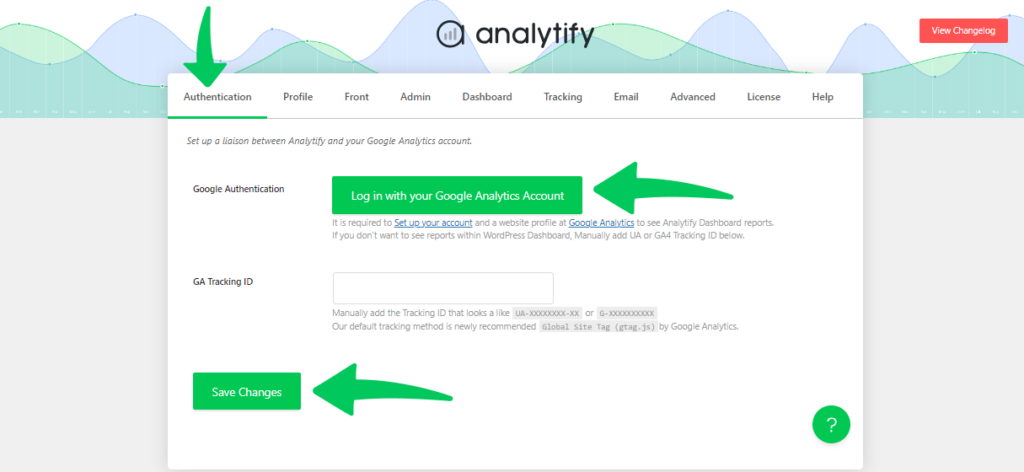
- Effortless GA4 Integration
- Analytify makes it easy to connect your Google Analytics account with your WordPress site. You can manage tags and track performance directly from your dashboard. There is no need to access GTM or add scripts manually.
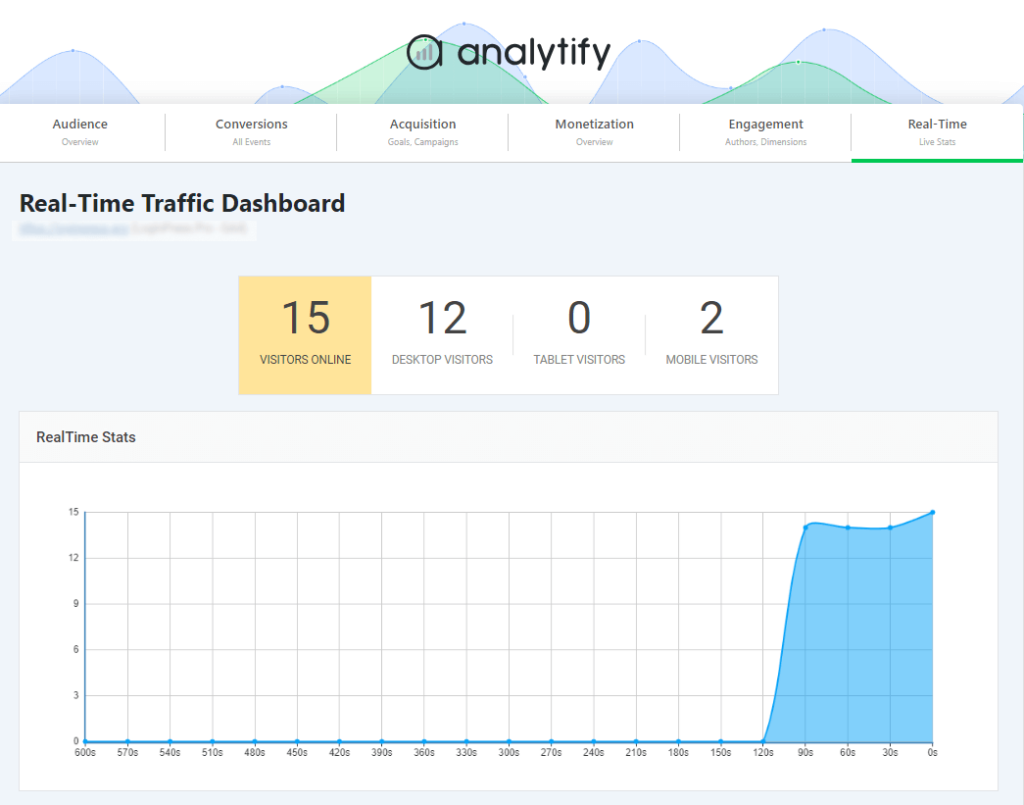
- Real-Time Insights
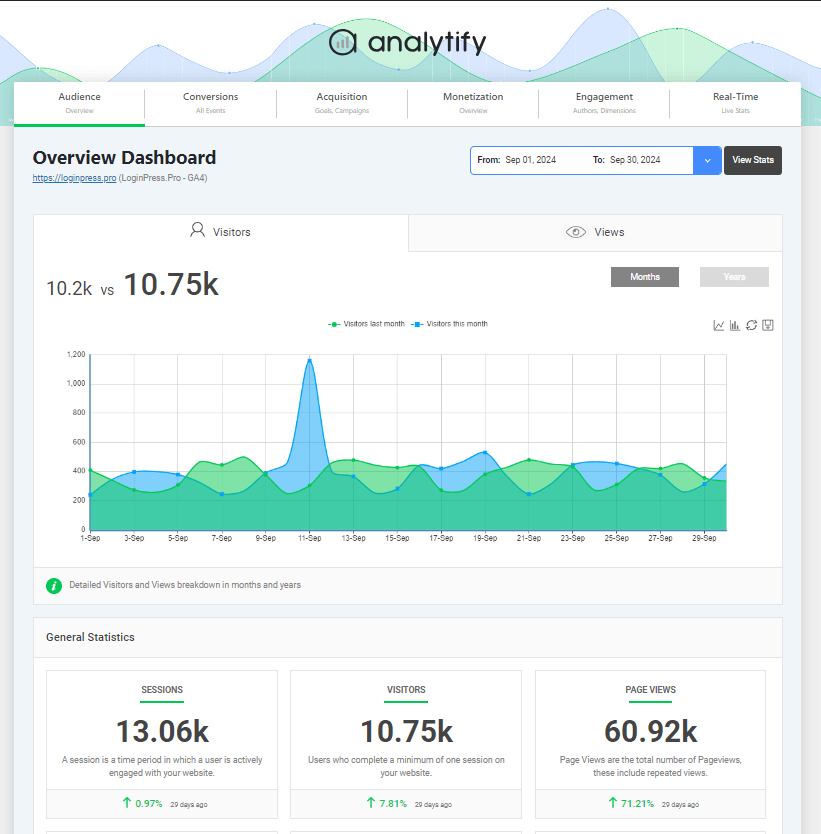
- View real-time analytics from Google Analytics, including events, page views, and conversions. This helps you confirm that GA4 is working and sending accurate data.
- User-Friendly Dashboard
- Analytify’s intuitive interface makes it easy for beginners and professionals alike to track their GTM and Google Analytics performance without technical expertise.
Read a complete guide on How to Install Analytify Pro.
How to Check if Google Tag Manager is Working (FAQs):
1. How do I check if Google Tag Manager is working?
To check if Google Tag Manager is working, you can:
Inspect your website’s source code for the GTM script (gtm.js).
Use GTM’s Preview and Debug Mode to test tags in real-time.
Check for the GTM script using tools like Chrome Developer Tools, Google Tag Assistant, or Screaming Frog.
2. What is the Google Tag Manager URL for testing?
The URL https://www.googletagmanager.com/gtm.js is used to load the GTM script on your website. Testing tools often search for this URL in your source code or network requests to verify GTM’s implementation.
3. Why is my Google Tag Manager not working?
Common reasons include:
Incorrect or missing GTM container ID.
Duplicate or misplaced GTM scripts.
Browser extensions or conflicting scripts interfering with GTM.
Use GTM’s Preview Mode or browser Developer Tools to troubleshoot and fix these issues.
4. Can I use Analytify to check if GTM is working?
Yes, Analytify simplifies GTM testing for WordPress users by integrating your Google Analytics and GTM setup into an easy-to-use dashboard. You can monitor events, page views, and real-time data directly within WordPress.
5. How do I ensure GTM is implemented across all pages?
You can use tools like Screaming Frog or Google Tag Assistant to crawl your website and verify that the GTM script is present on all pages.
6. How do I test GTM events?
Enable GTM’s Preview Mode to see a real-time log of events triggered by actions on your website. Additionally, use GA4’s DebugView to verify that events are being sent to Google Analytics.
7. Does Google Tag Manager slow down my website?
GTM itself loads asynchronously, so it doesn’t block your page from rendering. Slowdowns usually come from too many tags firing at once, not from GTM itself, so audit your container periodically and remove tags you no longer use.
Final Thoughts: Google Tag Manager Working
Checking GTM takes minutes: inspect the source code, run Preview Mode, or use Screaming Frog for a full-site sweep. When something breaks, the table above covers the six most common causes.
Some WordPress sites already run Analytify. On those sites, you can skip most of this manual checking. Analytify shows your GA4 data live inside your WordPress dashboard. A broken GTM setup shows up immediately as missing data. You don’t find it six months later.
You may also like to read:
- How To Fix Google Analytics Not Working
- Using GTM With Analytify: An In-Depth Guide
- Google Tag Manager Best Practices
- Google Analytics Audit Checklist
If you have further queries, feel free to ask in the comments below.