
Google Analytics 4 and Looker Studio: Unified Analytics for 2026
Every click, every visit, and every purchase on your website tells a story. But if you’ve ever tried to read that story in Google Analytics 4 (GA4), you know GA4 is incredibly powerful, but it lacks customizable dashboards. That’s why Google Analytics 4 and Looker Studio integration are helpful. They work together to show what’s happening on your website or app. And, you can customize the dashboard as per your needs.
The GA4 and Looker Studio integration lets you use GA4 data in Looker Studio to build visualization reports that show how users behave, what works, and what needs improvement.
In this guide, I’ll show you how to integrate GA4 with Looker Studio, create Google Analytics 4 Looker Studio dashboards, utilize metrics from GA4, and even create your own GA4 Looker Studio reports to gain a deeper understanding of your data.
Google Analytics 4 and Looker Studio (TOC):
What is Google Analytics 4?
Google Analytics 4, or GA4, is the latest version of Google’s analytics tool. It helps you see what people do on your website or app. Unlike older versions, GA4 focuses on event-based tracking, which means it records every action a user takes, like clicks, video plays, or purchases.

With GA4, you get AI-powered insights that can tell you trends and patterns automatically. You can also track users across websites and apps, giving a full view of how people interact with your business. This makes GA4 perfect for understanding your audience and improving your website or app.
However, when you use GA4 data in Looker Studio, you can turn all this information into easy-to-read charts and GA4 reports on Looker Studio.
In the following sections, I’ll show you exactly how to do that, step by step.
What is Looker Studio?
Looker Studio (formerly Google Data Studio) is a platform that helps you turn your data into easy-to-read dashboards and reports. It works really well with GA4, so you can see all your website or app data in one place.

With Looker Studio, you can create custom GA4 reports with charts, tables, and graphs that show exactly what you want. You can also use GA4 Looker Studio templates to save time and make your dashboards look professional.
Some of the best features of Looker Studio are real-time reporting, the ability to share reports with your team, and custom dashboards that you can change anytime. By connecting GA4 to Looker Studio, you can make GA4 visualization with Looker Studio simple and powerful.
Integrating GA4 with Looker Studio
Getting data from Google Analytics 4 (GA4) into Looker Studio is a straightforward process. Looker Studio, formerly known as Google Data Studio, is a free platform that helps you create interactive dashboards and reports.
First, make sure you have the right permission.
To get started, you’ll need Read and Analyze permissions for the GA4 property you want to connect.
Step 1: Go to Looker Studio
- Open your web browser and go to the Looker Studio website.
- Sign in with your Google account. This should be the same account that has access to your Google Analytics 4 data.
Step 2: Start a New Data Source
- Once you’re on the Looker Studio home page, look in the top-left corner and click the Create button.
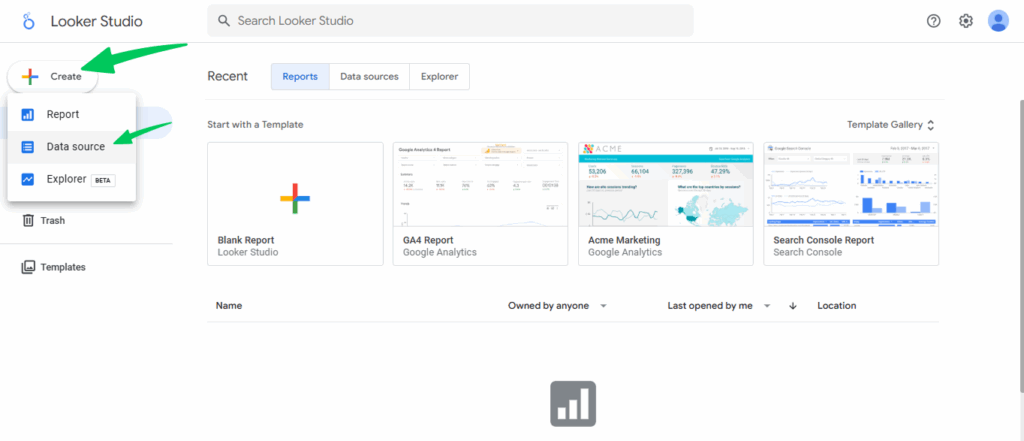
- From the menu that appears, select Data Source. This tells Looker Studio that you want to connect to a new source of information.
Step 3: Choose the Google Analytics Connector
- A list of “Google connectors” will appear. These are the tools that help Looker Studio talk to different programs.

- Find and click on the Google Analytics connector. It will have a Google Analytics logo.
Step 4: Give Permission
- Looker Studio will ask for your permission to access your Google account. This is a one-time step.

- Click AUTHORIZE to allow it to see your Analytics data.
Step 5: Select your Account and Property
- A new window will show your Google Analytics accounts.
- Choose the correct Account, then select the specific GA4 Property you want to use for your report.

In the top-right corner, click the CONNECT button.
After a moment, you will see a list of data field dimensions. This means the connection was successful! Your data source is now linked to your Google Analytics 4 data.
This will bring up the data source fields panel, confirming your connection.

Step 6: Create a Report
- In the top-right corner, click CREATE REPORT. This will open the report editor.
Click ADD TO REPORT to link the data source you just created to this new report.

You’re now ready to add charts, tables, and other visuals to your report. Simply drag and drop the fields you want to use onto the canvas.

Creating GA4 Looker Studio reports is very easy.
In the top-left corner of the page, you’ll see a default name like “Untitled Data Source”. You can click on this to give it a more useful name, like “My Website GA4 Data.”
You can also modify the data itself, such as renaming fields or changing how numbers are counted. For a beginner, you don’t need to do much here.
Important Things to Know
- Available Data: You can use any data field available in the Google Analytics Data API (GA4), including any custom dimensions or metrics you’ve set up in GA4.
- Data Limits: Looker Studio reports are subject to the same quotas as the Google Analytics Data API. If you have a very large amount of data or run very complex queries, you may hit these limits and see an error.
- Segments and Comparisons: Unlike in Google Analytics, you can’t use segments or comparisons directly within the Looker Studio connector. You’ll need to use filters or calculated fields to achieve similar results.
Creating Powerful Dashboards with GA4 Data in Looker Studio
Once you’ve connected GA4 and Looker Studio, it’s time to make dashboards that actually tell a story. Dashboards let you see GA4 data in Looker Studio in one place, so you don’t have to dig through numbers.
A dashboard is more than a set of charts; it tells a clear report and turns raw numbers into useful ideas.
There is no limit to the number of dashboards you can create. The only constraint is the performance of your data sources or the complexity of the dashboards. Google Looker Studio is designed to scale across reporting levels, from small teams to large enterprises.
- Individual Users: You could create one or several dashboards for different types of reports.
- Organizations: In larger teams, you might have many dashboards, one for each department, project, or specific KPIs you want to monitor.
Common types of dashboards in Google Looker Studio include marketing dashboards for tracking ad campaigns and SEO performance, sales dashboards to monitor leads and revenue, e-commerce dashboards for tracking transactions and product performance, financial dashboards for analyzing profit, loss, and cash flow, project management dashboards to track timelines and resources, customer support dashboards to measure ticket resolution and satisfaction, HR dashboards for tracking employee engagement and retention, website analytics dashboards for monitoring traffic and user behavior, and executive dashboards for high-level insights into key business metrics. You can design each to help your teams focus on specific data for better decision-making.
You can check our detailed article on Looker Studio dashboards, in which we have explained step by step how to build a strong Looker Studio dashboard: choose the right charts, design a clean report that fits your brand, and help your team make smarter, data-based decisions.
Troubleshooting Common Issues
You may encounter technical and general errors in the Google Looker Studio dashboard. Let’s see some of the most common ones.
1. “Quota Exceeded” Errors
You’ve built a beautiful dashboard, but you may see an error that says “Quota Exceeded.” This means you’ve hit a limit on the number of requests you can make to the Google Analytics Data API.
What are API quotas? Google’s Data API has limits to ensure fair usage and prevent system overload. These limits, or quotas, are based on tokens consumed per hour, per day, and per project.
Why does it happen? Looker Studio requests data from GA4 every time someone views a report, refreshes a chart, or changes a date range. Reports with many charts, a long date range, or high traffic from multiple users can quickly use up these tokens.
How to fix it:
- Simplify Your Reports: Use fewer charts and visualizations per page.
- Combine Queries: If possible, merge multiple charts into a single query to reduce API calls.
- Use a Shorter Date Range: Longer date ranges consume more quota tokens.
- Upgrade to GA4 360: The paid version offers significantly higher quota limits, making it the best solution for large organizations.
2. Data Discrepancies
You might notice that the numbers in your Looker Studio report don’t perfectly match the numbers you see directly in the GA4 interface. This is a common and often confusing issue.
Why does it happen?
Data Latency: GA4 data processing can take 24-48 hours. Looker Studio pulls from the API, which may not be in perfect sync with the UI’s most recent data.
Data Thresholding: For privacy reasons, GA4 may hide or “threshold” data in the UI when user counts are low to prevent individual identification. This often doesn’t apply to the API, leading to different numbers.
Sampling: For large properties, GA4 may sample data to process reports faster. Looker Studio may apply its own sampling rules, causing a mismatch.
Different Aggregation: The GA4 UI and the API may aggregate data differently for certain metrics, such as users and sessions, which are often estimations.
How to fix it:
- Wait: Give your data 24-48 hours to fully process before comparing.
- Use Consistent Dates: Ensure you are comparing the exact same date range in both GA4 and Looker Studio.
- Understand Your Metrics: Be aware that some metrics are estimations. Focus on trends and changes over time rather than pixel-perfect matches.
3. Invalid Combination of Metrics and Dimensions
This is one of the most frustrating errors because a chart that worked perfectly fine might suddenly break. This error results from a fundamental incompatibility in the GA4 data model.
What are scopes? GA4 data is organized into four scopes: User, Session, Event, and Item. A “dimension” and a “metric” from different scopes often cannot be used together. For example, a Session-scoped dimension (like Session source) can’t be paired with an Event-scoped metric (like Items purchased) without an error or, worse, an inaccurate result.
Why does it happen? Looker Studio is more flexible than the GA4 interface, sometimes allowing you to create combinations that are fundamentally incompatible according to the GA4 data model.
How to fix it:
- Check Your Combinations: Ensure you are using metrics and dimensions from the same scope. If you’re using an Item-scoped dimension (Item name), use an Item-scoped metric (Item revenue) to avoid errors.
- Re-create in GA4 Explorations: Before you build a complex chart in Looker Studio, try to build the same report in GA4 Explorations. If it works there, it should work in Looker Studio. If it doesn’t, you know you have a fundamental compatibility issue to solve.
How Analytify Helps with GA4 Visualization in WordPress
Join 50,000+ beginners & professionals who use Analytify to simplify their Google Analytics!
Let’s see how Analytify can be a useful plugin along with GA4 and Looker Studio setups.
Analytify helps you avoid and troubleshoot common GA4 and Looker Studio errors by simplifying the entire analytics process. It does this by tackling the problems at their source: data collection and reporting.
- Avoids “Invalid Combination” Errors: Analytify handles the initial GA4 setup for you, ensuring that basic events and data are collected correctly from the beginning. This eliminates the need for manual configuration and reduces the likelihood of these complex errors.
- Minimizes Data Discrepancies: By providing a user-friendly dashboard that pulls data directly from the GA4 API, Analytify gives you a reliable, single source of truth for your most important metrics. This makes it easier to spot issues with your GA4 property itself.
- Helps Manage API Quotas: Analytify’s main dashboard lives within WordPress. Because you don’t have to constantly refresh complex Looker Studio reports to see your key metrics, you reduce the number of API calls you make. This helps you stay within your quota limits.
Analytify offers a middle ground between the raw power of GA4 and the accessibility of tools like Looker Studio without the extra configuration overhead.
Analytify makes it easier.
It connects your GA4 account to your WordPress site and displays your data in a clear, simple format right in your WordPress dashboard. No coding or setup stress.

No need to add tracking events manually; it handles that for you.

What Analytify Does
- Shows you traffic and visitor data without opening the GA4 website.
- Let’s you see stats for each post, page, or product from the WordPress admin.
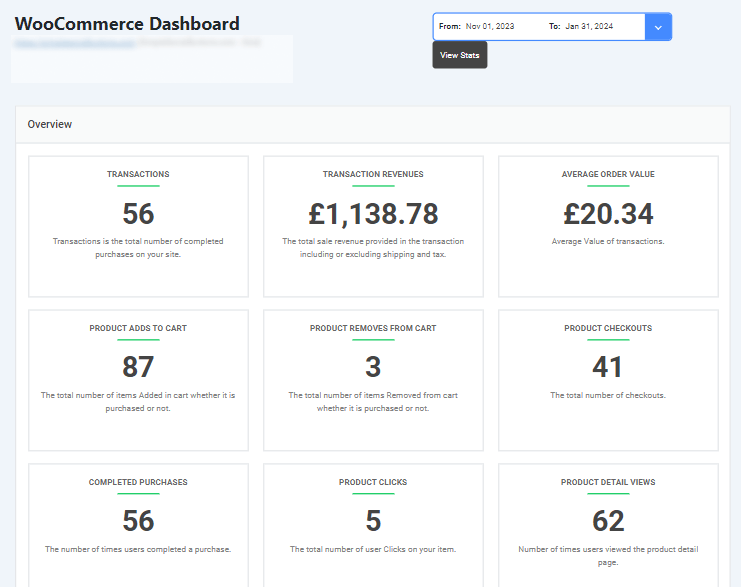
- Works with WooCommerce and Easy Digital Downloads to track sales.
- Gives you real-time reports so you can see what’s happening now.

- Sends clean reports by email (helpful if you manage sites for clients)
Why Use It
GA4 collects a lot of useful data, but most people don’t need all of it. They just want to know what’s working and what’s not. Moreover, Analytify helps you integrate GA4 with your website without any hassle.
FAQs About GA4 and Looker Studio
1. What is GA4 and Looker Studio integration?
GA4 and Looker Studio integration is the process of connecting Google Analytics 4 data with Looker Studio to create custom reports and dashboards. This integration allows businesses to visualize user behavior, conversions, and other important metrics in an easy-to-understand way.
2. How can I create GA4 reports on Looker Studio?
To create GA4 reports on Looker Studio, start by adding GA4 as a data source. Then, select the metrics and dimensions you want to display. Users can customize charts, tables, and filters to highlight the most relevant data.
3. Can I use GA4 Looker Studio templates?
Yes, Looker Studio offers pre-built GA4 Looker Studio templates. These templates help users quickly set up dashboards with common metrics like user engagement, conversion tracking, and traffic sources. Templates can also be customized to fit unique reporting needs.
4. How often does GA4 data in Looker Studio update?
GA4 data in Looker Studio usually updates every few minutes. However, some real-time metrics may have slight delays. For large datasets, it’s normal to experience some latency due to data sampling.
5. What are Looker Studio metrics from GA4 that I should track?
Important Looker Studio metrics from GA4 include user engagement, session duration, conversion rates, event tracking, and traffic sources. Tracking these metrics helps businesses make informed decisions based on real data.
6. How does Analytify help with GA4 setup?
Analytify simplifies GA4 setup by guiding users through the configuration process and offering an easy way to view analytics directly within WordPress. It ensures that key metrics are tracked correctly and provides a user-friendly interface for monitoring GA4 data without leaving the platform.
7. Can I use GA4 with Data Studio for multiple websites?
Yes, GA4 can be connected to Looker Studio for multiple properties or websites. Each GA4 property can serve as a separate data source, allowing the creation of consolidated dashboards for comparison and analysis.
GA4 and Looker Studio: Recap
Google Analytics 4 and Looker Studio together provide a powerful way to understand and visualize website data. By connecting GA4 with Looker Studio, you can create detailed dashboards, track user behavior, and make smarter decisions based on real-time insights.
GA4 and Looker Studio integration allows for creating customized GA4 reports on Looker Studio, using GA4 Looker Studio templates, and accessing advanced metrics like conversions, engagement, and event tracking. Even with challenges in setup, Analytify simplifies GA4 configuration and makes it easy to monitor analytics within WordPress.
Whether using pre-built dashboards or creating GA4 visualizations with Looker Studio from scratch, Analytify helps businesses save time and get a clearer picture of their performance.
You may also like to read:
So, when you need to understand your website’s performance, what’s your go-to: the in-depth data of GA4, the customizable reports of Looker Studio, or the convenience of a WordPress dashboard?