17 Content Marketing Metrics To Track (2025)
Are you struggling to make your content stand out? It’s time to approach your content marketing strategy. By tracking the right metrics, you can measure the effectiveness of your efforts, identify areas for improvement, and drive results.
In this article, we’ll explore 17 essential content marketing metrics you should monitor in 2025. These metrics will give you a valuable understanding of your audience, content performance, and overall marketing success.
Get ready to elevate your content strategy and drive impactful results!
Content Marketing Metrics (TOC):
What are Content Marketing Metrics?
Content marketing metrics refer to the specific data points used to evaluate the performance and effectiveness of a content marketing strategy. These metrics help marketers measure the success of content in engaging audiences, driving traffic, and contributing to overall business goals. Whether you’re promoting a product, a blog, or a research paper writer service, understanding content marketing metrics is essential. Content marketing metrics are also called content marketing KPIs or content performance metrics.
Tracking the right content marketing metrics ensures businesses can improve their content and optimize return on investment (ROI).
Why Track Content Marketing Metrics?
Tracking content marketing metrics is essential for understanding the effectiveness of your content strategy. Here are some key reasons why tracking content marketing success metrics is crucial:
- Evaluate Content Effectiveness: Tracking content marketing KPIs helps assess how well your content engages the audience, guiding you to optimize or improve underperforming content.
- Measure ROI: Monitoring content performance metrics like conversions and lead generation helps calculate return on investment, ensuring resources are spent effectively.
- Understand Audience Preferences: By analyzing content strategy metrics such as traffic sources and engagement, you can better modify your content to meet audience needs.
- Improve SEO Performance: Tracking SEO-related metrics like keyword rankings and organic traffic helps boost content visibility and drive more traffic from search engines.
- Align with Business Goals: Measuring content marketing success ensures your content strategy supports key business objectives, like increasing sales or customer retention.
- Identify Growth Opportunities: Consistently measuring content marketing metrics helps discover new trends, audience segments, or channels to optimize for better results.
- Optimize Content Strategy: Regular analysis of content marketing measurement enables adjustments to improve the effectiveness of your overall content strategy.
Key Content Marketing Goals:
Before exploring specific content marketing goals, it’s important to recognize that these objectives measure the effectiveness of your content strategy metrics. Your goals will vary based on your business type. Aligning content efforts with clear objectives helps track performance, refine strategies, and ensure meaningful results. Here are common content marketing objectives:
- Increasing Brand Visibility: Develop content that reflects your brand’s mission and values to boost your brand’s awareness and recognition among your target audience.
- Capturing Leads: Generate potential customers by creating content that features strong calls to action (CTAs) designed to collect contact information.
- Encouraging Engagement: Promote interaction with your audience by producing content that drives likes, shares, comments, and other engagement metrics.
- Educating Your Customers: Inform your audience about your products or services through educational content like tutorials, webinars, or guides, helping them make better decisions.
- Boosting SEO and Website Traffic: Craft search-engine-optimized content to improve your website’s ranking and increase traffic.
- Establishing Industry Expertise: Position your brand as an authority in your field by sharing expert-level, innovative content that showcases your knowledge and leadership.
- Enhancing Customer Retention and Loyalty: Provide relevant content, including product updates, success stories, and exclusive offers, to keep current customers engaged.
- Supporting Sales Initiatives: Assist your sales team with valuable content, such as case studies and product insights, to help close deals.
- Expanding into New Markets: Target new audience segments or geographic areas by tailoring content to appeal to these emerging markets.
Ultimately, the specific content performance metrics your business should monitor will depend on your unique objectives. Clearly defining your goals is important for those just starting with content marketing.
Let’s explore the key content metrics you should track.
Most Important Content Marketing Metrics To Track
There are the following 17 important content marketing metrics:
1. Organic Search Traffic
Organic search traffic refers to the visitors who land on your website through unpaid (organic) search engine results. These users find your site by entering keywords into search engines like Google or Bing and clicking on one of your website’s pages in the search results. Unlike paid search traffic, organic search traffic does not involve advertising costs.
The purpose of measuring organic search traffic is to assess how well your website attracts visitors through unpaid search engine results. Tracking this metric helps you evaluate the effectiveness of your SEO efforts, understand user intent, and identify which keywords or content are driving the most traffic.
It also provides insights into your website’s visibility in search engines, enabling you to optimize for long-term growth and better search rankings.
In Google Analytics 4 (GA4), you can access the organic search traffic metric by Reports >> Traffic Acquisition Report >> Session default channel group filter to select “Organic Search.”
Analytify measures and displays organic search traffic on its overview dashboard, giving users a clear snapshot of how their site performs in search engines. This feature helps track organic visitors.
Analytify’s Referrer Traffic Report provides detailed insights into where your organic traffic is coming from. Within this report, you can view organic traffic sources alongside other referral channels to see which search engines or sites contribute the most visitors. This visibility helps you understand and optimize sources driving organic growth.
2. Views
Views in Google Analytics 4 (GA4) refer to the number of times unique users have loaded a page or screen. This metric provides valuable knowledge about the popularity and engagement of your content. It also allows you to analyze which channels drive traffic to your site. You can optimize your content strategy by monitoring views to boost engagement and conversions.
To access the “Views” metric in GA4, navigate to the Reports section. Then, choose the specific report you want to analyze, such as “Engagement.” Then, select the page and screen the report. The “Views” metric will be displayed within the table or chart of the selected report.
The Overview Dashboard in Analytify provides a comprehensive snapshot of your site’s performance. It presents visitors’ Details. This section displays detailed visitors and views for months and years.
3. Traffic Sources
Traffic sources in Google Analytics 4 (GA4) refer to the channels users have used to access your website or app. Traffic sources include search engines, social media platforms, direct visits, or referral sites. This metric provides information about the effectiveness of your marketing efforts and helps you understand where your audience is coming from.
To access traffic sources in GA4, go to the Reports section and select the Acquisition report. You can choose User Acquisition or Traffic Acquisition to get a detailed view. Use the session Source/medium dimension within the report to view the channels driving traffic to your site, such as organic search or direct visits. This will help you analyze the effectiveness of each source.
Under the overview dashboard, Analytify shows where your traffic is coming from, such as search engines, social media, or direct visits, making it easier to identify your top traffic sources.
4. Keyword Ranking
Keyword ranking refers to the position of a specific keyword or search term in search engine results pages (SERPs). It indicates where your website ranks for a given keyword when users search for that term in search engines like Google. A higher ranking means your content appears closer to the top of the results, which often translates to more organic traffic.
Measuring keyword ranking helps assess your SEO strategy by tracking visibility, identifying optimization opportunities, and monitoring performance over time. It also allows you to align content with user intent, improving targeting and driving organic traffic.
In Google Analytics 4 (GA4), keyword ranking data is not directly available within the platform. However, you can integrate Google Search Console with GA4 to track search queries and keyword performance. By linking the two, you can view keyword-related data under the Search Console reports, showing which search terms users entered before landing on your website.
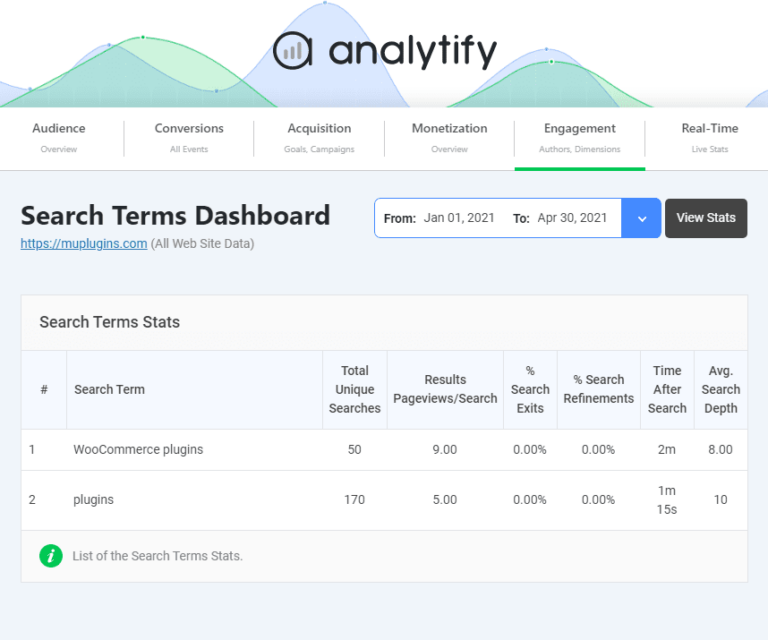
Analytify provides an easy way to access and analyze your website’s search performance with the search terms dashboard.
5. Impressions
In GA4, impressions refer to the number of times your website’s content appears in search engine results pages (SERPs), regardless of whether users click. It’s an essential metric for assessing your website’s visibility in search engines like Google.
This helps to evaluate the reach of your SEO efforts and can indicate whether further optimization is needed to improve click-through rates (CTR) and rankings.
To access impressions in GA4, you must link your Google Search Console account. Once connected, impressions data can be found under the Search Console reports.
Impressions are available through the Form tracking add-on in the Analytify plugin. After linking your account, you can view impressions in the plugin’s Form tracking dashboard.
6. Click Through Rate
Click-through rate (CTR) measures the percentage of users who click on a link or ad compared to the total number of impressions. It indicates how effectively your content or ads engage users.
To access the click-through rate in GA4, you must link your Google Search Console account. Once connected, CTR data can be found in the Search Console reports.
7. Engagement Rates
In GA4, the Engagement rate refers to the percentage of engaged sessions on your website or app. An engaged session is defined as one that lasts 10 seconds or longer, has at least one conversion event, or involves two or more page views. The engagement rate is calculated by dividing the number of engaged sessions by the total number of sessions.
In content marketing, This metric helps evaluate the quality of user interactions, showing how effective your site or content is at holding user attention. A high engagement rate shows your content is relevant and engaging, while a low rate suggests the need for optimization to better connect with your audience.
To access the engagement rate in GA4, go to the Reports >> Engagement >> Pages and Screens report. This report allows you to measure how users interact with your content.
Navigating to the Analytics Dashboard in the Analytify plugin will reveal metrics on engaged sessions, helping you assess how well your content performs in terms of user interaction directly within WordPress.
8. Average Engagement Time
Average Engagement Time in GA4 refers to the average time users actively engage with your website or app during a session. It measures the duration of user interactions with your content, such as scrolling, clicking, or navigating between pages, rather than just the time spent on the site.
Tracking average engagement time is essential for content marketing measurement. It allows you to determine whether your strategy resonates with users and delivers on your goals. By analyzing this data, you can refine your content strategy metrics and better understand how to measure content marketing success over time.
To access the Average engagement time in GA4, go to the Reports >> Engagement >> Pages and Screens report.
The Analytify plugin simplifies measuring average engagement time by presenting metrics directly within WordPress. This makes it user-friendly and allows quick content performance checks.
9. Bounce Rate
Bounce Rate in GA4 measures the percentage of sessions where users leave your site after viewing only one page. It indicates how many visitors don’t interact further with your content.
In content marketing metrics, bounce rate is a key content performance metric. It helps evaluate how engaging your content is and whether visitors are compelled to explore more pages, influencing content marketing measurement and content strategy metrics.
To measure the bounce rate in GA4, go to the Reports section, select Engagement, and then choose Pages and Screens Report. The bounce rate will be displayed alongside other engagement metrics for each page.
The Analytify plugin displays the bounce rate in a simplified format within your WordPress dashboard. Analytify offers a more user-friendly and accessible view of this metric without extensive navigation.
10. Conversion Rate/ Key Event
In GA4, Conversion Rate refers to the percentage of sessions that result in a defined conversion event, such as a purchase, sign-up, or download. GA4 has shifted terminology, where key events now replace what was previously referred to as conversions.
It is calculated by dividing the number of conversions by the total number of sessions and multiplying by 100. This metric helps you understand how effectively your site or app turns visitors into customers or leads.
By analyzing conversion rates, you can assess the impact of your content strategy, refine your approach, and enhance overall content performance metrics to improve content marketing measurement and success.
In GA4, navigate to Reports, select Engagement, and then choose Conversions to find the conversion rate.
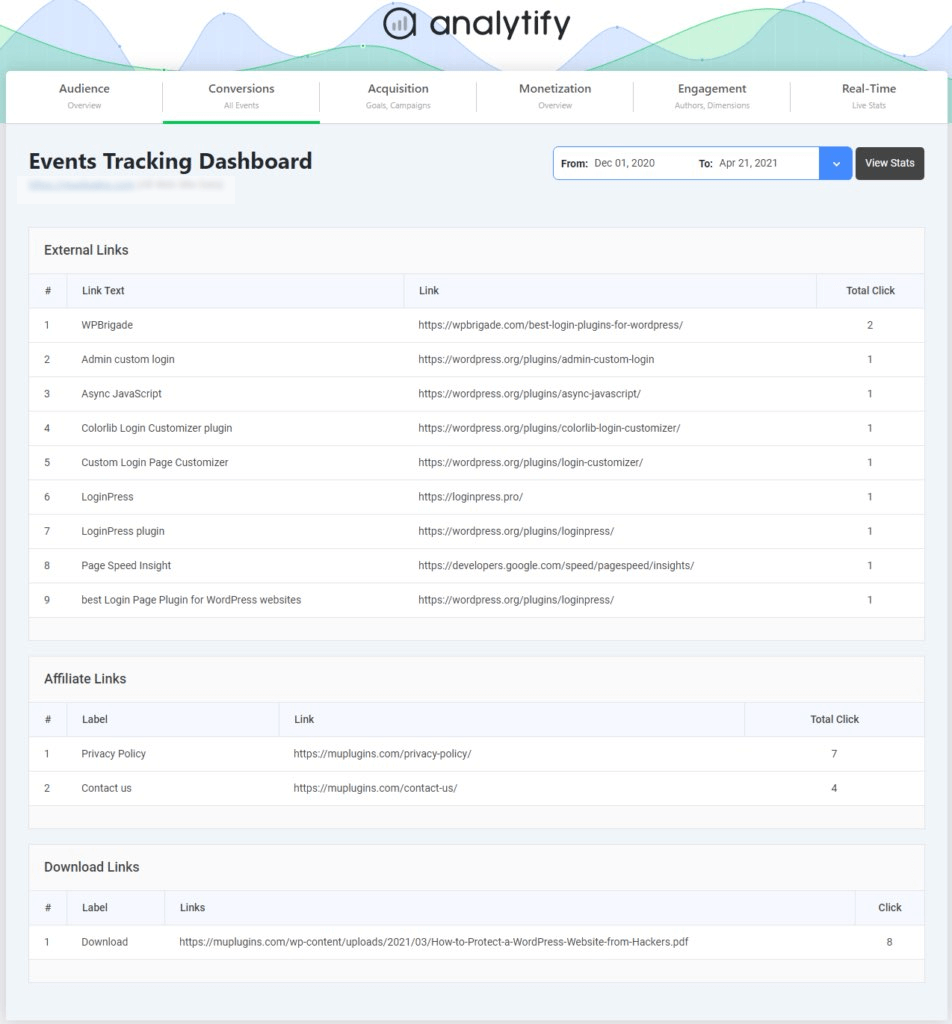
The Analytify plugin manages conversion tracking through the Event Tracking Addon. After installing and configuring the addon to monitor specific user actions, you can view conversion data in the conversion section of the Analytify dashboard.
11. Backlinks
Backlinks are links from external websites that direct users to your site. They are a key factor in SEO, as they help improve your site’s search engine ranking. High-quality backlinks indicate that other reputable sites value your content, which can boost your site’s visibility and credibility.
In content marketing metrics, backlinks are essential for evaluating your content’s effectiveness in attracting and retaining attention from other websites.
To learn more about backlinks, check out this comprehensive guide: How to get backlinks.
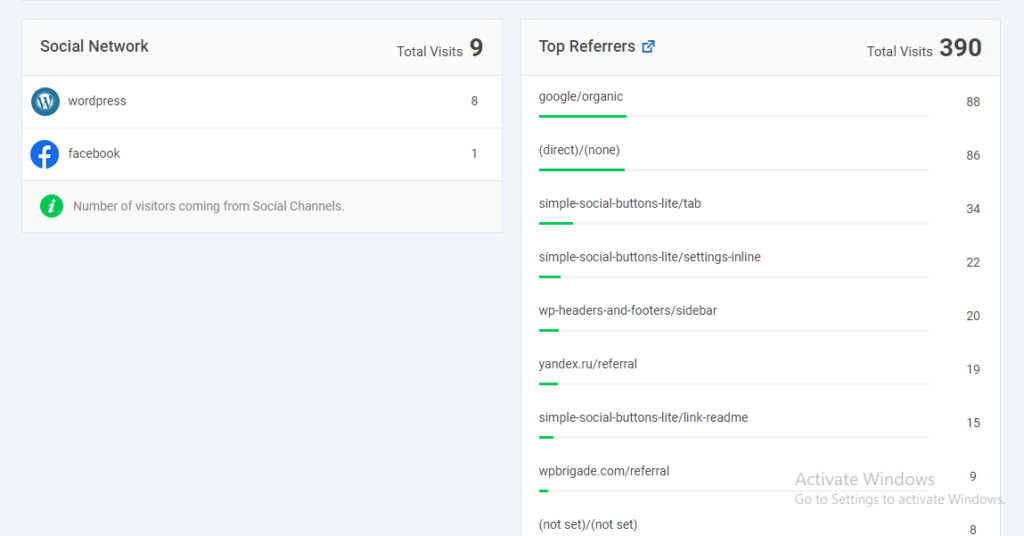
In Analytify, the Top Referrers feature can be used to track backlinks. This feature identifies the websites sending the most traffic to your site, effectively showing which external sites are linking.
12. Content Shares
Content Shares refer to the instances when users share your content, such as blog posts or articles, on their social media platforms or other channels. This metric indicates how well your content resonates with your audience and how effectively it encourages users to spread it further.
The Content Shares metric measurement is crucial in understanding the reach and impact of your content. High sharing rates suggest that your content is engaging and valuable to users, which can enhance brand visibility and drive more traffic to your site.
Check out this guide for additional information on analyzing social media traffic and optimizing your content strategy.
The Analytify plugin allows you to track content shares. This information is typically available in the Social Network or Referral Traffic sections of the Analytify dashboard, where you can view data on how often your content is shared across different platforms.
13. Lead Generations
Lead Generation is the process of attracting and capturing potential customers’ contact information, such as email addresses or phone numbers. This is typically achieved through forms and sign-ups to build a list of potential customers who can be followed up with and turned into paying customers.
By tracking lead generation, you can evaluate the success of your content marketing efforts’ success in producing high-quality leads and ultimately driving conversions.
If the Analytify plugin is configured to capture leads, lead generation can be tracked through the Forms Tracking Addon and Event Tracking Addon. This data helps you monitor the performance of lead generation efforts directly within the WordPress dashboard.
14. Brand Mentions
In GA4, brand mentions refer to instances where your brand name or related terms appear across various digital platforms, such as websites, social media, or forums. This metric helps track how often and in what context your brand is being discussed or referenced online.
Brand mentions are significant in measuring content marketing as they provide details about brand visibility and sentiment. Tracking these mentions helps you understand the reach and impact of your content to determine audience perception. It assesses the effectiveness of your marketing efforts in driving brand awareness and engagement.
Some popular tools for tracking Brand mentions are Google Alerts and SEMrush Brand Monitoring. These tools help measure brand visibility, audience perception, and the impact of your marketing efforts in building brand awareness and engagement.
In the Analytify plugin, you need to use integrated social media analytics or track referral sources and social shares to gather brand mention-related data, which can provide indirect information about brand mentions and their impact on your content.
15. Follower/subscribers Growth
Follower/subscriber growth refers to the increase in the number of people who follow or subscribe to your content.
Measuring follower/subscriber growth helps determine brand engagement and audience development. A steady increase indicates that your content is valuable and engaging. This shows your content strategy’s effectiveness in attracting and retaining an audience, which can boost brand loyalty and conversions.
Analytify tracks the subscriber growth under the Form Tracking addon. This metric is displayed on the form tracking dashboard.
16. Email Engagement metrics
Email Engagement Metrics refer to how you measure recipients’ interactions with your email campaigns. These metrics typically include open rates, click-through rates (CTR), bounce rates, and unsubscribe rates.
By tracking these metrics, you can optimize your email strategy to improve engagement, increase conversions, and build stronger relationships with your audience.
In Analytify, the Email Notifications Addon helps track Email Engagement Metrics by sending automated email reports with key performance data. It provides updates on traffic, user behavior, and conversions, allowing you to monitor and optimize the effectiveness of your email campaigns.
For more details on email marketing best practices, you can visit our Article: 21+ Email Marketing Best Practices and how to track email marketing with GA4.
17. Content Marketing Return On Investment
Content Marketing Return on Investment (ROI) measures the financial return you gain from your content marketing efforts compared to the costs involved in producing and promoting that content. It evaluates whether your content marketing generates profits or leads relative to your investment.
It helps you understand the effectiveness and profitability of your campaigns, allowing you to determine which strategies yield the highest returns. By tracking ROI, you can allocate resources more efficiently, optimize your content strategy, and demonstrate the value of content marketing to investors.
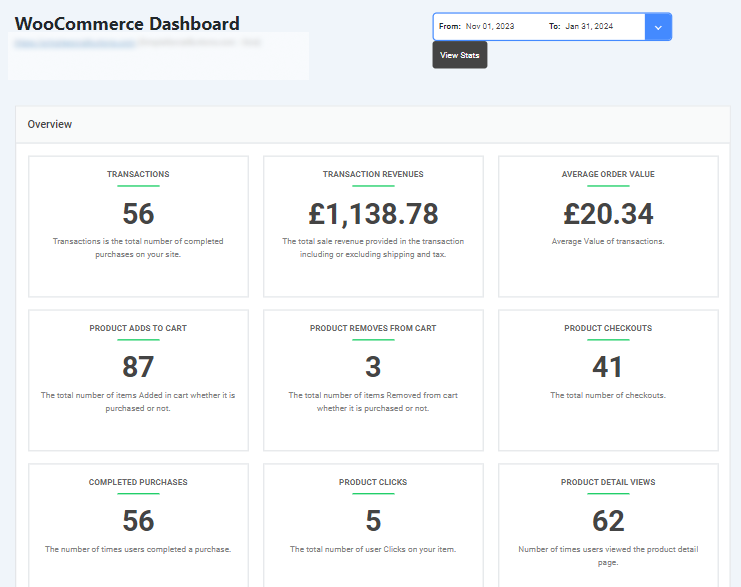
In Analytify, you can track content marketing performance through UTM Campaign Tracking and woocommerce addon. You can monitor conversions, sales, and user engagement to analyze how well your content is performing and derive ROI by comparing results to your costs.
Content Marketing Metrics to Monitor for Different Businesses
Understanding your business type is crucial for selecting the most relevant metrics. Specific metrics may vary depending on individual business goals and strategies. This table provides a general overview of key metrics for different business types:
| Business Type | Key Metrics To Monitor |
| New or Small Businesses | – Brand Awareness – Organic Search Traffic – Social Media Engagement – Subscriber Growth – Content Shares |
| Established Businesses | – Lead Generation – Conversion Rates – Engagement Metrics – Customer Retention and Loyalty – SEO Improvement |
| eCommerce Businesses | – Conversion Rates – Sales and Revenue – Cart Abandonment Rates – Customer Lifetime Value (CLV) |
| Subscription-Based Businesses | – Subscription Growth – Churn Rate – Customer Lifetime Value (CLV) – Engagement Metrics – Renewal Rates |
| Non-Profit Businesses | –Website Traffic -Donations -Volunteer sign-ups -Social media engagement -Email open rates |
| Healthcare | -Website Traffic -lead generation (appointment bookings, contact forms) -Time on site -Social media engagement -Email open rates -Patient satisfaction surveys |
Content Marketing Metrics (FAQ)
1. What are content marketing KPIs?
Content marketing KPIs (Key Performance Indicators) are measurable values that indicate how effectively your content achieves business objectives. Common KPIs include engagement rates, conversion rates, and traffic metrics.
2. How do you know if your content is performing well?
You can determine content performance by looking at various metrics. High engagement rates (clicks, shares, comments), increased traffic, and conversion rates (such as sign-ups or purchases) are signs of successful content. Additionally, low bounce rates and high Average time on the page suggest that your audience finds value in the content.
3. Which metric is the most important in content marketing?
There’s no single most important metric; it depends on your goals. Engagement metrics (time on page, shares, clicks) and conversion rates are key to content success. Focus on traffic and brand mentions for brand awareness, while conversion rates are crucial for lead generation.
4. How can I measure ROI in content marketing?
ROI is measured by comparing the revenue generated from your content to the cost of producing and promoting it. Use tools like Google Analytics to track conversions and revenue.
5. How do you measure the effectiveness of content marketing?
To measure content marketing effectiveness, track metrics such as engagement rates (likes, shares, comments), traffic, and conversion rates. Analyze these metrics to determine how well your content drives user interaction, generates leads, and achieves your business goals.
Wrapping up!
Tracking the right Content Marketing Metrics is vital for achieving success. By focusing on key content marketing KPIs and performance metrics, you can evaluate the effectiveness of your content strategy and get better results.
Regularly measuring content metrics like engagement rates, traffic sources, and conversion rates helps optimize your strategy and drive better results. Ultimately, understanding how to measure content marketing success allows you to refine your approach, enhance your content’s impact, and maximize your ROI.
For more in-depth guidance on understanding and optimizing your content marketing ROI, check out this comprehensive guide on How to Improve Content Marketing ROI.
Do you have any thoughts or questions? Share them in the comments below—we’d love to hear from you!


