Website KPIs That Actually Matter (And How to Track Them Easily)
Most websites don’t have a data problem. They have a clarity problem.
GA4 shows dozens of metrics, pageviews, sessions, events, and engagement, but when everything looks important, it’s hard to know which numbers actually matter.
If you run a WordPress site, lead-generation business, or eCommerce store, it’s easy to get lost in dashboards while missing the KPIs that truly drive decisions. You might see traffic going up.
But is that traffic doing anything useful? Is it reading your content, filling out forms, or buying your products?
This is where many websites go wrong. They track too many metrics and call them KPIs.
As a result, reports grow, but decisions don’t improve.
Website KPIs are different. They focus on outcomes, not activity. Growth. Leads. Revenue. Retention.
In this guide, you’ll learn which website KPIs actually matter and how to track them without overcomplicating GA4.
Website KPIs (TOC):
What are Website KPIs (And What They Are Not)
Website KPIs are not just numbers you report. They are numbers that help you decide what to do next.
A website KPI (key performance indicator) is a metric tied to a clear goal. If it doesn’t influence a decision, it’s not a KPI.
This is where many websites get confused.

KPIs vs Metrics
Metrics are raw data points. Pageviews, sessions, clicks, events.
KPIs are selected metrics. They measure progress toward something specific, like getting more leads or increasing revenue.
Every KPI is a metric. Not every metric deserves to be a KPI.
KPIs vs Vanity metrics
Vanity metrics look good in reports but don’t guide action.
High traffic is a common example.
If traffic increases but conversions stay flat, has the website improved?
Not really.
A good KPI answers a question like:
- Is this website moving us closer to our business goal?
- Should we change something based on this number?
Why KPIs must Align with Goals
KPIs only work when they match your website’s purpose.
A blog focused on growth needs different KPIs than an ecommerce store.
A lead-gen site should not track success the same way as a content site.
That’s why copying KPI lists from other websites rarely works.
Your KPIs should reflect your goals, not someone else’s dashboard.
How to Choose the Right KPIs for Your Website
Choosing the right KPIs for a website is about focus, not volume.
The goal is to track signals that reflect real progress.
The easiest way to do this is to start with your website’s purpose.
Step 1: Define your Primary Website Goal
Every website exists to achieve something specific.
Your goal might be:
- Increasing traffic and visibility
- Generating qualified leads
- Driving ecommerce sales
- Improving content performance
Your website KPIs should directly support that goal.
Step 2: Identify the Action that Defines Success
Next, identify what a successful visitor actually does.
For example:
- Reads multiple pages or spends more time on content
- Submits a form or signs up
- Adds a product to the cart or completes a purchase
These actions indicate website success more clearly than traffic alone.
Step 3: Select KPIs that Measure Those Actions
Now choose website key performance indicators that track those behaviors.
Good KPIs for a website might include:
- Engagement rate for content-driven sites
- Conversion rate for lead generation
- Revenue and transactions for ecommerce
If a metric does not influence a decision, it should not be treated as a KPI.
Why Copying KPI Lists Often Fails
Many guides publish long lists of website analytics KPIs. Most of them are not wrong, but they are rarely universal.
KPIs that work for one website may not work for another.
Your website success metrics should reflect your goals, audience, and business model.
When you track fewer KPIs, patterns become clearer.
And clearer patterns lead to better decisions.
Core Website KPIs Every Site Should Track
Every website is different, but some KPIs apply to almost all sites. These website KPIs create a baseline for understanding performance.
Not all of them need to be primary KPIs. However, each one helps explain how users interact with your site. Below are the best KPIs for content, ecommerce, and lead generation sites.
Users and Sessions
Users and sessions show how many people visit your website.
They help measure overall reach and visibility.
On their own, these metrics do not indicate success. They become useful when paired with engagement or conversions.
Engagement Rate
Engagement rate shows how many sessions involved meaningful interaction.
It replaces bounce rate as a more useful engagement signal.
A higher engagement rate usually indicates better content relevance. A sudden drop can signal content or UX issues.
Average Engagement Time
Average engagement time shows how long users actively interact with your site.
It helps identify whether visitors find your content useful.
This KPI is especially important for content and blog websites.
Low engagement time often points to a mismatched intent.
Conversion Rate
Conversion rate measures how effectively your website drives actions.
These actions might include form submissions, signups, or purchases.
This is one of the most important website analytics KPIs.
It directly reflects whether your site supports business goals.
Traffic Source Performance
Traffic source performance shows where your visitors come from.
It helps evaluate the quality of different channels.
Some traffic sources bring volume.
Others bring conversions.
Understanding this difference leads to better marketing decisions.
Website KPIs by Business Type
Not all websites measure success the same way.
The right website KPIs depend on how your site creates value.
A content site, a lead generation site, and an ecommerce store all have different goals.
That’s why the same digital marketing KPIs do not work equally well for every website.
Below are the most important website success metrics by business type.
Content and Blog Websites
Content websites focus on attention and retention.
Traffic alone is not enough to measure success.
Key website KPIs for content sites include:
- Engagement rate, to understand content relevance
- Average engagement time, to measure reading behavior
- Scroll depth, to see how much content users actually consume
- Returning users, to track audience growth
These website analytics KPIs help answer an important question.
Are visitors finding value, or are they just passing through?
When engagement improves, content performance usually follows.
That often leads to stronger brand authority and long-term growth.
Lead Generation Websites
Lead generation websites focus on actions, not visits.
Success depends on traffic quality.
Important KPIs for a website focused on leads include:
- Form submissions, as a primary conversion signal
- Conversion rate, to measure page effectiveness
- Traffic source quality, to identify high-intent channels
- Landing page performance, to spot drop-off points
These digital marketing KPIs show which pages and channels drive real leads.
They also reveal where optimization efforts will have the biggest impact.
Higher traffic does not always mean better results.
Better conversions usually do.
Ecommerce Websites
Ecommerce websites measure success through revenue.
Engagement matters, but sales matter more.
Core website KPIs for ecommerce include:
- Revenue and transactions, to measure overall performance
- Average order value (AOV), to track purchase behavior
- Product performance, to identify top-selling items
- Funnel drop-offs, to find where users abandon the process
These website success metrics help teams improve pricing, product pages, and checkout flows.
Even small improvements in these KPIs can lead to significant revenue gains.
B2B Website KPIs That Actually Matter
B2B websites work differently from other sites.
Most visitors do not convert on their first visit.
Sales cycles are longer.
Decisions involve multiple touchpoints.
That makes some common website KPIs misleading for B2B teams.
Focus on lead quality, not volume
High traffic does not always mean better results.
B2B websites need qualified leads.
Important B2B website KPIs include:
- Conversion rate, to measure lead efficiency
- Lead quality indicators, such as repeat visits or high engagement
- Traffic source quality, to identify high-intent channels
These KPIs help separate interest from intent.
They also prevent teams from optimizing for the wrong audience.
Track assisted and influenced conversions
Many B2B conversions happen after several visits.
Content often plays a supporting role.
Useful website analytics KPIs for B2B include:
- Assisted conversions, to understand the indirect impact
- Content influence, to see which pages support lead generation
- Returning users, to track buying consideration
These website success metrics show how content contributes beyond first-click conversions.
Account for long sales cycles
B2B success rarely happens in a single session.
That makes short-term metrics less reliable.
KPIs should be reviewed over longer periods.
Trends matter more than daily changes.
When B2B website KPIs are aligned with the sales cycle, insights become clearer.
And clearer insights lead to better marketing and content decisions.
How to Track Website KPIs in GA4 (and See Them Easily with Analytify)
Let’s see where to track website KPIs in GA4, what to look for, and how Analytify simplifies the process by bringing all your essential KPIs directly into WordPress.
Read how to connect GA4 with your website using Analytify.
Step 1: Map Your KPIs to the Right GA4 Reports
Before tracking anything, identify the KPIs that matter most for your website goals. Then map each KPI to the corresponding GA4 report for actionable insights.
1. Engagement Rate / Average Engagement Time – Engagement Report
Engagement metrics reveal which pages keep visitors interacting. A sudden drop can signal content, design, or UX issues.
Where to find it in GA4:
- Go to Reports >> Engagement >> Overview for overall engagement trends.

- For page-specific insights, navigate to Reports >> Engagement >> Pages and Screens.

Key metrics to track:
- Engaged Sessions: Sessions lasting 10+ seconds, with 2+ page views, or at least 1 conversion.
- Engagement Rate: Percentage of sessions considered “engaged.”
- Average Engagement Time per Session: How long users actively interact with your site.
How to act:
- Improve low-performing pages by rewriting content, adding visuals, or making it more interactive.
- Optimize page speed to reduce bounce rates.
- Enhance navigation and internal linking to encourage exploration.
- Add clear CTAs to drive further engagement.
2. Conversion Rate / Form Submissions – Conversions & Events Report
Conversion KPIs track whether visitors complete important actions, like signing up for a newsletter or making a purchase.
Where to find it in GA4:
- Reports >> Engagement >> Conversions for overall conversion metrics.

- Events >> All Events for tracking specific form submissions, downloads, or other actions.

Key metrics to track:
- Conversion rate for key actions.
- Number of form submissions or goal completions.
- Event-specific engagement patterns.
How to act:
- Simplify forms and reduce friction in the signup process.
- Test CTAs, button placements, or landing page design.
- Focus on high-value actions that directly impact your business goals.
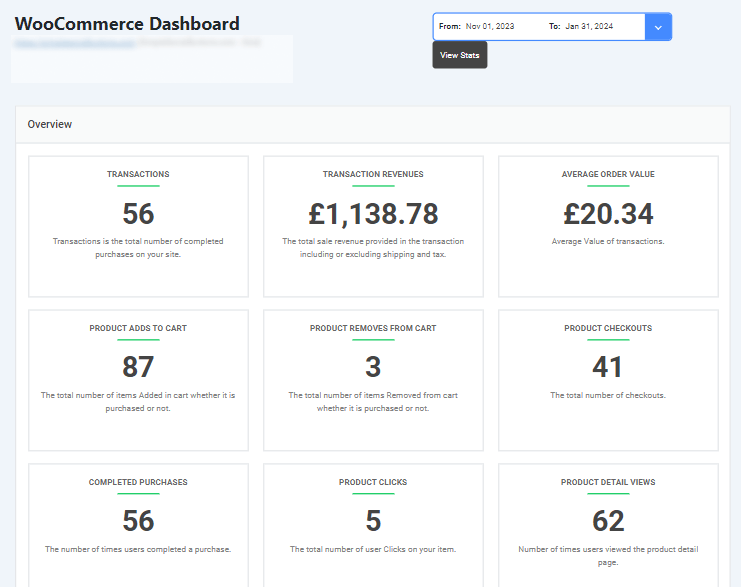
3. Revenue, Transactions, Average Order Value (AOV) – Ecommerce Report
For online stores, revenue-related KPIs measure financial performance. Tracking these helps identify opportunities to increase sales or optimize pricing.
Where to find it in GA4:
- Reports >> Monetization >> Ecommerce Purchases for transactions and revenue.

- Reports >> Monetization >> Overview for metrics like total revenue, average purchase value, and top products.
")
Key metrics to track:
- Total revenue and transactions.
- Average Order Value (AOV).
- Product performance by page or category.
How to act:
- Optimize product pages and descriptions.
- Test pricing and promotions.
- Improve checkout flow to reduce cart abandonment.
4. Returning Users / Engagement Patterns – Audience Reports
Understanding loyal visitors helps you identify content and products that drive repeat engagement. High repeat visits indicate strong content relevance.
Where to find it in GA4:
- Reports >> Audience >> Retention to measure returning users over time. Check New users vs Returning users.

Key metrics to track:
- Number of returning visitors.
- Frequency of visits per user.
- Engagement patterns across sessions.
How to act:
- Reward loyal users with exclusive content or offers.
- Promote content that drives repeat visits.
- Improve user experience for repeat interactions.
5. Traffic Source Performance – Traffic Acquisition Report
Not all traffic is equal. This report shows which channels bring high-value visitors who engage and convert, helping you prioritize marketing spend.
Where to find it in GA4:
- Reports >> Acquisition >> Traffic Acquisition for a breakdown of sessions by source, medium, and campaign.

Key metrics to track:
- Engagement and conversion rates by channel.
- Traffic volume from each source.
- ROI of marketing campaigns.
How to act:
- Focus efforts on channels that bring high-quality visitors.
- Refine underperforming campaigns to improve engagement.
- Allocate marketing budget based on channel performance.
Step 2: Avoid Common KPI Tracking Mistakes
- Don’t track everything: Only track KPIs tied to your goals.
- Focus on trends, not daily fluctuations: Weekly or monthly patterns reveal meaningful insights.
- Prioritize actionable KPIs: Every KPI should answer: “Does this help me improve my website or business?”
Step 3: Keep GA4 Reports Actionable
- Use default GA4 reports for most KPIs.
- Create custom reports only if you have unique goals.
- Highlight KPIs in dashboards to reduce clutter.
- Link KPIs to specific actions, e.g., if engagement drops, review content quality or UX improvements.
Simplify KPI Tracking in WordPress with Analytify
Join 50,000+ beginners & professionals who use Analytify to simplify their Google Analytics!
Google Analytics is known best to track your website analytics and KPIs. Analytify makes GA4 setup easy and automatically tracks the right KPIs. Allows mapping each KPI directly to Analytify reports (traffic, engagement, conversions, ecommerce), making Analytify the practical KPI tracking solution for WordPress users.

What Analytify gives you:
- Traffic & Engagement Reports: See top-performing pages and user interaction at a glance.

- Conversion Tracking: Monitor form submissions, signups, and purchases easily.
- Ecommerce Performance: Track revenue, transactions, and AOV in one place.
- Returning Users & Content Influence: Measure long-term engagement and repeat visits.
- KPI-Focused Dashboards: Only display metrics that matter, like trends, conversions, and engagement.
Why it matters:
- Reduces GA4 complexity.
- Keeps your team focused on actionable metrics, not vanity numbers.
- Enables faster, smarter decisions to grow your website.
Pro Tip: Think of GA4 as the engine collecting all your data, and Analytify as the dashboard showing speed, fuel, and navigation. You see exactly what matters to drive your website toward growth without distractions.
Frequently Asked Questions
1. What KPIs should I track for my website?
The KPIs you track should match what your website is built to achieve.
For most websites, the core KPIs are:
Conversions (leads, sales, sign-ups)
Conversion rate
Engagement rate
Traffic sources
Goal completions
If a metric does not help you decide what to improve or optimize, it is not a KPI.
GA4 shows these in the Engagement, Traffic acquisition, and Conversions reports, and Analytify displays them in simple website dashboards.
2. Which website metrics matter most for growth?
Growth comes from behavior + outcomes, not just traffic.
The most important website growth metrics are:
Users and sessions → Are more people coming?
Engagement rate → Are they staying and interacting?
Conversions → Are they taking action?
Traffic sources → Where is growth coming from?
Top landing pages → Which pages drive results?
You can find these in GA4 under Reports >> Acquisition and Reports >> Engagement, or view them directly in Analytify without digging through GA4 menus.
3. How do I track KPIs in Google Analytics 4?
To track KPIs in GA4:
Go to Configure Events.
Mark important actions (form submit, purchase, signup) as Conversions
Open Reports >>Engagement >> Conversions to view results
Use Traffic acquisition and Pages and screens to see what drives them
With Analytify, these KPIs appear automatically in WordPress as visual reports, so you don’t have to navigate GA4 every time.
4. What are the best KPIs for content, ecommerce, and lead generation sites?
Each website type has different KPIs.
For content websites:
Engaged sessions
Average engagement time
Scroll depth
Top pages
For ecommerce websites:
Purchases
Revenue
Conversion rate
Cart abandonment
Product performance
For lead generation websites:
Form submissions
Conversion rate
Landing page performance
Traffic sources
GA4 tracks all of these, but Analytify organizes them into website-type dashboards, making it easier to see what’s working.
5. Are KPIs different for small websites?
Yes. Small websites often focus on engagement and conversions first.
Large sites may track more advanced digital marketing KPIs, but the principle is the same: track what drives decisions.
6. What is the difference between metrics and KPIs for a website?
Metrics are raw numbers, like pageviews or clicks.
KPIs are selected metrics tied to business outcomes, such as lead generation, conversions, or revenue.
Website KPIs: Final Thoughts
Whether you are running a content site, lead generation site, ecommerce store, or B2B website, your KPIs should measure outcomes, not just activity.
By auditing your current metrics and simplifying your KPI set, you can see what truly drives growth, conversions, and engagement.
Fewer, well-chosen KPIs make trends clearer and decisions faster.
Analytify makes this process easy. It tracks all your essential website analytics KPIs inside WordPress, without complicated GA4 setup.
You get actionable insights at a glance, so you can focus on improving your site instead of digging through reports.
So, you measure what matters, act on it, and avoid chasing vanity metrics.
With the right KPIs in place, your website can finally become a tool that supports smarter decisions and real growth.
Further readings:
- How to Set Up Google Analytics Pageview Tracking? (2026)
- 15 Most Crucial SEO KPIs to Track in 2026 (Updated List)
Do you know which pages, channels, and actions are really driving your website’s growth right now? Share your thoughts below.