Google Analytics Behavior Map: How To Use Path Exploration to Trace User Journeys?

A Google Analytics behavior map is the Path Exploration report in GA4. It shows the sequence of pages and events users follow on your site, from entry to exit. I show you how to open it, read it, and customize it, and how to pair it with Analytify reports inside WordPress. This guide is for site owners, marketers, and WordPress users who want to find where visitors drop off.
If GA4 is not yet connected to your WordPress site, I recommend this setup guide first: How to Set Up Google Analytics 4 and Connect it to Your WordPress Site?.
Visit counts alone do not show how people use your site. You need to know where users come from, which pages they open, what actions they take, and where they leave. Behavior flow analysis in GA4 answers those questions.
In GA4, the behavior flow report is also known as Path Exploration. It visualizes how users move from one page or event to another. The limited flow reports in Universal Analytics are gone. GA4’s user flow analysis uses a flexible, event-based model that records each interaction as an event.
The sections below also explain each Path Exploration component and show how Analytify reports in your WordPress dashboard add context to the paths you find.
Table of Contents
What Is Behavior Flow Analysis in GA4?
Behavior Flow Analysis is a Google Analytics report that shows how users move through your website, from the page they enter to the actions they take and where they exit. It visually maps the common paths users follow, highlighting the sequence of pages or events.
Role in visualizing user paths:
- Helps you understand the typical journey visitors take.
- Shows where users engage the most, where they drop off, and how they navigate toward conversions.
- Identifies high-performing pages that keep users engaged.
- Supports content optimization by uncovering how users interact with different sections of your site.
Behavior flow analysis shows what works in your content flow and where it needs improvement. It shows both what users do and how they navigate, so you can improve engagement and conversions.
GA4 records each interaction as an event. Path Exploration uses those events to give detailed insights into user journeys.
Unlike the rigid Behavior Flow in Universal Analytics, GA4’s Path Exploration offers flexible, customizable visualizations to identify patterns, optimize engagement, and drive conversions.
How to Access the GA4 Behavior Flow Report Through the Path Exploration Report
To access the GA4 behavior flow report, open Explore in your GA4 property and start the Path exploration template. Follow these steps:
Sign in to GA4 and select your property
- Go to Google Analytics and sign in with an account. Choose the GA4 property for your site.
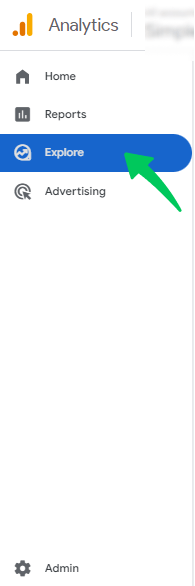
Open Explore
- In the left-hand menu, click Explore.
Choose Path Exploration
- Go to the Templates Gallery in GA4. Click Path exploration.
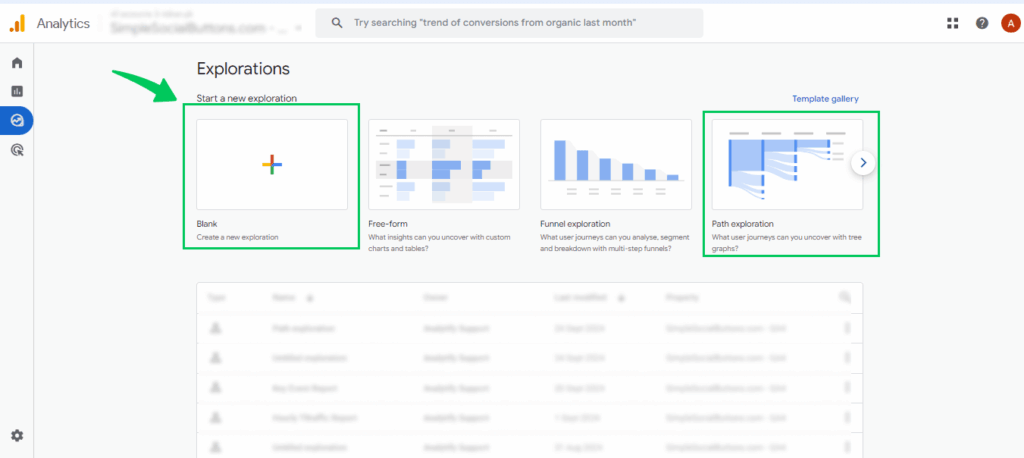
- (Optional) If you start with Blank, set the Technique to Path exploration.
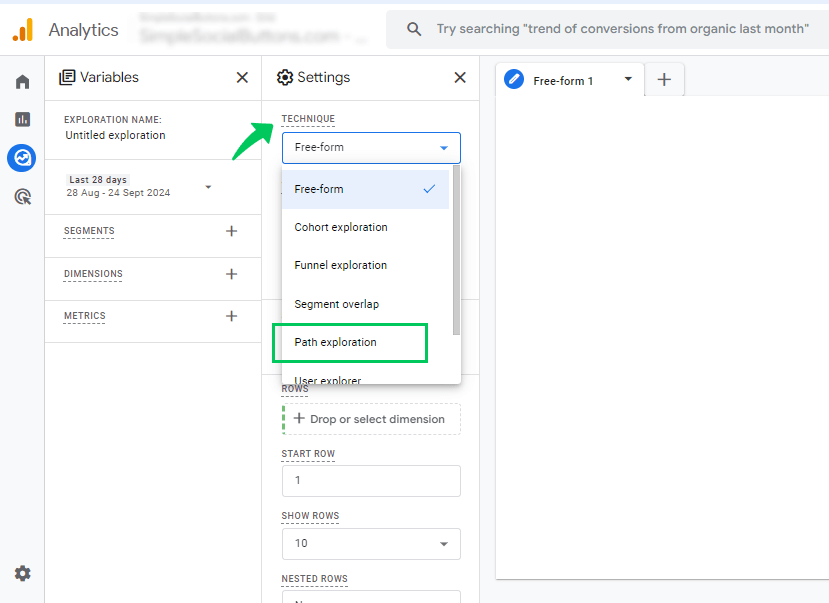
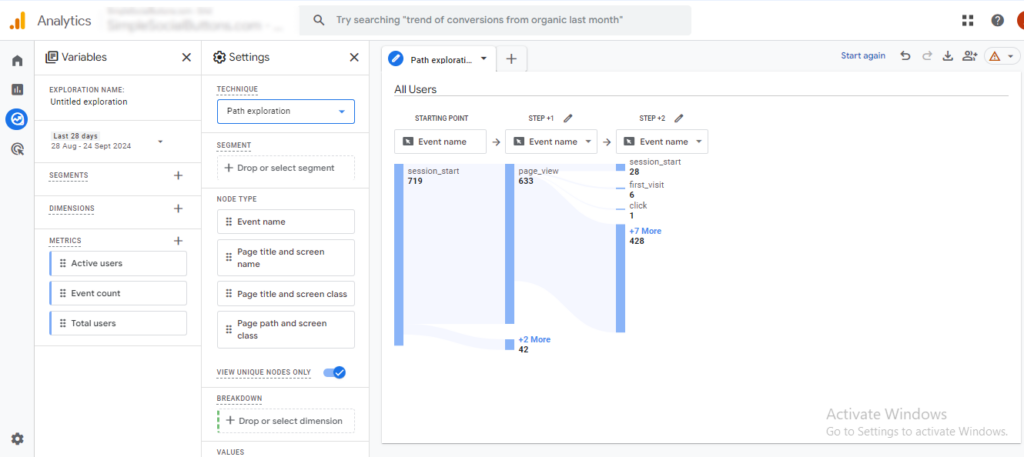
Now, you’ll see the Path Exploration interface, where you can begin analyzing how users move through your website or app.
Understanding the Path Exploration Interface
The Path Exploration interface has eight components: starting point, ending point, steps, connections, metrics, dimensions, interactive exploration, and forward and backward paths.
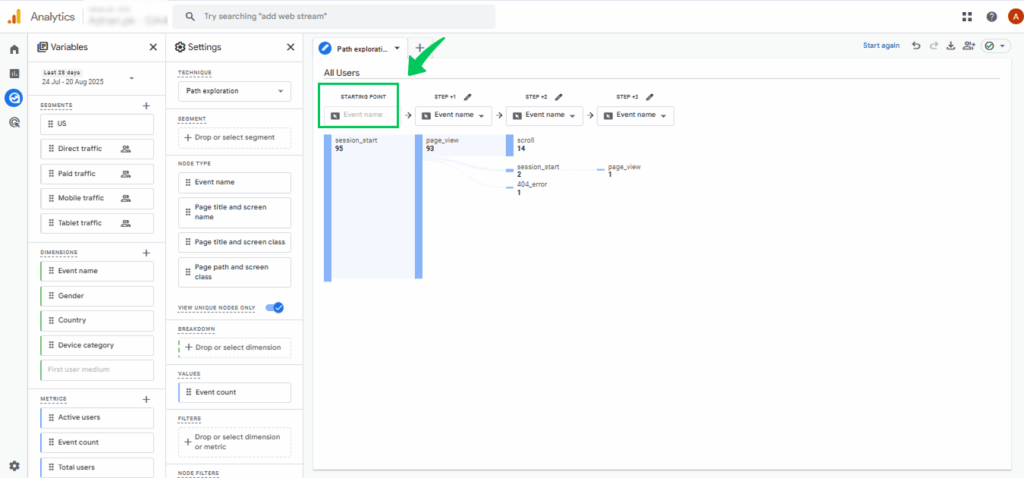
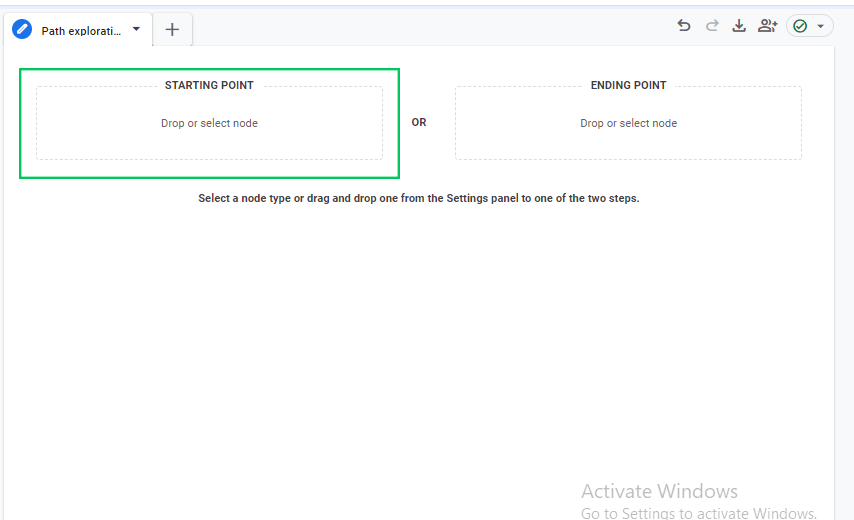
1. Starting Point
This is the first event or page in a user’s journey, such as session_start, homepage, or a landing page. The starting point sets where the analysis begins. Choose it to study how visitors enter your site or where they begin interacting with your app.
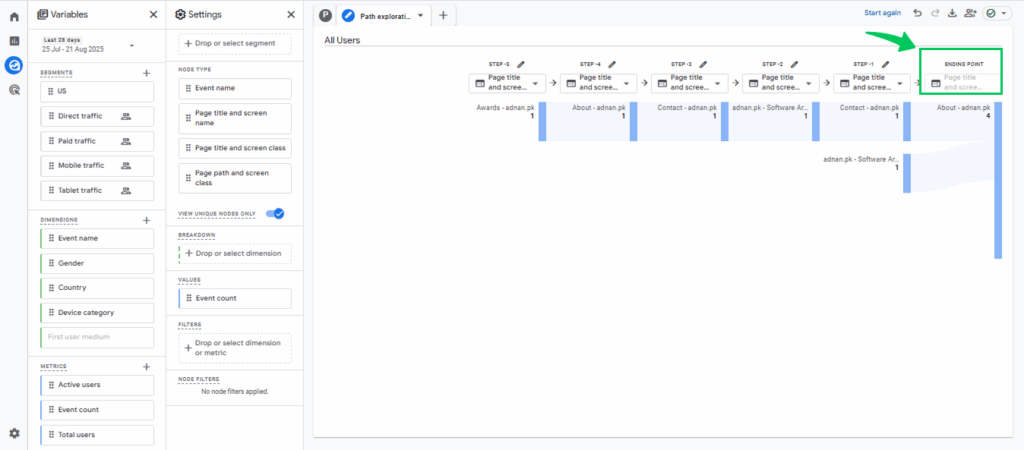
2. Ending Point
An Ending Point is the last interaction you want to analyze (e.g., a purchase confirmation page, a lead form submission, or a key event like sign-up). An ending point shows the journey leading up to a conversion or goal, and which pages or events most often lead users there.
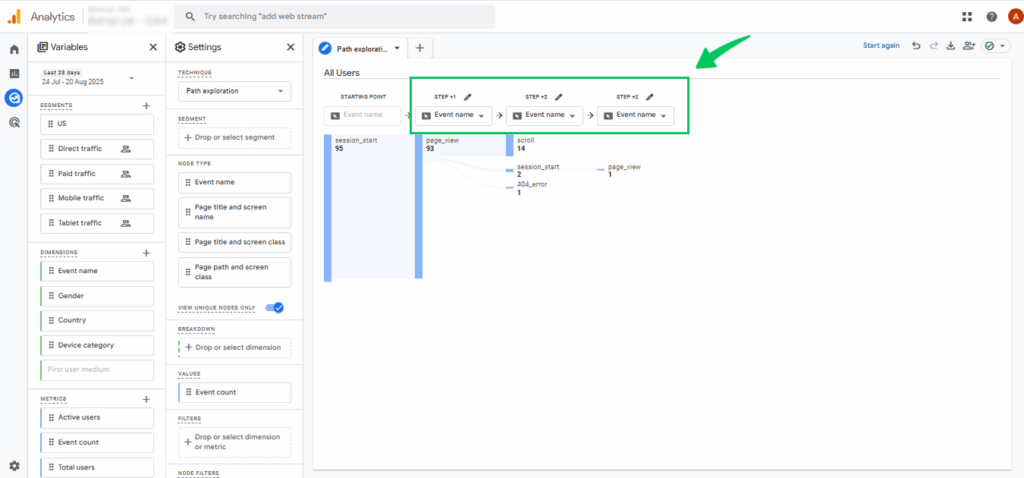
3. Steps
Steps represent each interaction, event, or pageview that users take after the starting point. Steps show the sequence of actions users follow from one interaction to the next. Reading the steps in order makes common behaviors and unexpected navigation patterns easier to spot.
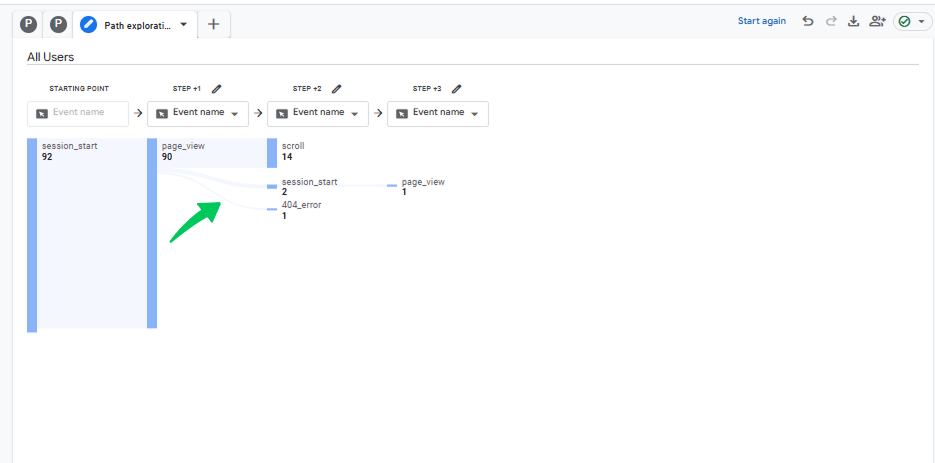
4. Connections
Connections are the lines between steps that visually map out how users move from one page or event to the next. They highlight the natural flow of traffic, reveal the most common paths, and help you spot unusual loops or drop-off points in the user journey.
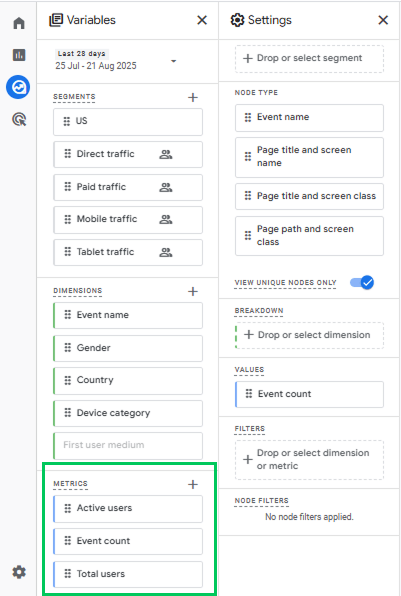
5. Metrics
Each node in a step shows the event count by default. You can switch the metric to total users. Comparing node values from step to step shows where users continue and where they leave the path.
6. Dimensions
In Explorations, including Path Exploration, there are two different places where “dimensions” appear:
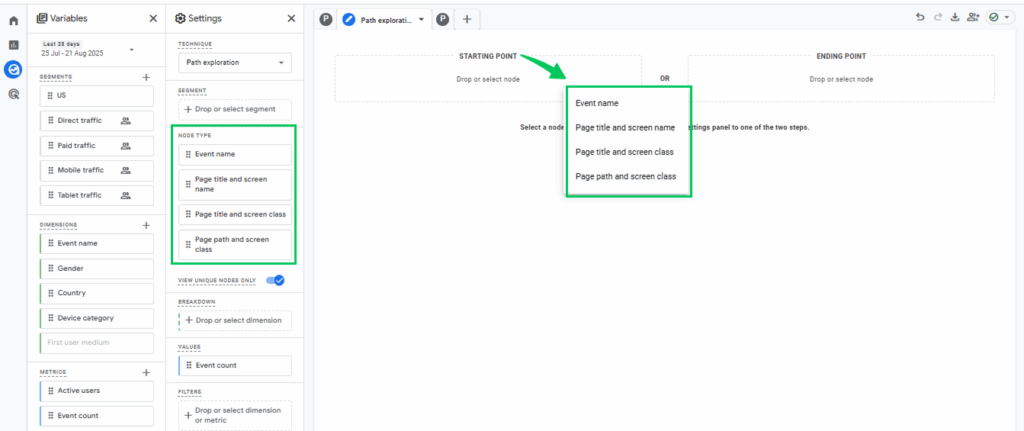
1. Node Type (in the Path setup panel)
This controls what the nodes in the flow represent (Page Path, Page Title, Event Name, Screen Class, etc.). Changing the Node Type changes the perspective of the flow itself.
- Example: Switching Node Type to Page Path and Screen Class makes the journey look like the old Behavior Flow (page-to-page).
So here, “changing Node Type” = changing the dimension used to define nodes in the path.
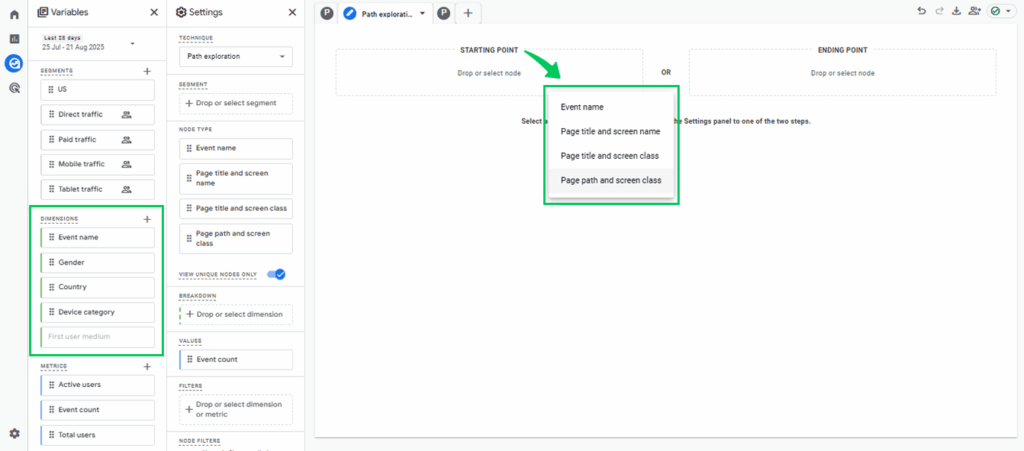
2. Dimensions Section (below Segments in the Variables column)
These are extra dimensions you can drag into the Breakdown or Filters area. They don’t change what the nodes represent, but instead add context or split the data.
- Example: Adding Device Category here lets you break down each node into Desktop vs Mobile users.
So here, dimensions = additional fields for filtering or breaking down paths, not redefining the nodes.
7. Interactive Exploration
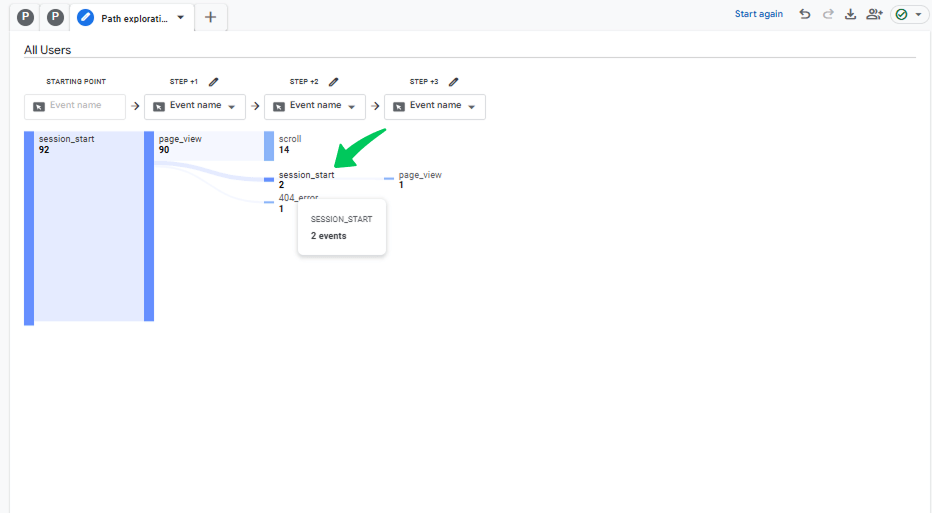
The Path Exploration report is fully interactive. You can click on steps for deeper insights, expand branches to reveal more details, or remove unwanted nodes to keep the path clean and focused on what matters most.
In the screenshot below, clicking the session_start event expands the next step, page_ view.
8. Forward & Backward Paths
GA4 lets you explore both forward and backward paths. Forward paths show what users do after the starting point, while backward paths reveal the actions or pages users visited before reaching the starting point, giving you a complete view of the user journey.
For a forward path, set a starting point. For a reverse path, set an ending point. A path exploration can have a starting point or an ending point, but not both.
Customizing Your Path Exploration Report
You can customize Path Exploration in four ways: change the dimensions, apply filters, use segments, or set up a reverse path. Each option is explained below.
1. Changing Dimensions
You can switch what each node in the path represents. For example, instead of tracking by default Event Name, change the Node type to Page title, Page path, screen class, or Screen name. Choosing the right Node Type depends on your analysis goal.
- If you want a Behavior Flow report, use Page path and screen class or Page title.
- If you’re focused on actions and events (like button clicks or conversions), stick with Event name.
This flexibility lets you explore user journeys either by pages, screens, or events, depending on your focus.
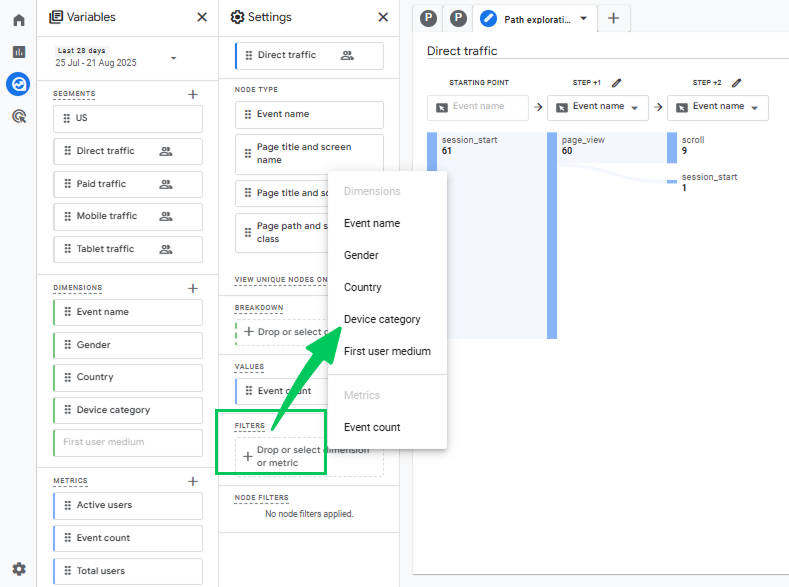
2. Applying Filters
Filters narrow down the entire exploration to only include the data you specify. For example, if you apply a filter for Device Category = Mobile, the whole report shows only paths from mobile users.
Apply a filter when you want to focus on one group or exclude noise (for example, to show only traffic from Organic Search).
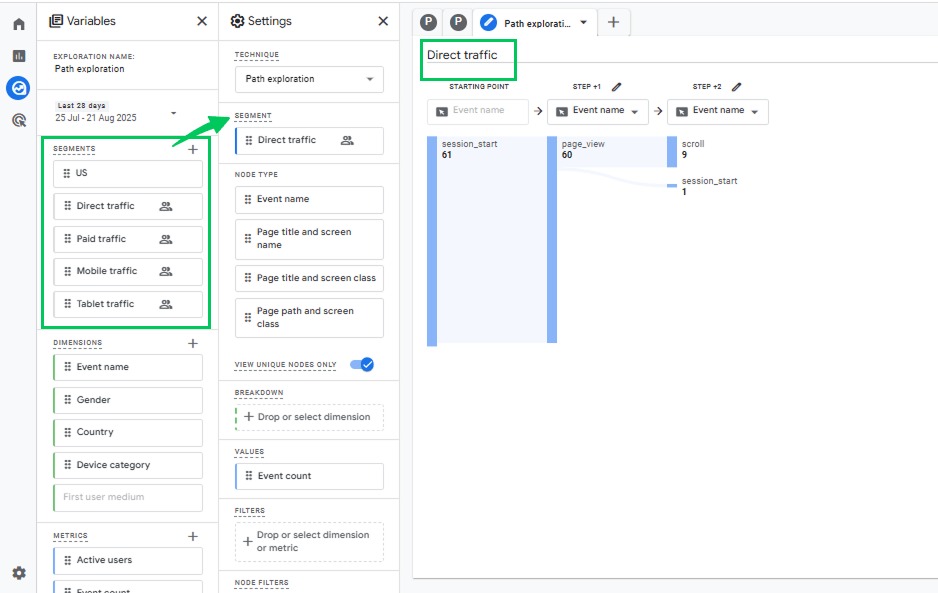
3. Using Segments
Segments let you limit the exploration to a subset of users or events. For example, apply a segment of new users to see only the paths new users take.
Apply a segment when you want to study one user group, such as paid traffic. To compare groups, add a breakdown dimension such as Device Category.
4. Setting Up Reverse Path Exploration
Instead of starting from the first interaction, you can set an Ending Point (such as a checkout confirmation page or lead form submission). GA4 will then show you the steps users took before reaching that endpoint, which is especially useful for analyzing conversions.
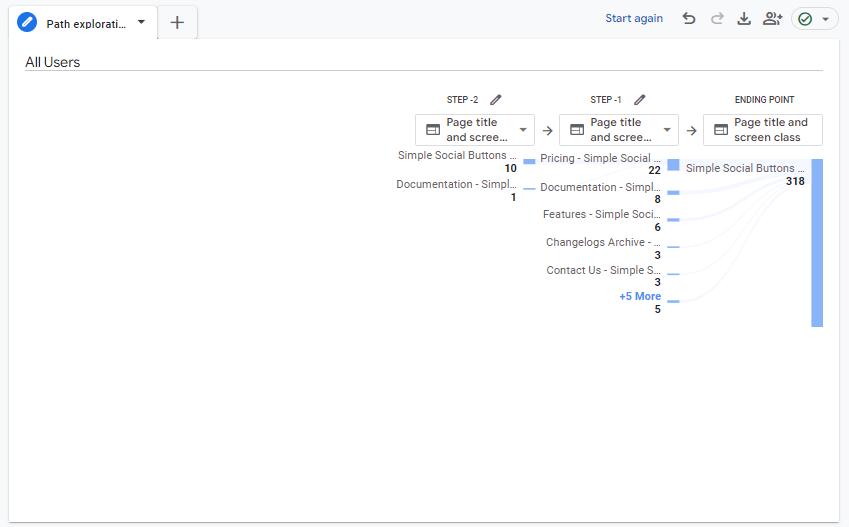
For complete guidance on setting up the reverse path exploration report, check this detailed setup guide.
Two example configurations show how to use Path Exploration. The first is Entry Point Analysis: select Page path or Page title as the starting node, such as the homepage or a key landing page.
Entry Point Analysis shows where users go after arriving: product pages, pricing, or an exit. It tells you how well entry pages guide users deeper into your site.
Another useful setup is the Goal-Focused Journey, which starts with an Event name, such as purchase or form_submit. Instead of looking forward, this configuration often examines the backward path to uncover the most common journeys leading to conversions.
The Goal-Focused Journey highlights which pages or actions most often lead to sign-ups or purchases, so you can see what works best in your funnel.
Analyzing User Behavior and Identifying Opportunities
Use the Google Analytics behavior map to find drop-off points, understand user intent, and detect navigation loops. Each finding shows where to improve navigation, content, or conversions.
- Identifying Drop-Off Points: The GA4 behavior flow report highlights where users leave your site. Drop-offs may happen due to slow pages, weak CTAs, or irrelevant content. Fixing these weak spots helps reduce exits and improve engagement.
- Understanding User Intent: With user flow analysis, you can track how visitors move toward goals. The Google Analytics behavior map shows their interests, helping you align content and CTAs with user intent for smoother journeys.
- Detecting Navigation Loops: Behavior flow analysis in GA4 also reveals loops, where users revisit the same page. These often signal UX issues like confusing navigation, missing details, or unclear instructions. Streamlining navigation and adding clear links can resolve them.
Integrating GA4 Insights in WordPress Using Analytify
Join 50,000+ beginners & professionals who use Analytify to simplify their Google Analytics!
Analytify makes GA4 insights more accessible by bringing them directly into your WordPress dashboard. Instead of switching back and forth between Google Analytics and your site, you can view user flow patterns where you manage your content.
With Analytify, you get simplified access to advanced GA4 reports, including Path Exploration insights, user journeys, and engagement trends, all within an intuitive, WordPress-native interface.
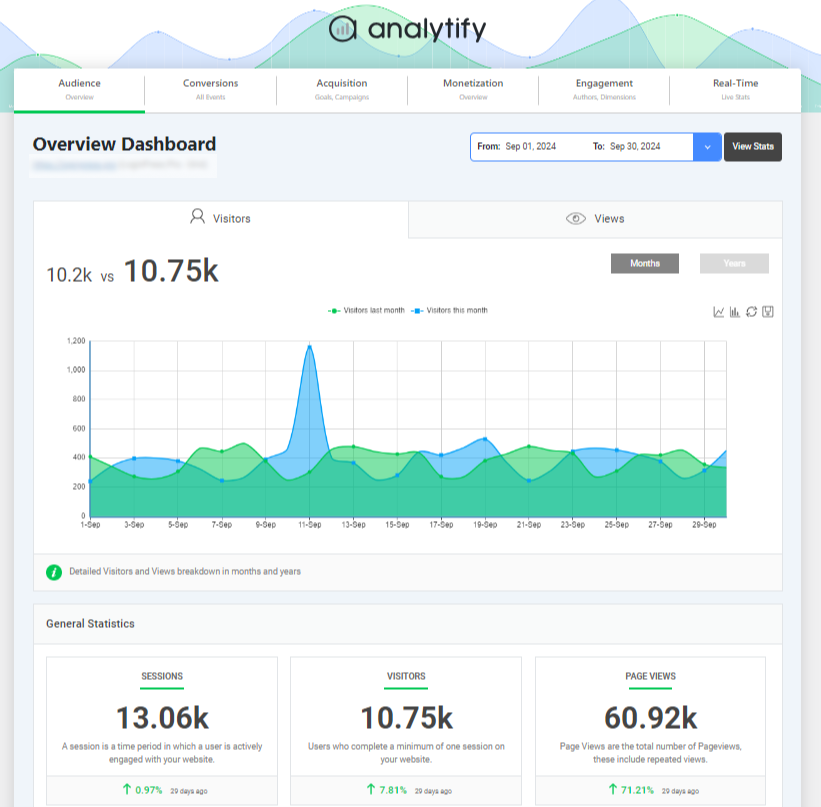
Using Analytify alongside GA4 helps you understand how users move through your pages and events, spot drop-offs or high-engagement areas, and refine navigation.
Analytify imports GA4 data into your dashboard, which removes technical hurdles and makes behavior flow insights easier to interpret.
With analytify, you can use:
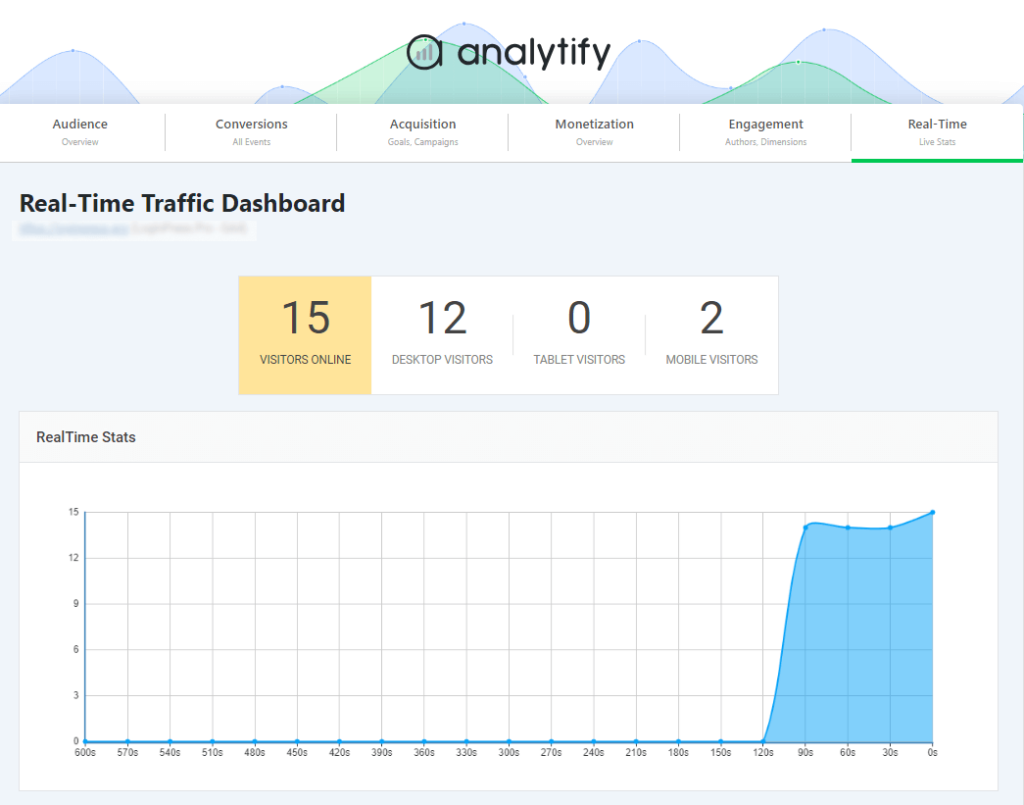
- Real-Time Dashboard
Analytify’s real-time dashboard helps confirm how users are moving across pages right now. This is especially useful when testing design updates or campaigns to spot changes in user paths instantly.
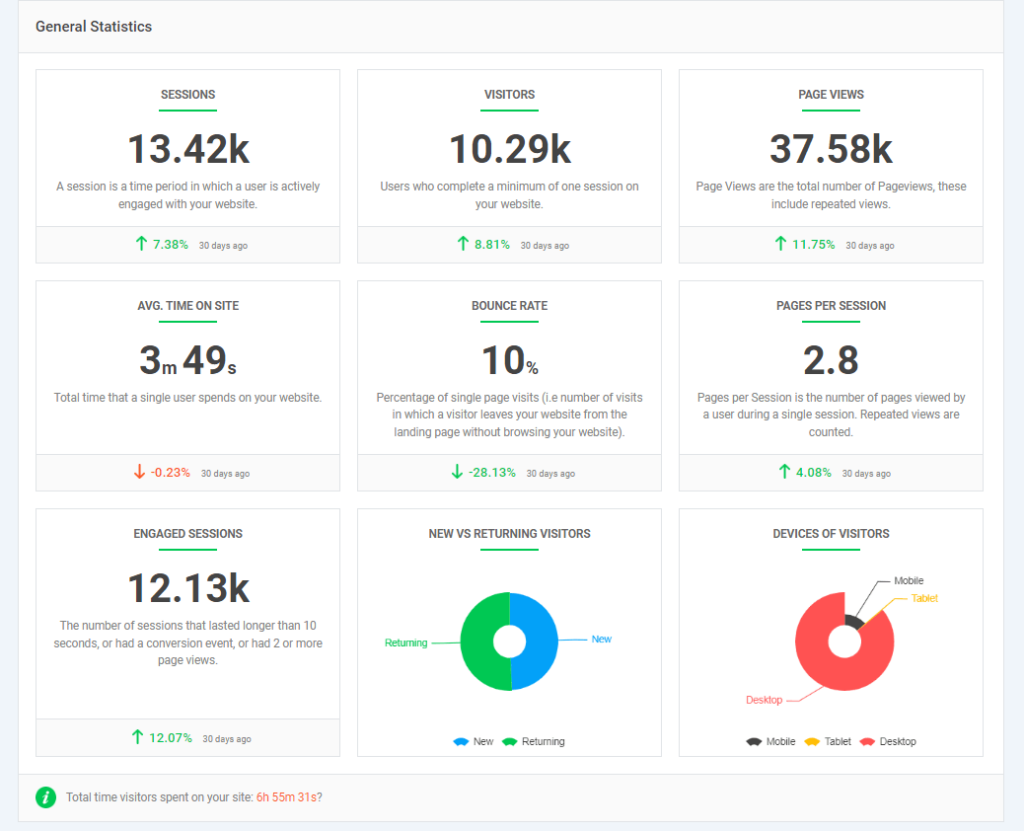
- General Statistics
Where Behavior Flow maps the journey, general statistics (sessions, users, bounce rate, avg. time on site) from Analytify provide the big picture. Together, they help you evaluate whether the identified user paths lead to meaningful engagement.
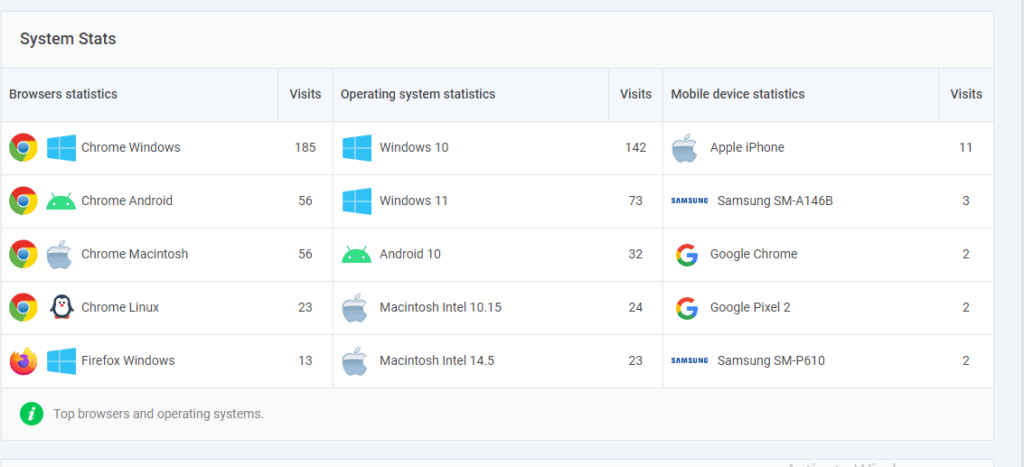
- System Stats
By combining flow data with system stats (device, browser, OS), you can detect whether drop-offs are linked to technical factors. For example, a checkout form is abandoned more often on mobile than on desktop.
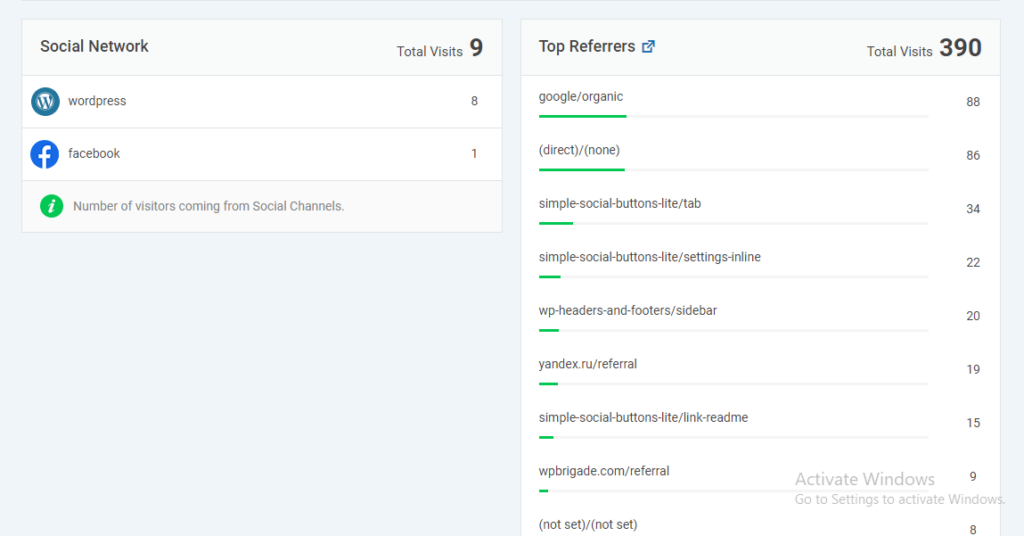
- Traffic Sources & Referral Report
Path Exploration shows how users move after arriving, while Analytify reveals where they came from. Correlating both helps you understand whether certain traffic sources (social, referral, search) create smoother journeys or higher drop-offs.
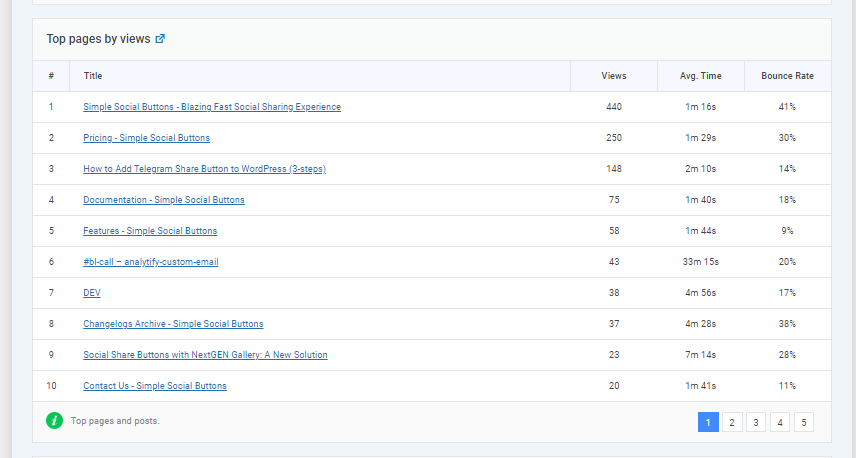
- Top Pages by Views Report
Behavior Flow highlights common entry and next steps; Analytify’s top pages report validates which content attracts the most visitors. Together, you can analyze whether top pages are driving deeper engagement or leading to early exits.
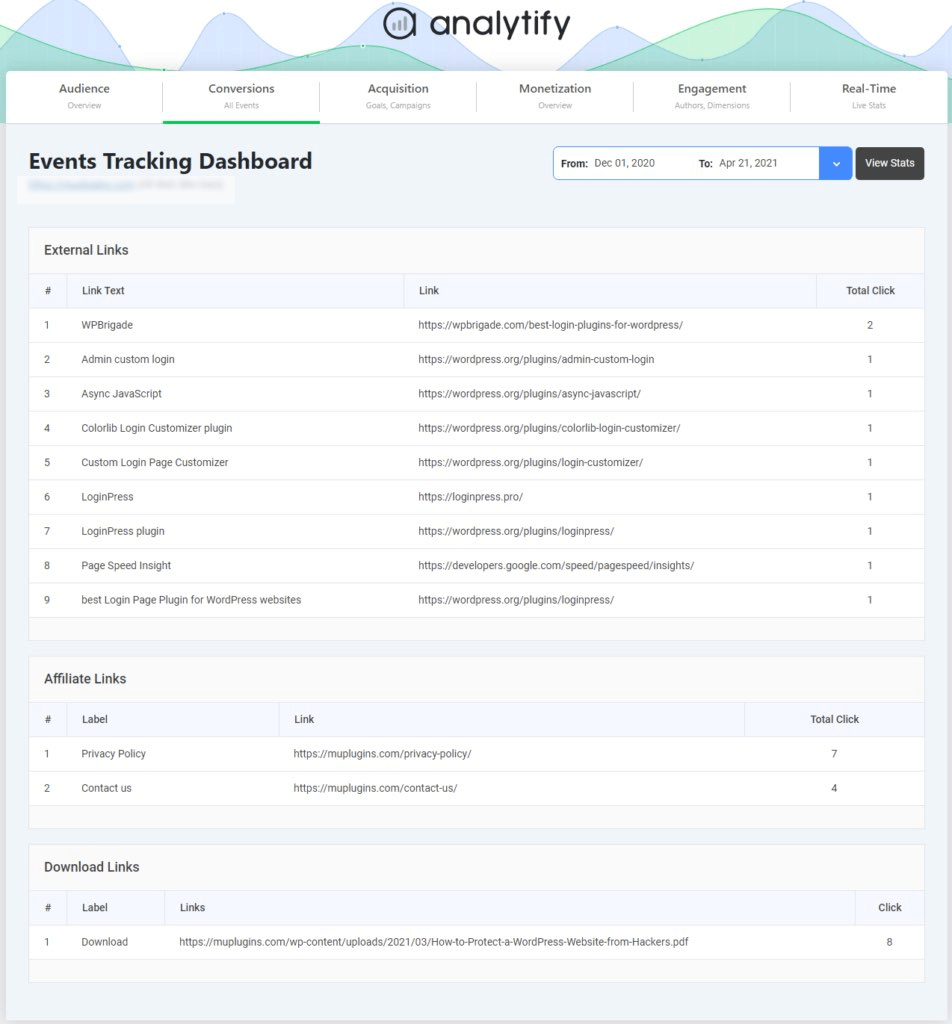
- Event Tracking
GA4 Path Exploration captures user interactions in sequence, and Analytify’s event tracking drills down into specific actions (button clicks, downloads, form submissions). By combining both, you see not only the path users took, but also the actions they took along the way.
In short, Analytify bridges GA4’s Behavior Flow insights with actionable WordPress reports, giving you a clear view of user journeys, drop-offs, and key actions, all without leaving your dashboard.
Frequently Asked Questions
1. What is the behavior flow in GA4?
In GA4, the Behavior Flow is represented through Path Exploration reports. It shows how users move from one page, screen, or event to another during their session. Instead of just showing raw metrics, it visualizes the journey, including entry points, the actions users take, and where they drop off. This helps you understand which paths drive engagement or lead to conversions, and which ones cause users to exit.
2. How to find behavior in Google Analytics?
In GA4, you won’t find a direct “Behavior” section like in Universal Analytics, but you can explore user behavior in a few ways:
Path Exploration Report: Shows the sequence of steps users take on your site/app.
Engagement Reports: Metrics like Views, Average Engagement Time, and Key Events provide insights into user behavior.
Events Report: Reveals how often specific interactions (like clicks, video plays, or downloads) occur.
3. What is a behavior flow chart?
A behavior flow chart (or path flow chart) is a visual map of user journeys. It uses nodes and connections to represent how users progress through different interactions. This flow chart makes it easier to spot friction points, identify popular pathways, and optimize your website’s navigation or content.
4. What is the difference between behavior flow analysis in GA4 and Universal Analytics?
In Universal Analytics, the Behavior Flow report mainly tracked pageviews and user movement between URLs. GA4’s Path Exploration (the new form of behavior flow) is more flexible; it tracks both page and event-based journeys, lets you switch dimensions like Page Title, Event Name, or Screen Class, and supports forward and backward path analysis for a deeper view of user behavior.
5. How does user flow analysis help improve website performance?
User flow analysis shows how visitors navigate through your site, highlighting the most common paths and where drop-offs occur. This helps identify friction points, optimize navigation, improve content placement, and guide users more effectively toward conversions.
6. What are the key benefits of conducting a behavior flow analysis in GA4?
Understand how users move from entry to exit points.
Spot pages or steps causing high drop-offs
Compare navigation patterns across devices or traffic sources.
Uncover hidden opportunities to improve engagement and conversions.
7. How do you set up and customize the Google Analytics behavior flow report?
To set it up, go to Explore >>Template Gallery >>Path Exploration in GA4. Choose a starting point (like session_start, homepage, or an event) and expand the steps forward or backward. You can then customize the report by switching dimensions (e.g., Page Title, Event Name), applying filters (like device or location), or setting reverse path exploration to analyze steps before a conversion.
Final Thoughts: Google Analytics Behavior Map
In this guide, we explored how the Google Analytics behavior map (via GA4 Path Exploration) helps you visualize and optimize user navigation. Behavior flow analysis shows how users move from entry to exit, highlighting drop-offs, high-engagement areas, and conversion paths.
You can find it in the Path Exploration report under GA4’s Explore section, making it easy to track forward and backward journeys. Core components like starting points, steps, connections, metrics, and filters reveal how users navigate, while interactive tools let you drill deeper.
By changing dimensions, applying filters, using segments, or setting up reverse path exploration, you can tailor the analysis to fit your business goals. GA4 helps you spot drop-offs, understand intent, and detect navigation loops so that you can refine content, design, and calls-to-action.
Analytify simplifies GA4 by bringing behavior flow insights directly into WordPress, making advanced analysis accessible without technical hurdles.
For further guidance, you can read:
Share how you use the Path Exploration report in the comments below.