How to Create Google Analytics 4 (GA4) Dashboards

A GA4 dashboard is a customizable panel that shows the metrics you choose. It lives in GA4, or in a connected tool: Analytify, Looker Studio, or BigQuery.
You can build one four ways. In GA4’s Reports section directly. Through the Analytify WordPress plugin, with zero setup. In Looker Studio, for shareable reports. Or in BigQuery, for large-scale analysis. This guide covers all four, with exact steps.
You might be a marketer, analyst, or business owner. Either way, the GA4 dashboard can transform your data analysis.
This guide reflects the current GA4 interface. It also covers the fastest path for WordPress users: Analytify. Analytify shows these same metrics inside WordPress, no GA4 login or code needed.
Google Analytics Dashboards (TOC):
What is a Google Analytics Dashboard?
A Google Analytics dashboard visualizes your website or app’s data. That makes key metrics easier to understand. GA4’s dashboard is more flexible than older versions. You can customize it to fit your needs.
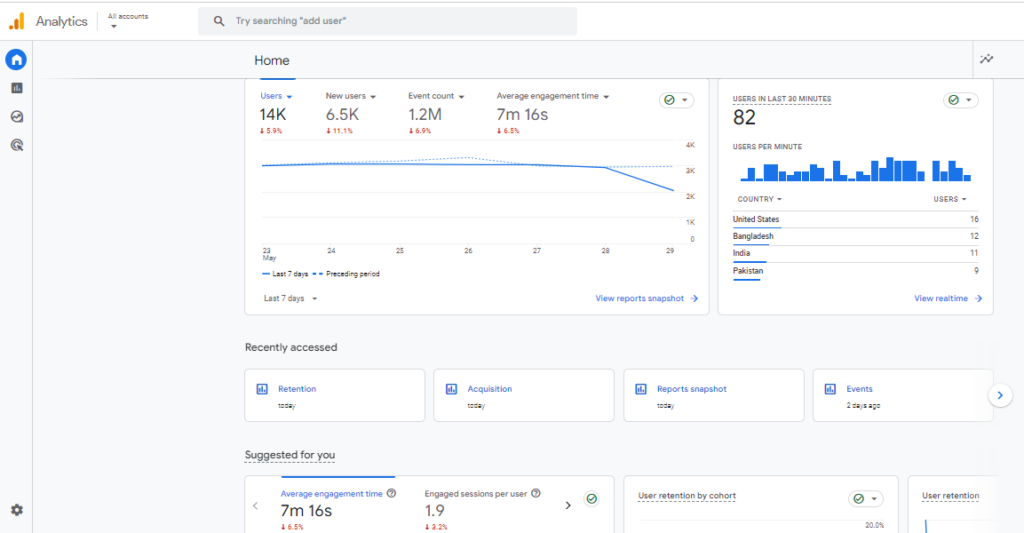
The dashboard tracks traffic and gives real-time insight into audience, behavior, and acquisition. It measures engagement, tracks campaigns, and shows user demographics. It’s customizable and integrates with other Google services. That makes it essential for optimizing performance and marketing.
Understanding GA4 Dashboards
GA4 dashboards are customizable panels of widgets. Each widget shows a data point, like acquisition channels or conversion rates. That way you focus on the metrics that matter to your business.
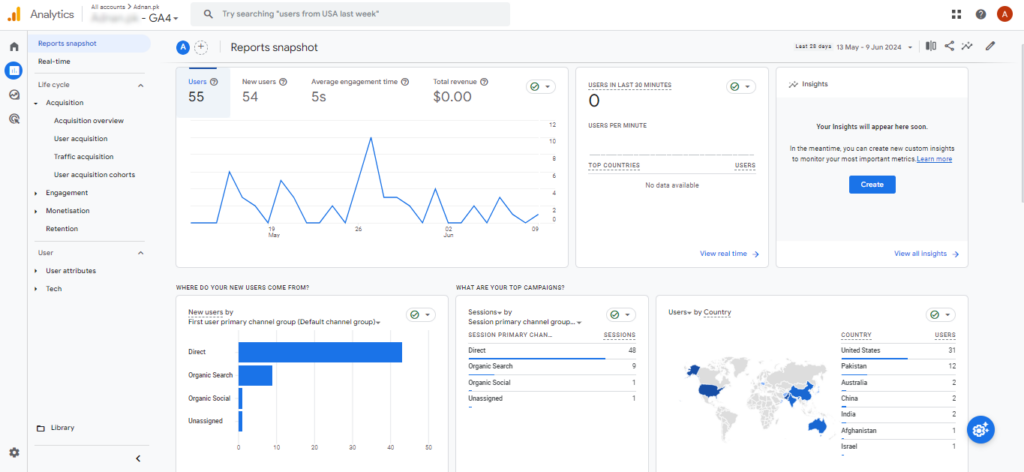
Here’s a simple breakdown of what makes GA4 dashboards unique:
- Customizable Widgets: You can tailor your dashboard with widgets that display the data you care about.
- Real-Time Data: You can get up-to-the-minute insights into how users interact with your site or app.
- User-Friendly Interface: Intuitive design makes it easy to create and adjust dashboards.
Google Analytics dashboards help you make sense of complex data. Clear insights drive better decisions. Whether you’re tracking engagement, campaigns, or sales, GA4 dashboards have you covered.
Advantages of Using a Google Analytics 4 Dashboard
Using Google Analytics 4 Dashboards offers numerous advantages, significantly enhancing your data analysis capabilities. Here are some key benefits:
Enhanced Data Visualization
GA4 dashboards provide an intuitive way to visualize data. That makes it easier to identify trends and patterns. You can quickly spot areas that need attention and make data-driven decisions.
Customization
One of the biggest advantages of GA4 dashboards is how customizable they are. Use a template for quick setup, or build a custom dashboard from scratch. Either way, you get flexibility.
Real-Time Reporting
With Google Analytics 4 Dashboards, you get real-time data updates. It means you can monitor user behavior and respond promptly to changes or trends.
Integration with Other Tools
GA4 dashboards integrate with other Google products and third-party tools. That lets you pull data from multiple sources into one complete view.
Easy Sharing and Collaboration
Sharing insights with your team is straightforward. You can export and share dashboards easily, for better collaboration and decisions.
Here’s a quick list of these advantages:
| Advantage | Description |
| Enhanced Data Visualization | Intuitive visualization to identify trends and patterns |
| Customization | Ability to tailor dashboards to specific needs |
| Real-Time Reporting | Real-time data updates for timely decision-making |
| Integration with Other Tools | Seamless integration with Google products and third-party tools |
| Easy Sharing and Collaboration | Simplified sharing for better teamwork and insights |
GA4 dashboards streamline your data analysis, making it faster and more effective. That leads to better strategic decisions and business outcomes.
Learn how to properly set up GA4 referral exclusion. It stops payment gateways and third-party services from skewing your analytics data.
Important Metrics to Track in GA4 Dashboard
To get the most from your GA4 dashboards, focus on the right metrics. Each one shows a different part of your performance. Here are the key metrics to know:
User Metrics
User metrics help you understand who your visitors are and how they interact with your site. Key user metrics include:
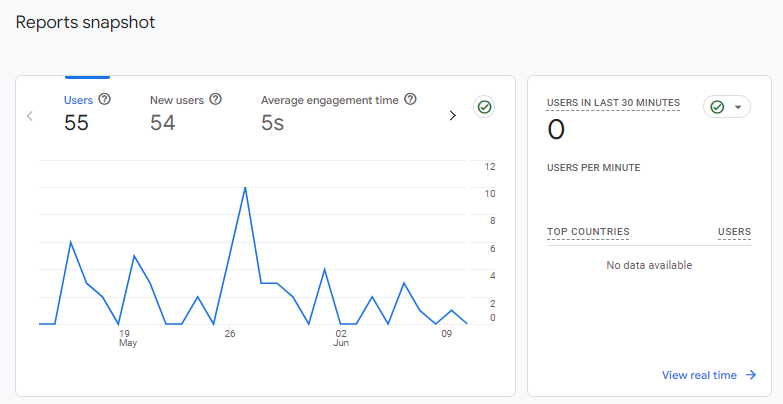
- Active Users: The number of users who have interacted with your site or app within a specific timeframe.
- New Users: The count of first-time users during a selected period.
- Returning Users: Users who have visited your site previously.
Acquisition Metrics
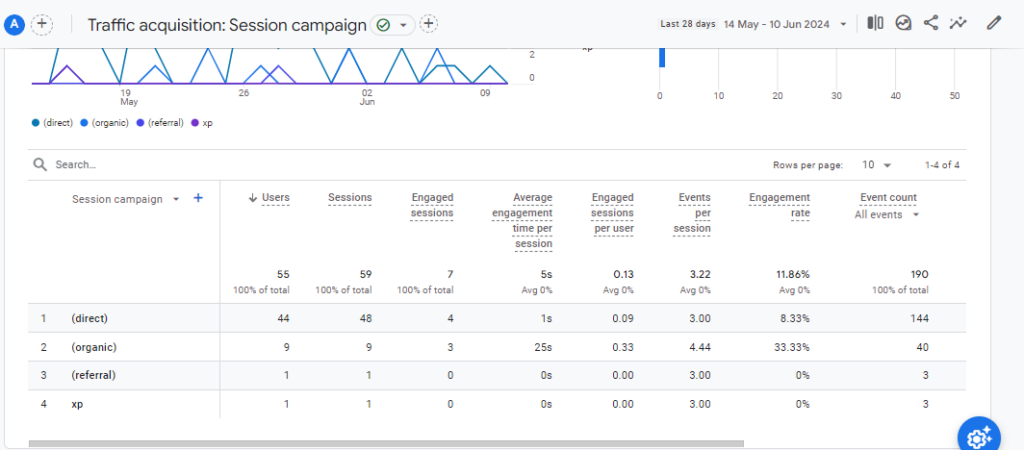
These metrics show how visitors find your site. They can help you determine which marketing channels are most effective. Important acquisition metrics include:
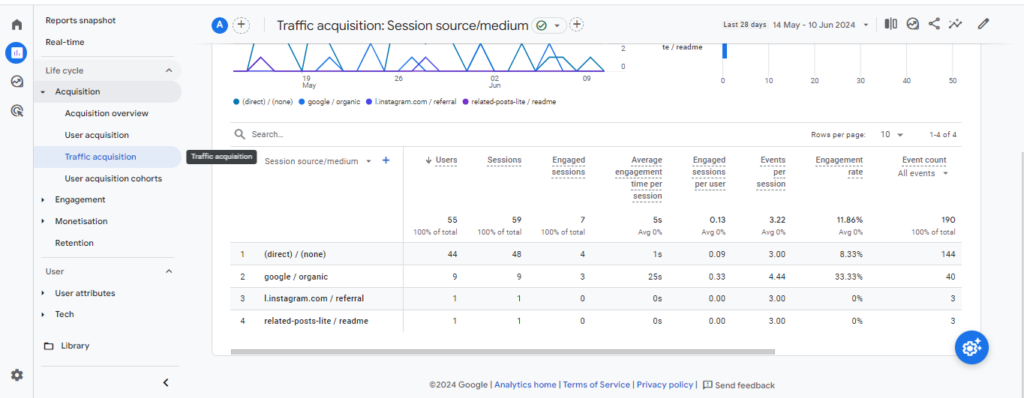
- Campaign Performance: Metrics related to specific marketing campaigns.
Behavior Metrics
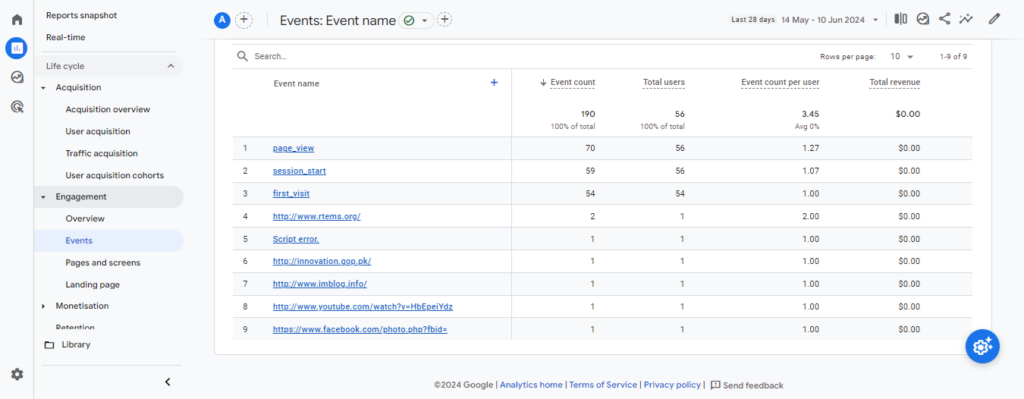
Behavior metrics provide insights into how users interact with your content. Key behavior metrics are:
- Pageviews: Total number of pages viewed.
- Events: Specific interactions on your site, such as clicks, video plays, or downloads.
- Average Session Duration: The average length of a user’s visit.
Conversion Metrics
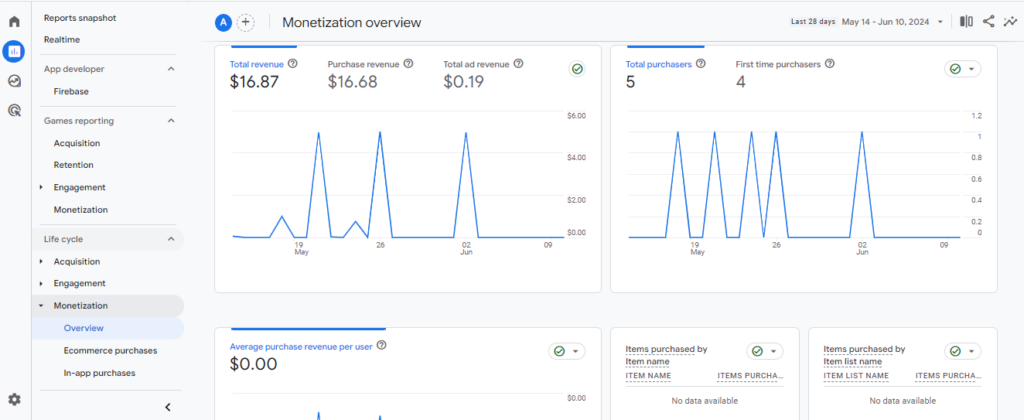
Conversion metrics track how well your site meets its goals, such as sales or sign-ups. Essential conversion metrics include:
- Ecommerce Transactions: Total sales generated by your site.
- Conversion Rate: The percentage of visits that result in goal completions (e.g. a purchase or a file download).
- E-commerce Overview: Total Revenue, number of transactions, average order value and conversion rate.
Read about 10 important metrics you can track in GA4.
Here’s a table summarizing these metrics:
| Category | Metric | Description |
| User Metrics | Active Users | Number of users interacting with your site/app |
| New Users | Count of first-time users | |
| Returning Users | Users who have visited before | |
| Acquisition Metrics | Traffic Source/Medium | Origin of traffic (e.g., organic, direct, referral, paid) |
| Campaign Performance | Metrics related to marketing campaigns | |
| Behavior Metrics | Pageviews | Total number of pages viewed |
| Events | Specific interactions (clicks, plays, downloads) | |
| Average Session Duration | Average time of user visits | |
| Conversion Metrics | Goal Completions | Number of goal completions |
| Ecommerce Transactions | Total sales generated | |
| Conversion Rate | Percentage of visits resulting in goal completions |
For a more detailed look, explore our in-depth guide on important Google Analytics metrics. Then learn how to enable IP anonymization in GA4 to keep personal user data protected.
By focusing on these metrics, your Google Analytics custom dashboard delivers valuable insights. Use them to optimize your strategies and improve performance.
How to Create GA4 Dashboards (4 Ways)
Creating GA4 dashboards is straightforward once you know the methods. Here are four effective ways to build your own.
Google Analytics 4 Custom Dashboards
One easy way to build a custom dashboard: GA4’s built-in Customize Report option. It tailors your dashboard to the metrics that matter to your business.
1. Log in to Google Analytics 4
First, log in to your Google Analytics 4 account. Navigate to the property you want to work with.
2. Access the Reports Section
Click the “Reports” section on the left-hand menu. This is where you can view and customize your reports and dashboards.
3. Customize Your Report
In the Reports section, open a report and click “Customize Report.”
For example, go to Acquisition >> User Acquisition and customize it.
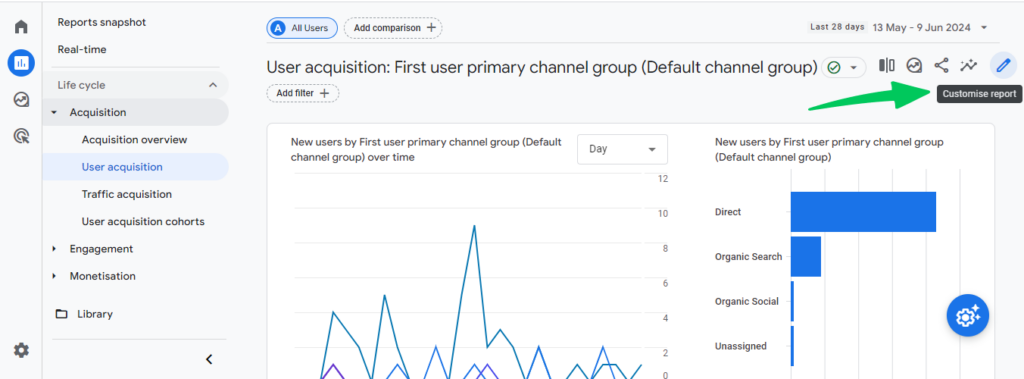
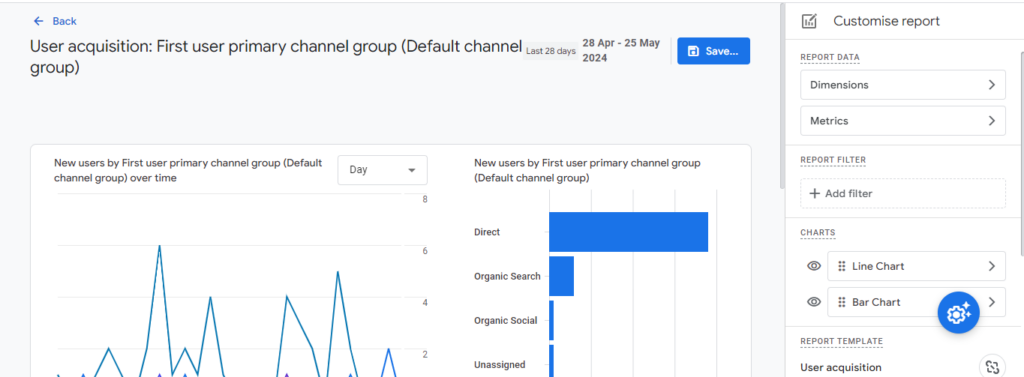
You’ll see options to add various widgets and metrics.
4. Add Widgets
Select the metrics and dimensions for your dashboard. Choose from options like user, acquisition, and conversion metrics.
5. Arrange and Save
Arrange the widgets and save your custom dashboard by clicking Apply.
Follow these steps and you’ll have a GA4 dashboard showing every critical metric. That’s everything you need to monitor your site or app’s performance.
6. Enhance Your Dashboard with Cards
- Choose Relevant Cards: Cards are visual elements like charts and graphs that display data.
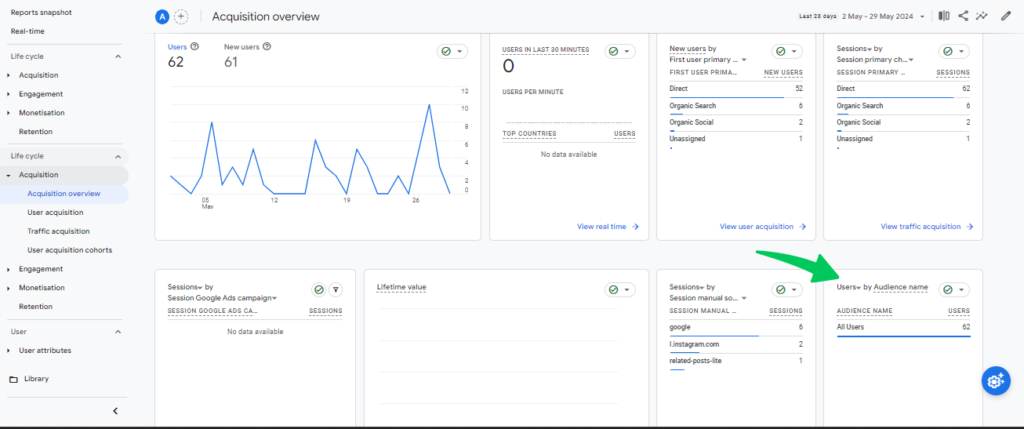
Add or remove cards from any specific dashboard. For example, open Acquisition >> Overview and click the pen icon to edit.
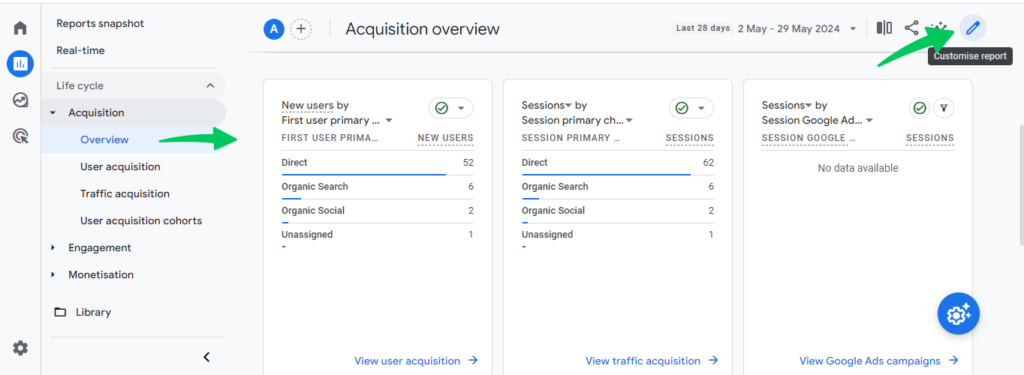
- Customize Your Cards:
A drop-down menu of all the cards will appear, allowing you to customize them.
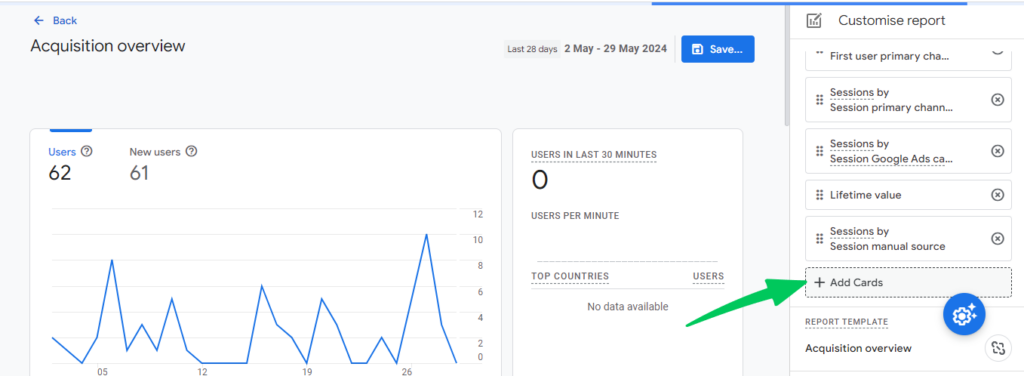
- Add and Remove Cards: You can easily add new cards by clicking “+ Add Cards” and remove unwanted ones by clicking the “x” next to each card.
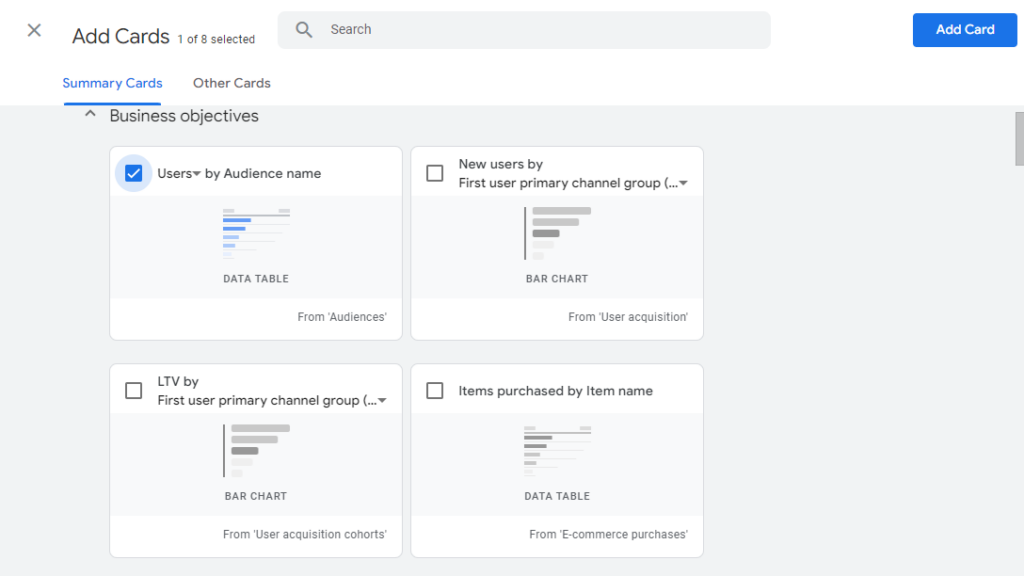
Browse both “Summary Cards” and “Other Cards” tabs. Pick the metrics that suit your needs.
Let’s suppose you add Users by Audience name card. It’ll display in the dashboard where you added it. See the screenshot below:
Install Analytify on WordPress
Another efficient way to create GA4 dashboards is with Analytify. It simplifies Google Analytics setup inside WordPress. It has a user-friendly interface and powerful features.
Here’s each step expanded, with screenshots from the Analytify dashboard:
1. Install the Analytify Plugin
- Navigate to your WordPress dashboard.
- Go to Plugins >> Add New.
- Search for Analytify and click Install Now.
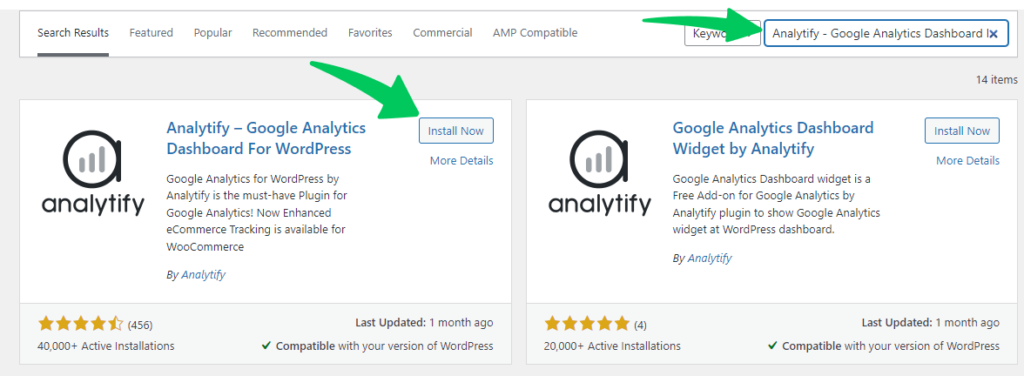
- Once installed, click Activate.
- Read How to Install and Activate Analytify.
2. Configure Settings
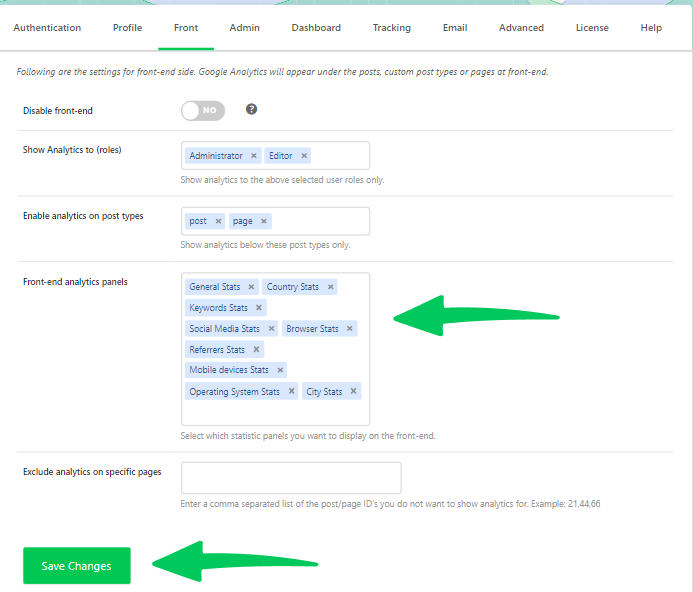
- Go to “Analytify” in your WordPress dashboard menu.
- Under Settings >> Admin configure various options, such as which user roles can access the analytics data.
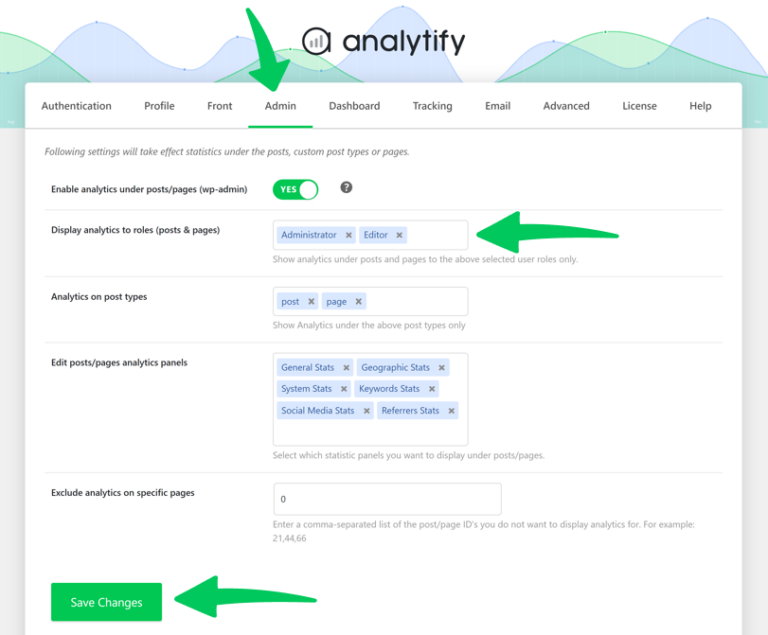
You can decide which specific metrics you want to track.
3. Create Custom Dashboards
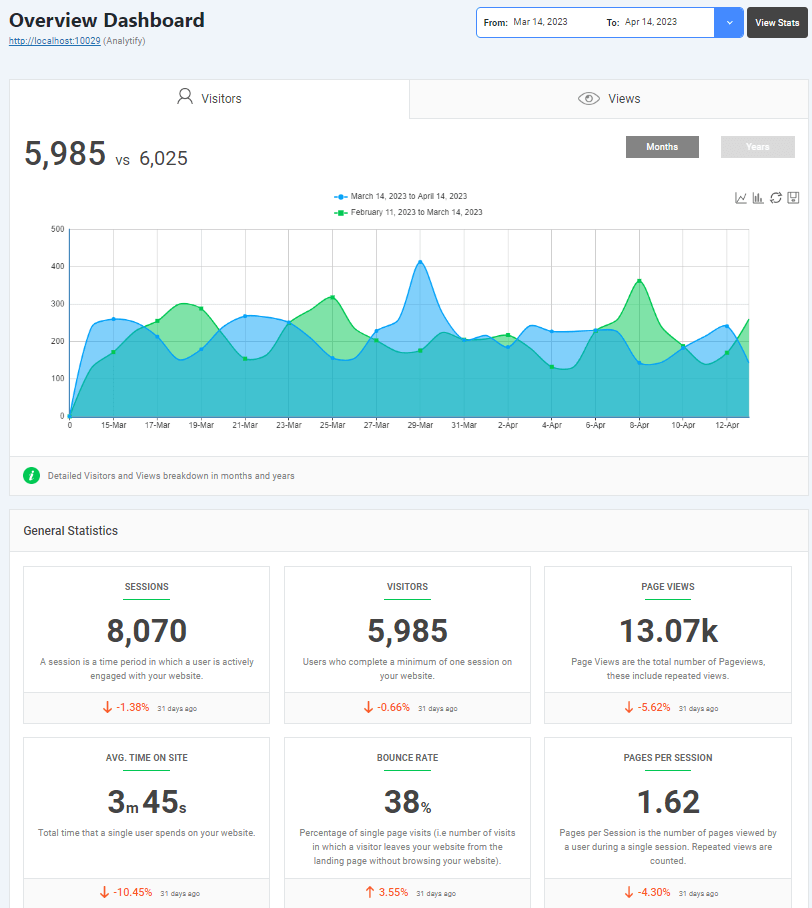
- Navigate to Analytify >> Dashboard.
- Here, you can customize your dashboards by selecting date ranges.
Advantages of Using Analytify
- Ease of Use: Analytify simplifies the process of adding Google Analytics to your WordPress site, making it accessible even for those with minimal technical expertise.
- Comprehensive Data: Get detailed insights directly from your WordPress dashboard, eliminating the need to log into Google Analytics separately.
- Customization: Tailor your dashboards to focus on the metrics that matter most to your business.
With Analytify, you build powerful Google Analytics custom dashboards. They give deep insight into your site’s performance. It all happens inside your familiar WordPress dashboard.
Skip the Manual Setup
Every metric in this guide already shows up inside your WordPress dashboard. That includes traffic, acquisition, behavior, and conversion data. It appears the moment you activate Analytify. No GA4 property navigation, no custom report building, no code.
Creating Dashboards in Looker Studio
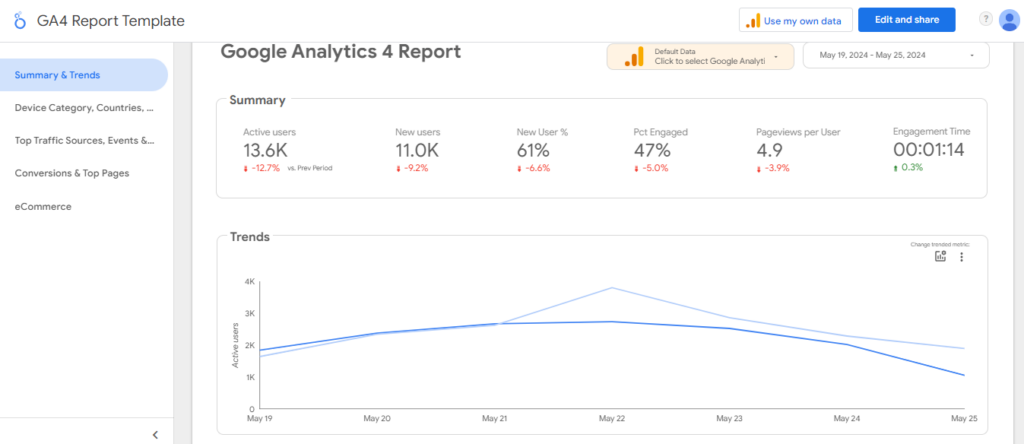
Looker Studio, formerly Google Data Studio, builds detailed, visually appealing GA4 dashboards. It connects directly to Google Analytics 4 and other data sources in one platform.
1. Log in to Looker Studio
- Go to Looker Studio and log in with your Google account.
2. Connect to Google Analytics 4
- Click on “Add Data” and select “Google Analytics.”
- Choose the GA4 property you want to connect to and click “Add.”
3. Share and Collaborate
- Click “Share” to invite team members or clients to view or edit the dashboard.
- Set permissions to control who can view or edit the report.
Integration: How Looker Studio Integrates with GA4
Looker Studio integrates directly with Google Analytics 4, pulling data straight from your property. That lets you combine data from multiple sources into one view. Here’s how it works:
- Direct Connection: Looker Studio connects directly to your GA4 property, ensuring real-time data synchronization.
- Custom Metrics and Dimensions: Looker Studio allows you to create custom metrics and dimensions, which can enhance your ability to analyze specific aspects of your data.
- Blending Data: Combine data from GA4 with other sources, such as Google Ads, Search Console, and more, to get a complete picture of your marketing efforts.
Benefits of Using Looker Studio
- Visual Appeal: Looker Studio provides a wide range of visualization options to create attractive and informative dashboards.
- Flexibility: The ability to connect to multiple data sources and customize every aspect of your dashboard.
- Collaboration: Easy sharing and collaboration features to work with team members and stakeholders.
Looker Studio lets you build powerful Google Analytics custom dashboards with deep insights, for better decisions.
Google BigQuery for Advanced Data Analysis
Google BigQuery is a data warehouse built for advanced analysis on large datasets. Link it to Google Analytics 4 to run complex queries on huge datasets. Then build detailed GA4 dashboards from the results.
1. Set Up a Google Cloud Project
- Go to the Google Cloud Console.
- Create a new project or select an existing one.
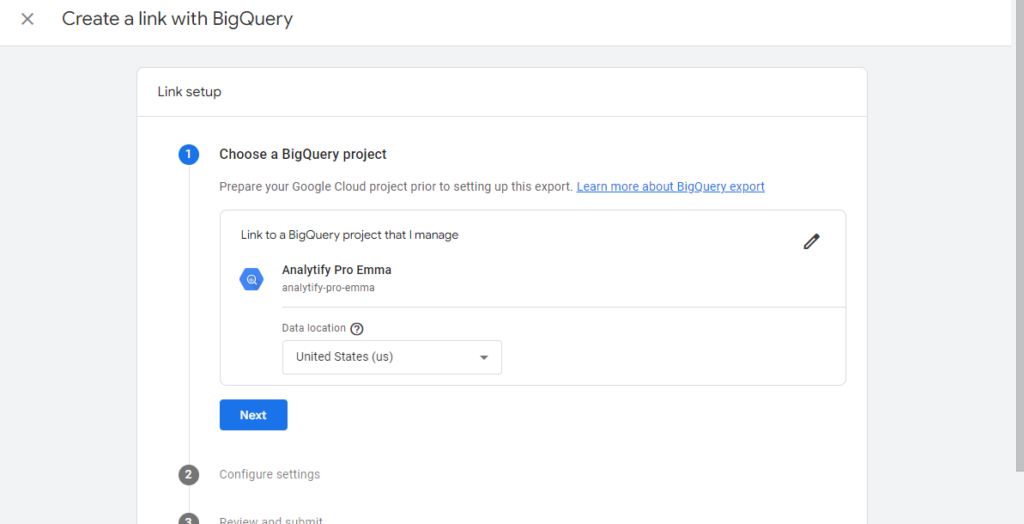
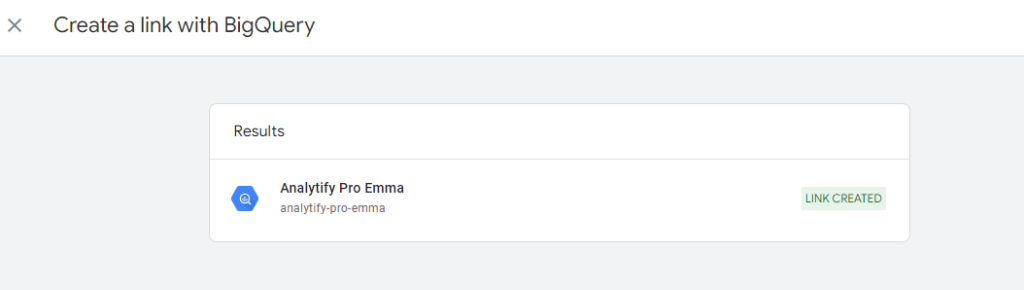
2. Link Google Analytics 4 to BigQuery
- In your Google Analytics 4 property, go to Admin >> Products >> BigQuery Linking.
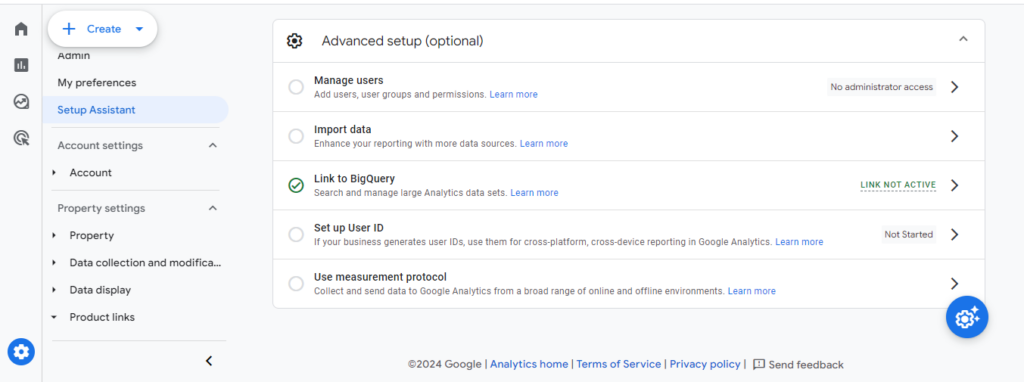
- Click “Link” and follow the prompts to link your GA4 property to BigQuery.
3. Export GA4 Data to BigQuery
- Configure the export settings to automatically send your GA4 data to BigQuery. This can include user interactions, events, and other analytics data.
4. Visualize Data in BigQuery Dashboards
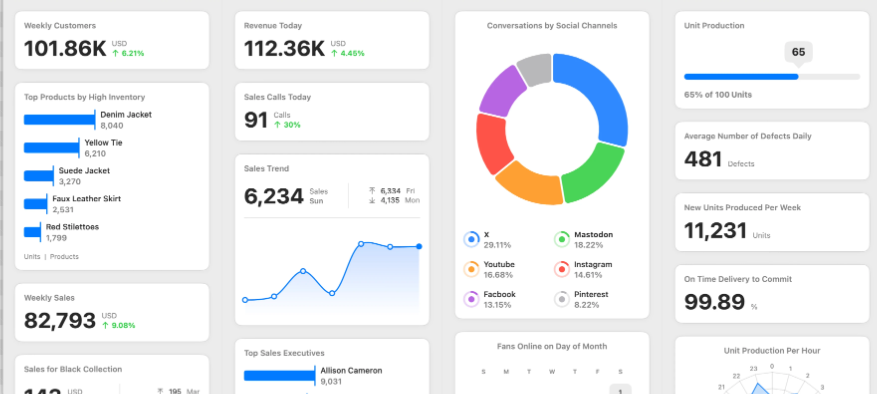
- Use BigQuery’s integration with Looker Studio or other BI tools to create visual dashboards based on your query results.
- Connect BigQuery as a data source in Looker Studio and design your dashboard using the queried data.
Advantages: Why BigQuery is a Powerful Tool for Large Datasets
- Scalability: BigQuery can handle large datasets efficiently, making it ideal for big data analytics.
- Speed: BigQuery can run complex queries in seconds with its high-speed processing capabilities.
- Integration: Seamlessly integrates with Google Analytics 4 and other Google Cloud services.
- Cost-Efficiency: Pay only for the data you query, making it a cost-effective solution for data analysis.
- Advanced Analytics: Supports advanced analytics and machine learning models, providing deeper insights into your data.
- Custom Queries: Write custom SQL queries to extract specific insights.
- Integration with BI Tools: Easily connect to BI tools like Looker Studio for advanced visualization.
- Real-Time Data Processing: Analyze data in real-time for timely insights.
BigQuery builds highly detailed Google Analytics custom dashboards with deep analytical power. That makes it essential for any data-driven organization.
Common GA4 Dashboard Setup Issues
A GA4 dashboard usually shows blank or incomplete data because of a setup problem, not a bug. Here are the most common causes and how to fix each one.
| Symptom | Likely Cause | Fix |
|---|---|---|
| Dashboard shows no data at all | Wrong GA4 property selected, or you are still viewing an old Universal Analytics (UA) property | Confirm the property switcher at the top of GA4 shows your GA4 property, not a UA property |
| A specific card or metric stays at zero | The GTM tag for that event was never published, or its trigger conditions never fire | Open GTM, check the tag fired in Preview mode, and confirm the container is published, not just saved |
| Looker Studio dashboard says “No data” | The connected data source points to the wrong GA4 property, or the account lacks Viewer access | Edit the data source in Looker Studio and reselect the correct GA4 property and account |
| BigQuery export tables are empty | The GA4-to-BigQuery link was created but the first export has not run yet | Wait 24 to 48 hours after linking; BigQuery exports do not backfill historical data |
| Analytify dashboard shows different numbers than GA4 | Analytify and GA4 are set to different date ranges or time zones | Match the date range in both tools and confirm your WordPress site timezone matches your GA4 property timezone |
GA4 Dashboards FAQ
What are GA4 dashboards?
GA4 dashboards are customizable visual panels in Google Analytics 4. They display widgets for the data points you choose. Use them to track and analyze key metrics for your website or app.
How do I create a custom dashboard in GA4?
Creating a custom GA4 dashboard involves using the customize reports option within GA4. You can add various widgets, select specific metrics and dimensions, and arrange them to fit your needs. For detailed steps, refer to our Google Analytics 4 Custom Dashboards section.
What metrics should I track in my GA4 dashboard?
The metrics you should track depend on your business goals. Common ones include engagement metrics like active and new users. Track acquisition metrics like traffic source and campaign performance. Add behavior metrics like pageviews and events. Include conversion metrics like goal completions and ecommerce transactions. Check our section on Important Metrics for your GA4 Dashboard for more details.
Can I integrate GA4 dashboards with other tools?
Yes, GA4 dashboards can be integrated with various tools. You can use Looker Studio for advanced visualizations. Analytify adds WordPress integration. Google BigQuery handles large-scale data analysis. Each tool brings unique features to your analytics.
How often should I update my GA4 dashboards?
Update your GA4 dashboards daily, weekly, or monthly, based on your needs. Regular updates keep the data accurate and relevant. They also help you spot trends and make timely decisions.
Are GA4 dashboards free to use?
Yes, creating and using GA4 dashboards is free within Google Analytics 4. However, some advanced features or integrations, such as using BigQuery, may incur additional costs based on usage.
Can I create a GA4 dashboard without touching Google Analytics directly?
Yes. Analytify shows your GA4 traffic, acquisition, and conversion data inside WordPress automatically after activation. You never need to log into Google Analytics to check your numbers.
Which GA4 dashboard method is best for beginners?
Analytify is the simplest option for WordPress users since it requires no manual report building. For non-WordPress sites, GA4’s built-in Customize Report option is the most direct native method.
Why is my GA4 dashboard showing no data?
Your GA4 dashboard usually shows no data because of a property mismatch. Check the property switcher first, since that alone accounts for most blank dashboards. Other causes include an old Universal Analytics property still selected. A GTM tag saved but never published can also block data. A Looker Studio data source pointed at the wrong GA4 property causes the same issue.
Final Thoughts
GA4 dashboards are vital for any data-driven business. They give you customizable, real-time insight into behavior, marketing, and conversions. Connect them to Looker Studio or BigQuery for even more power.
We’ve covered the essentials of GA4 dashboards. From the basics, to building your own with every method.
You may also like to read our Detailed Guide on Important Google Analytics Metrics. It covers the GA4 dashboard in more depth.
What’s your experience with the Google Analytics dashboard been like? Any tips to share? We’d love to hear your thoughts in the comments below!