Top 5 Content Marketing Analytics Reports in GA4 (2026)
Are you making the most of content marketing analytics to boost your strategy in 2026?
Understanding how your content performs is essential for driving engagement, conversions, and ROI. Content marketing analytics helps you collect, measure, and interpret data from your blogs, videos, social media posts, and email campaigns, showing what resonates with your audience and what drives results.
In this guide, we’ll explore the best Google Analytics reports for content marketing, including Traffic Acquisition, Engagement Overview, Pages and Screens, Conversions, and User Explorer reports.
Let’s get started!
Content Marketing Analytics (TOC)
What is Content Marketing Analytics?
Content marketing analytics is the process of collecting, measuring, analyzing, and interpreting data from your content marketing efforts to understand how well they are achieving your business goals.
It involves tracking content marketing metrics such as website traffic, engagement, conversions, and audience behavior to evaluate the effectiveness of various content formats, including blog posts, videos, social media posts, and email campaigns.
Using content marketing analytics reports, you can identify high-performing content, measure its impact, and spot opportunities to optimize your strategy for better results.
Content marketing analytics tools like Google Analytics and Analytify help you understand what your audience enjoys, how they interact with your content, and which pieces perform best. These insights make reporting on content marketing success easier and more valuable, so you can refine your strategy and improve your ROI.
Why Content Marketing Analytics is Important?
Content marketing analytics is important because it shows you what’s working and what’s not in your content strategy. Here’s why it matters:
- Shows what your audience likes: Helps you identify the topics, formats, and styles your audience enjoys the most.
- Reveals what drives traffic and conversions: Tells you which content brings visitors and turns them into customers or subscribers.
- Improves your content strategy: Guides you on what to create, update, or promote for better results.
- Saves time and money: Focuses your efforts on content that delivers results instead of wasting resources.
- Tracks performance across channels: Lets you compare how your content performs on your website, social media, and other platforms.
- Measures ROI: Shows if your content is worth the time, money, and effort invested.
- Supports business goals: Ensures your content aligns with sales, brand awareness, or customer engagement targets.
5 Content Marketing Analytics Reports
To truly understand your content performance, Google Analytics for content marketing offers several reports that provide in-depth insights. Below are five essential reports we should track:
1. Traffic Acquisition Report
In GA4, the Traffic Acquisition Report is a key tool for understanding how people discover your content. You can find this Google Analytics content marketing report under Reports >> Acquisition>> Traffic acquisition.
It shows traffic sources such as organic search, paid ads, social media, direct visits, and referrals, helping you connect marketing efforts to measurable outcomes. For instance, strong organic search traffic may signal the need to boost SEO, while high social engagement might encourage more investment in that platform.
Key metrics to track include:
- Sessions: Total number of visits from each traffic source or channel.
- Users: Unique visitors coming from each source.
- New Users: First-time visitors from a specific channel.
- Engagement Rate: Percentage of sessions with meaningful interaction.
- Average Engagement Time: Average time visitors from each source spend actively engaging with your content.
- Conversions / Key Event: Number of completed goals or necessary actions from each source.
- Event Count: Total number of tracked actions taken by users from each traffic channel.
- Bounce Rate (if configured): Percentage of visitors who leave after viewing only one page.
Its most significant strength is the strategic insight it provides, showing which channels and content formats (blogs, videos, infographics) deliver the most value. This makes it an essential part of your content marketing analytics reports, helping you refine strategies, improve ROI, and reach the right audience.
2. Engagement Overview Report
The Engagement Overview Report in GA4 is a key part of content marketing analytics, showing exactly how users interact with your content once they arrive.
While traffic reports explain where visitors come from, this report focuses on what they do once they arrive, helping you measure the quality of their interactions. You can access it in GA4 by navigating to Reports>> Engagement >> Overview.
It highlights user activity, session engagement, and event performance across your site. This makes it easy to see which content keeps visitors interested and which may need improvement. For example, if a blog post has a high engagement rate and a longer average engagement time, it’s likely resonating well with your audience.
Key engagement metrics include:
- Engaged Sessions: Number of sessions where a user interacted meaningfully (lasted at least 10 seconds, had a conversion, or viewed multiple pages/screens).
- Engagement Rate: Percentage of total sessions that were engaged sessions.
- Average Engagement Time: Average time users actively spend on your site or app.
- Events: Total number of actions (e.g., clicks, video plays, file downloads) taken by users.
- Event Count per User: Average number of events triggered by each user.
- Conversions: Number of completed goals or necessary actions defined in GA4.
- Views per User: Average number of pages or screens viewed by each user.
The actual value of this report lies in showing what content captures and holds attention, helping you refine formats and topics for better performance.
As a content marketing analytics report, the Engagement Overview Report is essential for improving user experience, boosting retention, and increasing the impact of your content strategy.
3. Pages and Screens Report
The Pages and Screens Report in GA4 is an important part of content marketing analytics, giving you a closer look at how individual pages on your website or screens in your app perform. While traffic and engagement reports show how visitors arrive and interact, this report focuses on which specific content pieces attract the most attention and keep users interested.
To access the Pages and Screens report in GA4, go to Reports, then navigate to Engagement >> Pages and Screens.
It shows performance data for every page or screen, helping you find your top-performing content and identify areas that may need improvement. For example, if a landing page gets a lot of views but has a low average engagement time, it might need better content or a clearer call to action.
Key metrics include:
- Views: The number of times a page or screen was viewed.
- Users: How many unique visitors viewed the page or screen.
- New Users: The number of first-time visitors for that page or screen.
- Views per User: Average number of views per visitor.
- Average Engagement Time: The average time users actively spent on the page or screen.
- Event Count: The total number of tracked interactions on the page or screen.
- Conversions: The number of times a key event was completed on the page or screen.
- Revenue: Total revenue generated from that page or screen (for eCommerce or monetized content).
By showing exactly which content drives the most engagement and conversions, the Pages and Screens Report acts as a content marketing analytics report. That helps you refine your content strategy, improve user experiences, and maximize the return on every piece you publish.
4. Events Report
The Conversions Report in GA4 tracks the most valuable actions that users take on your website or app, such as purchases, form submissions, newsletter sign-ups, or downloads. These actions, called key events, reflect how well your content is driving results that matter to your business.
To access it, go to Reports >> Engagement >> Events in your GA4 property.
By analyzing this report, you can see which marketing channels, campaigns, and pages are generating the highest number of conversions, allowing you to focus efforts where they have the most significant impact.
For content marketers, this report is a valuable tool to measure how content encourages users to take action. It highlights high-performing content, areas needing improvement, and points where users drop off before converting, helping you optimize the customer journey and maximize results.
Here are the key metrics for the Events Report in GA4:
- Event Name: Shows which specific key events (conversions) are being tracked, such as form submissions, purchases, or sign-ups.
- Event Count: The total number of times each conversion event occurred.
- Event Value: The monetary value assigned to conversion events, useful for revenue-driven goals.
- User key event Rate: The percentage of users who triggered at least one conversion event during their session.
- Session key event Rate: The percentage of sessions in which a conversion occurred.
- First-Time Purchasers: The number of users who made their first purchase.
- Purchase Revenue: The total revenue generated from purchase-related conversion events.
By checking this report, you can improve your content, strengthen your calls-to-action, and create a better experience for visitors. This way, your marketing not only attracts people but also brings real business results.
5. User Attributes Report
The User Attributes Report in GA4 provides valuable insights for content marketing analytics by helping you understand your audience in detail. It allows you to segment users by attributes such as age, gender, location, interests, and device categories, enabling you to tailor content for different groups.
In GA4, go to Reports >> User >> User Attributes to explore the data and analyze your audience segments for content marketing insights.
You can also gain user behavior insights to see how these segments engage with your content, including which pages they visit and what events they trigger.
This helps with content optimization, as you can identify which age groups, genders, or regions respond best to specific content types or topics and adjust your strategy accordingly.
Additionally, the report enables you to evaluate campaign effectiveness by analyzing how these audience segments react to marketing campaigns, helping you refine messaging for higher engagement, conversions, and overall ROI.
Best Practices for Using Content Marketing Analytics Reports
Here are the best practices for using content marketing analytics reports effectively:
- Set Clear Goals First: Know what you want to achieve with your content, whether it’s more leads, sales, engagement, or brand awareness.
- Track the Right Metrics: Focus on key metrics that truly reflect your goals instead of tracking everything.
- Check Reports Regularly: Review your analytics consistently to spot trends and act quickly on new insights.
- Test and Optimize: Use data to test different content formats, headlines, and CTAs, then improve the most effective elements.
- Understand Audience Behavior: Use reports to learn how visitors interact with your content and what keeps them engaged.
- Adjust Strategy Based on Data: Make informed changes to your content plan rather than relying on guesswork.
Content Marketing Analytics for WordPress Users: Analytify
Join 50,000+ beginners & professionals who use Analytify to simplify their Google Analytics!
If you’re a WordPress user looking to simplify content marketing analytics, Analytify is the perfect choice.
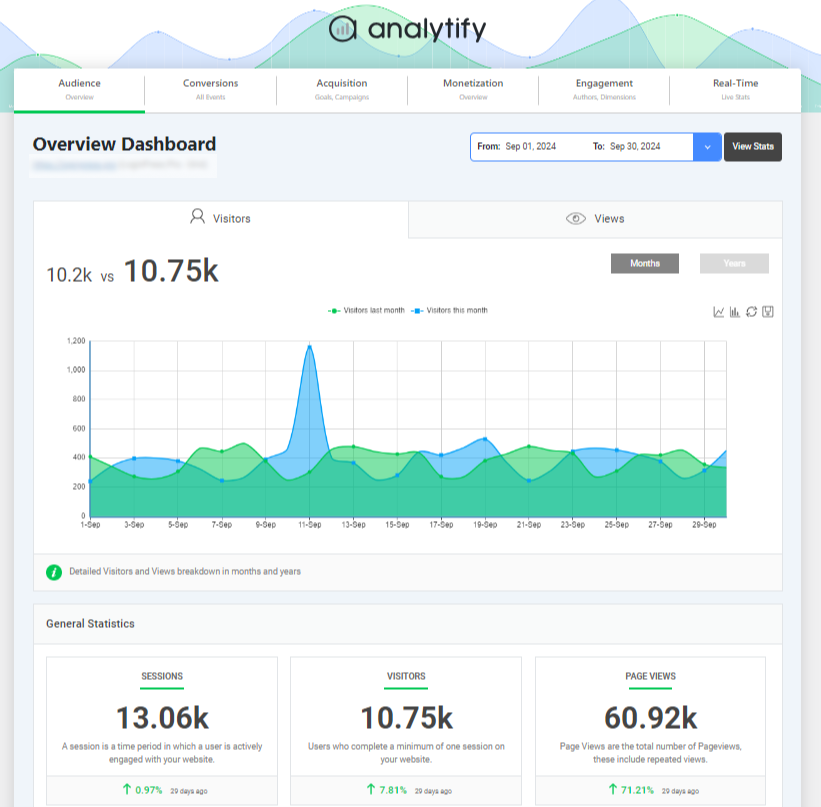
Analytify, as one of the best Google Analytics plugins for WordPress, brings all your analytics data directly into your dashboard with a user-friendly interface, real-time stats, and easy-to-understand reports, eliminating the need to navigate multiple Google Analytics reports.
Whether you’re tracking traffic, engagement, or conversions, Analytify makes it simple to monitor performance and make data-driven decisions.
Key Reports Available in Analytify:
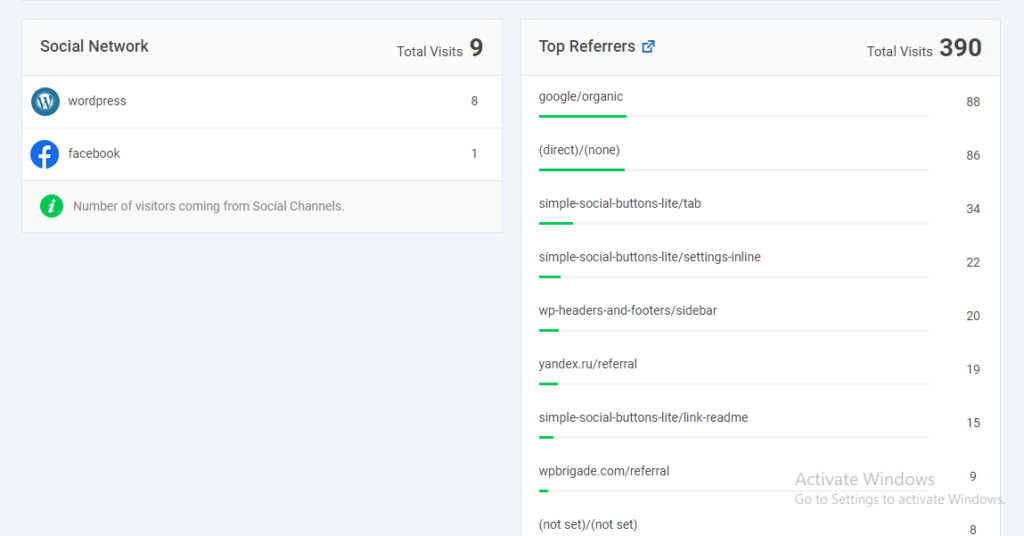
- Traffic Sources Report: See where your visitors are coming from, including organic search, social media, referrals, and paid campaigns.
- Top Landing Pages Report: Identify which pages attract the most traffic and keep users engaged.
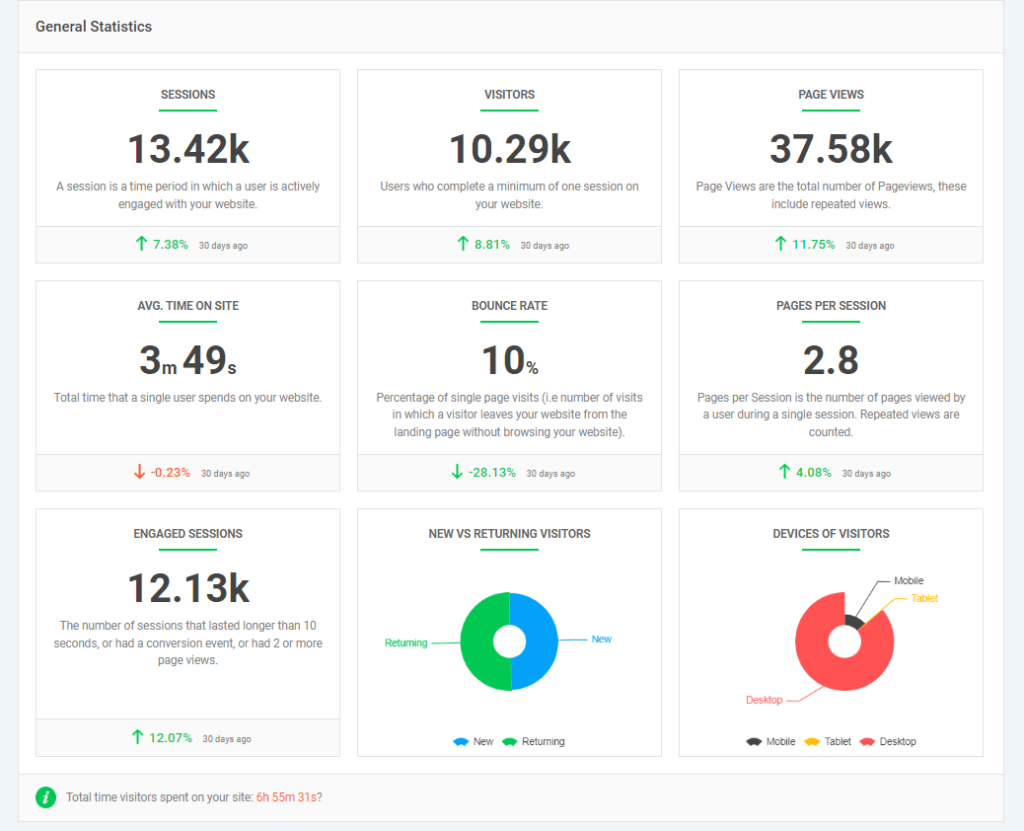
- General Statistics: Monitor sessions, users, new users, engagement rate, and average session duration.
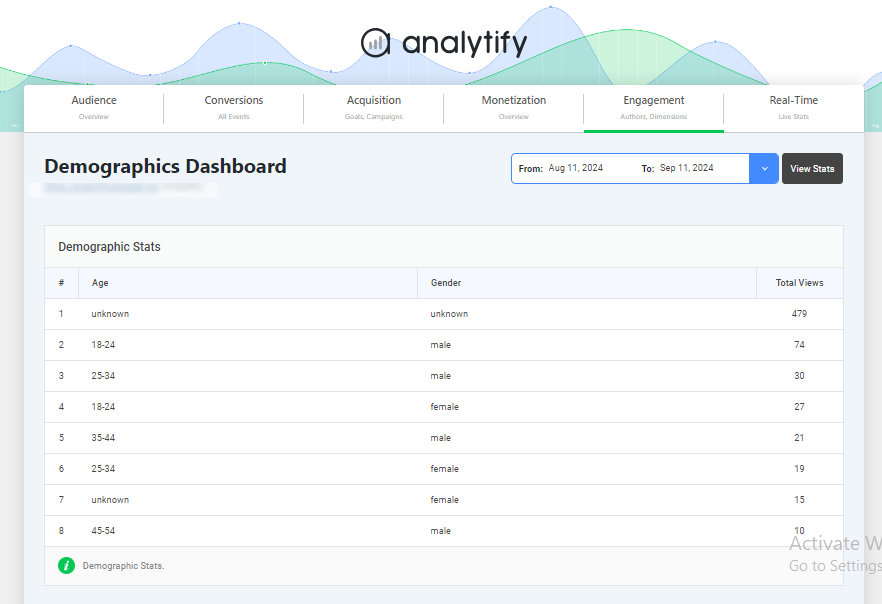
- Demographic Dashboard: Get insights into audience age, gender, interests, and other user attributes.
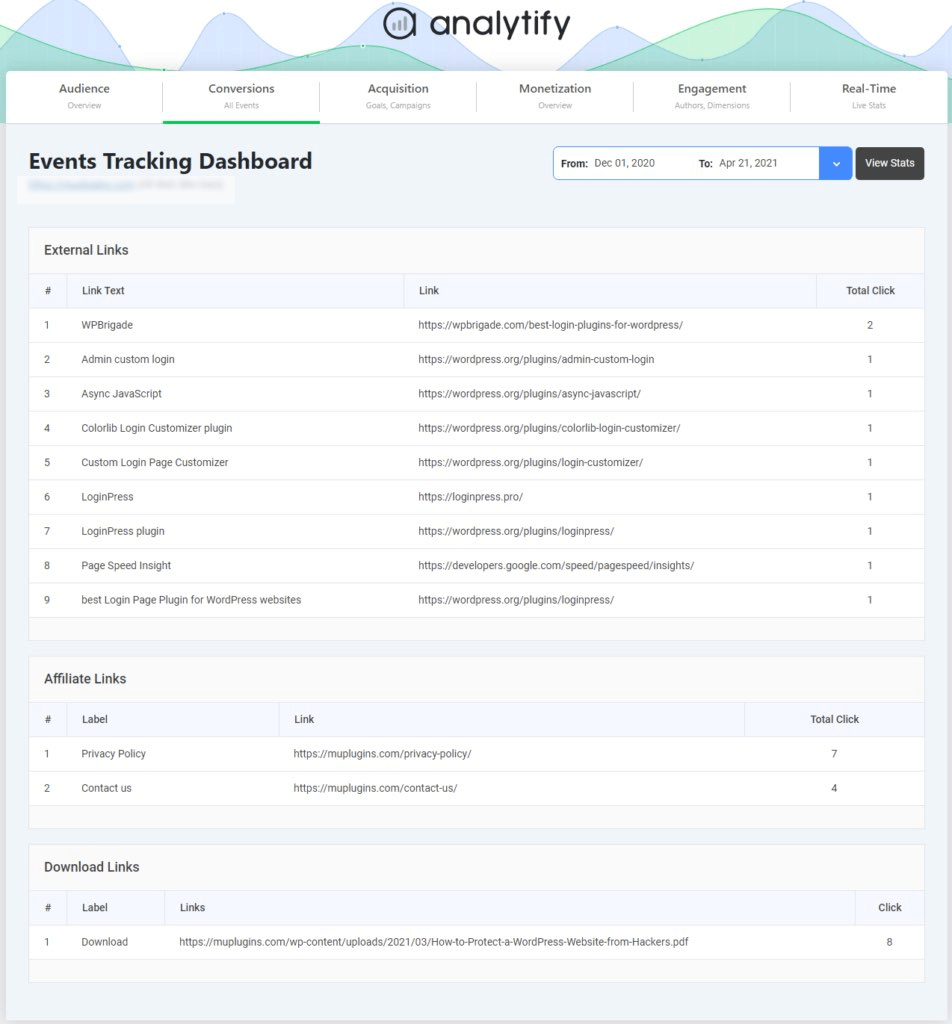
- Event Tracking Add-on: Track interactions like button clicks, downloads, video plays, and form submissions.
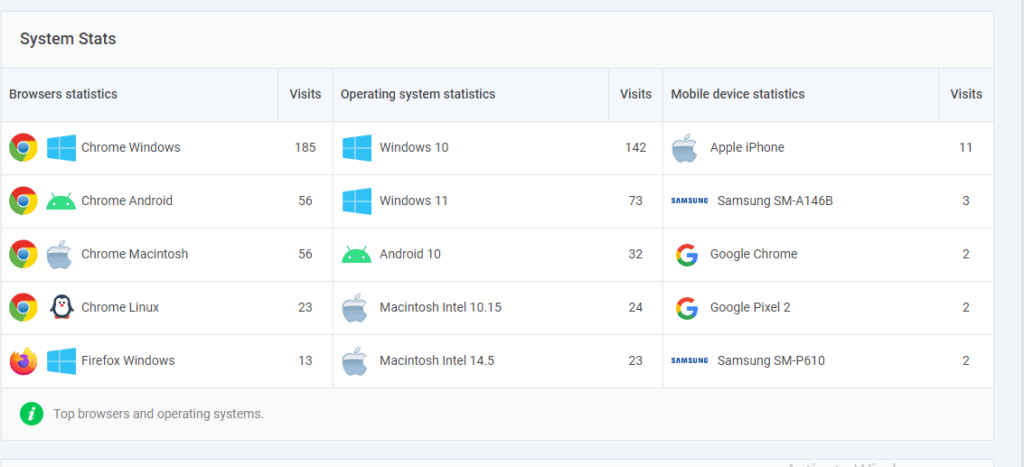
- Device/System Stats Report: Analyze traffic from different devices, browsers, and operating systems.
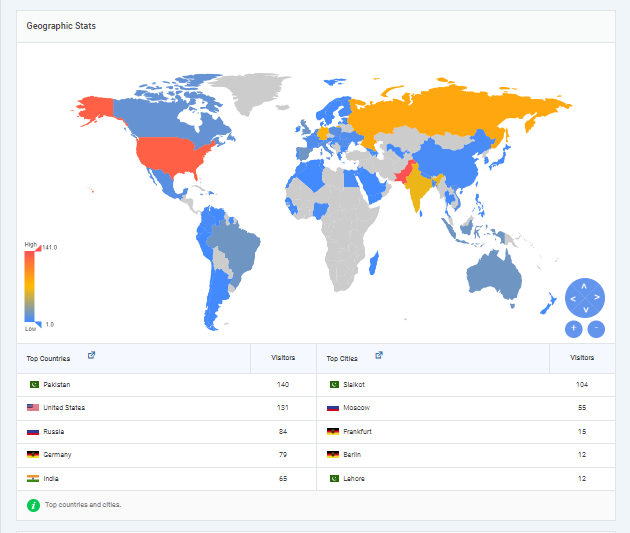
- Geographic Location Report: Understand where your audience is located globally, helping you target content and campaigns effectively.
With Analytify, WordPress users can combine all these reports to get a complete picture of content performance, optimize strategies, and improve engagement and conversions effortlessly.
Frequently Asked Questions About Content Marketing Analytics
1. What are Content Marketing Analytics Reports?
Content Marketing Analytics Reports are tools in platforms like Google Analytics that track and measure the performance of your content. They show key data such as traffic, engagement, conversions, and audience behavior, helping you understand what’s working and what needs improvement.
2. How does content marketing reporting improve strategy?
Content marketing reporting reveals what’s working and what’s not. By reviewing analytics for content marketing success, you can adjust your topics, formats, and distribution channels for better performance.
3. How can I use Google Analytics for content marketing?
You can use Google Analytics for content marketing by monitoring audience demographics, traffic channels, and user behavior. This helps you create targeted content, improve SEO, and increase conversions.
4. How do you report on content marketing success?
Reporting on content marketing success involves tracking key performance indicators (KPIs) like traffic, engagement, leads, and conversions. You can use content marketing analytics reports to present data in a clear and concise format for stakeholders.
5. Which tools are best for content marketing analytics?
6. How often should I check Content Marketing Analytics Reports?
It’s best to review them weekly for performance tracking and monthly for deeper insights, ensuring you can quickly adapt to trends or fix underperforming content.
Final Thoughts: Content Marketing Analytics
This guide explored the best Google Analytics reports for content marketing, showing how they help track traffic, engagement, conversions, and audience behavior.
The Traffic Acquisition Report reveals where your visitors come from, while the Engagement Overview Report highlights how users interact with your content. The Pages and Screens Report identifies top-performing content and areas for improvement.
The Events Report tracks key actions that drive business results. The User Attributes Report provides audience insights, allowing segmentation by age, gender, location, and interests, which supports better content optimization and campaign effectiveness.
For WordPress users, Analytify brings these reports directly into the dashboard, in an easy-to-use interface. By regularly reviewing these reports and applying data-driven strategies, marketers can optimize content, boost engagement, improve conversions, and achieve measurable success.
For further guidance, you can read:
- GA4 User Acquisition vs Traffic Acquisition Report
- How to Track Website Traffic with GA4
- 11 Key Customer Engagement Metrics
Which content marketing report do you rely on most to measure your success? Share your thoughts and experiences in the comments below!


