A Complete Google Analytics Glossary (2026)

Google Analytics is a powerful tool for understanding user behavior and measuring website performance. However, its terminology can be overwhelming for newcomers. This Google Analytics glossary gives clear, concise definitions for key Google Analytics terms.
All essential Google Analytics definitions are here: sessions and pageviews first, then advanced metrics and dimensions. Beginner or seasoned analyst, this GA4 glossary helps you navigate Google Analytics.
Knowing these terms in Google Analytics helps you read your data correctly. It also improves decisions about your website or app’s performance.
New to Google Analytics? Our beginner-friendly guide about learning GA4 covers the basics before you explore advanced terms.
Google Analytics Glossary (TOC):
Join 50,000+ beginners & professionals who use Analytify to simplify their Google Analytics!
Key GA4 Definitions and Terms (A-Z)
Acquisition:
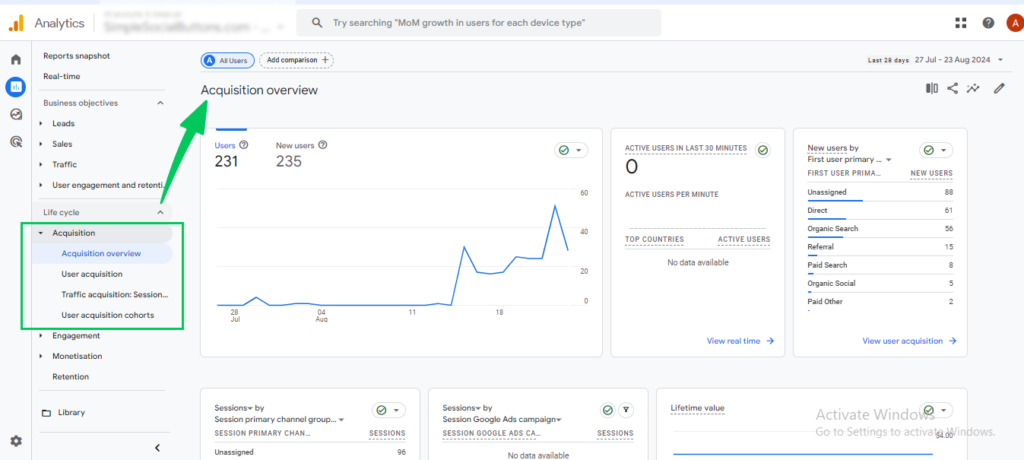
Acquisition means attracting new visitors and tracking how they find you. Sources include search engines, social media, paid ads, referrals, and direct visits. Understanding acquisition helps identify effective traffic channels and informs strategies to boost engagement and conversions.
Active Users:
Active Users are people who interacted with your site in a set period, like a week. The active user metric shows engagement and recurring interest. It also reflects retention and the health of your audience.
Acquisition Reports:
Acquisition Reports explain how visitors arrive. They break traffic down by source: organic search, direct visits, social media, and referrals. These reports show how each marketing channel performs. Use them to optimize your efforts and allocate resources.
Average Engagement Time:
This is the average time users actively interact with your website or app, for example by scrolling or clicking.
Average Engagement Time per Session:
This refers to the average time users interact with your website or app in a single visit (session). It measures how much time users spend interacting with your content each time they visit.
Advertising Features:
These are tools and options in digital platforms that help businesses create, manage, and optimize their ads. They include targeting options, ad formats, and performance tracking to improve the effectiveness of online advertising.
Attribution:
Attribution identifies which marketing actions or channels drive specific outcomes. Channels include ads, emails, and social media. Outcomes include sales and conversions. It helps understand what part of your marketing is working best.
Audience:
In marketing, the audience is the people you are trying to reach with your ads or content. Characteristics like age, location, interests, or behavior define the audience. They help your message reach the right people.
AdWords Linking:
AdWords Linking refers to connecting your Google AdWords (now Google Ads) account with your Google Analytics account. This integration shows performance data from your ad campaigns inside Analytics. You can track conversions, optimize ad spend, and improve campaign results.
Advanced Segments:
Advanced Segments let you isolate specific subsets of your data. You can segment by user behavior, demographics, or traffic source. This gives more detailed views and comparisons. It helps you understand audience segments and tailor your strategy.
Bounce Rate:
Bounce Rate is the percentage of visitors who navigate away from your website after viewing only one page. A high bounce rate can point to weak content, poor user experience, or low relevance. It is a critical metric for site engagement.
Behavior Flow:
Behavior Flow visualizes the paths users take through your website. It starts at the first page they visit and follows each page after. This tool shows user behavior and drop-off points. Use it to optimize the user journey and improve engagement and conversions.
Behavior Reports:
Behavior Reports show how users interact with your content. They include page views, average time on page, bounce rate, and exit pages. These reports help you analyze user engagement, content performance, and areas for improvement to enhance overall user experience.
Campaign:
A campaign is a set of marketing activities aimed at a specific goal, such as brand awareness or sales. Campaigns are tracked across channels like email, social media, and paid ads. Tracking lets you measure effectiveness and improve results.
Campaign Name:
This is the label you give a marketing campaign to identify and track its performance, such as a seasonal sale.
Campaign Tags:
These are keywords or labels that help you categorize and track a campaign. They can mark the traffic source (e.g., email, social media) or the product being promoted.
Channels:
Channels are the pathways visitors use to find your website: organic search, direct visits, social media, referrals, and paid advertising. Analyzing channels helps you understand which sources drive the most traffic and conversions, informing your marketing strategies.
Clicks:
Clicks are interactions where users engage with elements like links or ads on your website. This click metric measures how effective your marketing is. It shows user interest and engagement with your content or ads.
Conversion:
Conversion occurs when a user completes a desired action. Examples: a purchase, a form submission, or a newsletter signup. Tracking conversions helps you measure the success of your marketing efforts and your website’s effectiveness in achieving business goals.
Conversion Rate:
Conversion Rate is the percentage of visitors who complete a desired action out of the total number of visitors. It is calculated by dividing the number of conversions by the total number of visitors and multiplying by 100. A higher conversion rate indicates a more effective marketing and user experience.
Cookies:
Cookies are small text files that a website stores on a user’s device. They track and remember information about the visit. Cookies are used for various purposes, such as personalizing user experience, monitoring user behavior, and managing session data.
Custom Dimensions:
Custom Dimensions are user-defined attributes that let you segment and analyze data beyond the default dimensions. They enable detailed tracking around your own criteria, such as user roles or product categories.
Custom Events:
Custom Events are specific user interactions tracked on your website that do not fall under standard analytics metrics. You can define these events to capture actions like button clicks, video plays, or form submissions. They give deeper insight into user behavior.
Data Studio:
Data Studio is a Google data visualization tool. It lets you build interactive, customizable reports and dashboards. It connects to many data sources, including Google Analytics. It presents data in a clear, visual format that supports analysis and decisions.
Demographics:
Demographics refers to statistical data about the characteristics of your website’s visitors, such as age, gender, location, and language. Understanding demographics helps you tailor your content and marketing strategies to meet your audience’s needs and preferences.
Direct Traffic:
Direct Traffic consists of visitors who type your URL directly into their browser or use bookmarks. This type of traffic indicates a higher level of brand awareness and can include both new and returning visitors.
Domain:
A domain is your website’s unique address on the Internet. It typically consists of a name and a top-level domain (TLD) such as .com, .org, or .net. Your domain name is essential for your online identity and branding.
Data Import:
This is the process of bringing external data into an analytics platform to combine it with existing data. For example, you might import customer data from a CRM to enrich your analytics. This gives a fuller picture of user behavior.
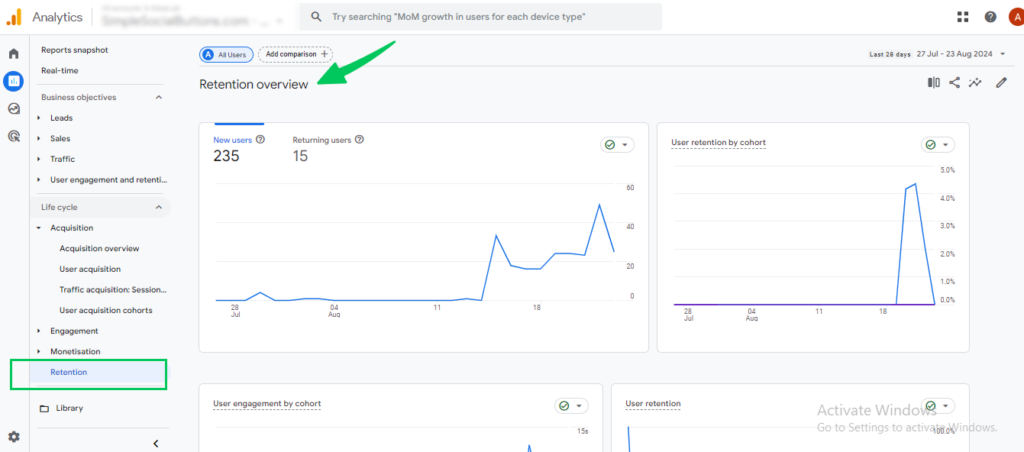
Data Retention:
Data retention refers to how long your analytics platform keeps the collected data before it’s deleted or archived. It determines how far back you can look at historical data to analyze trends and patterns.
Data Stream:
A data stream is a continuous flow of data from a source, like a website, app, or device, into your analytics platform. It allows real-time tracking of user interactions as they happen.
DebugView:
DebugView is an analytics tool that shows real-time data and events from your website or app as they happen. It’s useful for testing and troubleshooting your tracking setup.
Default Channel Group:
Default Channel Group is a predefined way analytics platforms categorize traffic sources, like “Organic Search,” “Social,” or “Direct.” It shows where visitors come from without custom tracking.
Device ID:
A device ID is a unique identifier assigned to a specific device, such as a smartphone or tablet. It tracks user activity across apps and websites on that device. It also helps identify returning users even if they don’t log in.
Dimension:
In analytics, a dimension is a descriptive attribute of data, like “City,” “Browser,” or “Campaign Name.” Dimensions help you categorize data and understand different aspects of user behavior.
E-commerce Tracking:
E-commerce Tracking is a feature in analytics platforms that enables you to monitor and analyze online sales transactions. This tracking shows product performance, sales volume, revenue, and customer behavior. It helps you improve your online store.
Engagement Rate:
Engagement Rate measures users’ interactions with your website or content. It is often the percentage of visitors who click, share, comment, or spend time on the site. High engagement rates indicate a strong interest and connection with your content.
Entry Page:
The Entry Page is the first-page visitors land on when they arrive at your website. Analyzing entry pages shows where users start their journey. It reveals which pages attract the most traffic and why.
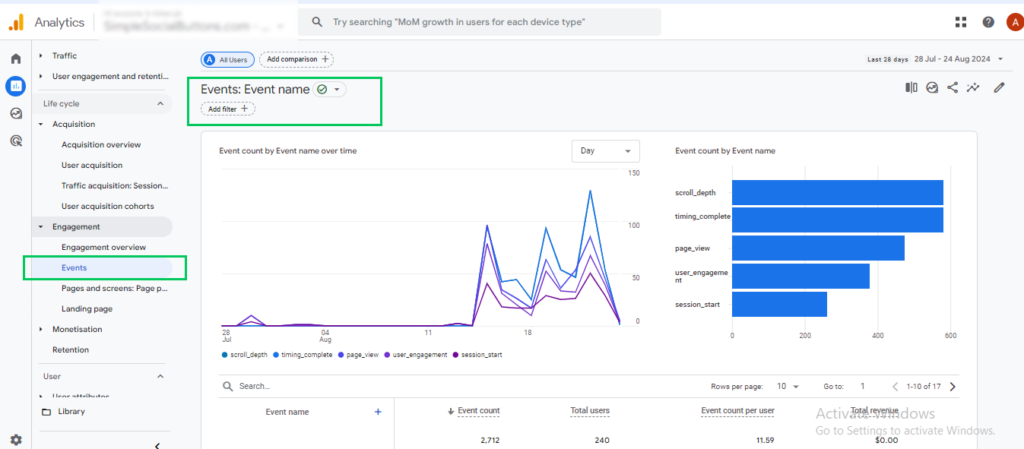
Event:
Event in web analytics is a specific user interaction, such as clicking a button, playing a video, or downloading a file. Events help you track and analyze user behavior beyond simple page views.
Engaged Sessions:
Engaged sessions are sessions where a user actively interacts by clicking, scrolling, or staying on a page (usually over 10 seconds). They indicate active user involvement.
Enhanced Measurement:
This feature automatically tracks user interactions like page views, scrolls, outbound clicks, and site searches. It needs no manual setup. It helps you gather more detailed data effortlessly.
Event Count:
This is the number of times a specific action or event occurs on your website or app in a given period. Examples: clicks, downloads, or form submissions.
Event Count per User:
This metric shows the average number of events triggered by each user. It helps you understand how often users interact with your site or app during their visits.
Event Parameter:
An event parameter is extra information attached to an event, such as the value of a purchase or the name of a button clicked. It helps provide more detailed insights into user actions.
Events per Session:
This metric calculates the average number of events (specific user actions) that occur within a single session. It helps you gauge how interactive or engaging your website or app is during each visit.
Exit Page:
The exit Page is the last page a visitor views before leaving your website. Identifying standard exit pages shows where users drop off. It can highlight issues or areas to improve so visitors stay longer.
Goal:
In web analytics, a goal is a predefined user action that contributes to your website’s success. Examples: a purchase, a completed form, or a newsletter signup. Tracking goals shows how well your website meets your business objectives.
Goal Conversion Rate:
The Goal Conversion Rate is the percentage of sessions that result in goal completion. It is calculated by dividing the number of conversions by the total number of sessions and multiplying by 100. This metric helps assess the effectiveness of your website in achieving specific goals.
Goal Flow:
Goal Flow is a visual representation of users’ steps to complete a goal on your website. It helps you understand the user journey, identify drop-off points, and optimize the path to improve goal completion rates.
Google Analytics 4 (GA4):
Google Analytics 4 (GA4) is the latest version of Google’s web analytics platform. It offers enhanced tracking capabilities and a user-centric approach. GA4 gives a deeper understanding of user behavior across devices and platforms. It focuses on events and engagement rather than page views alone.
Google Tag Manager (GTM):
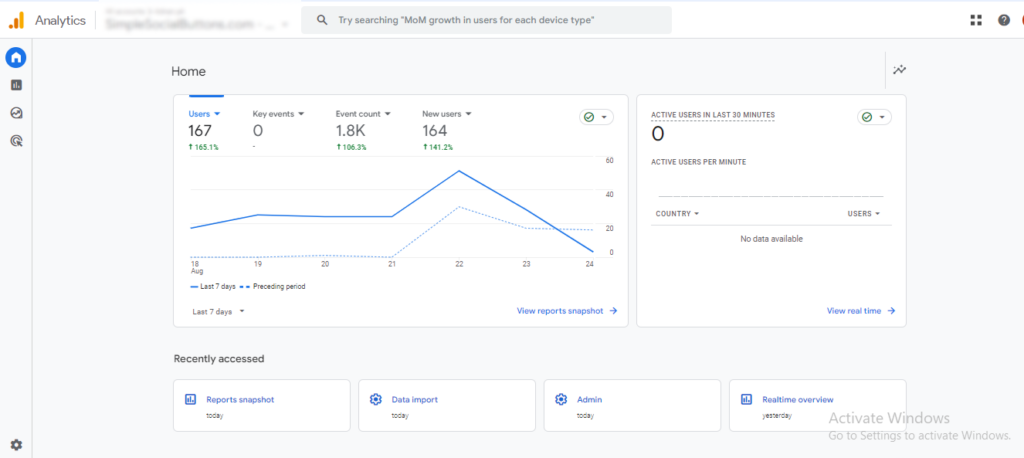
Google Tag Manager (GTM) is a tool for managing and deploying marketing tags (code snippets) on your website without changing the codebase. GTM simplifies adding and updating tags for tracking and analytics purposes.
Impression:
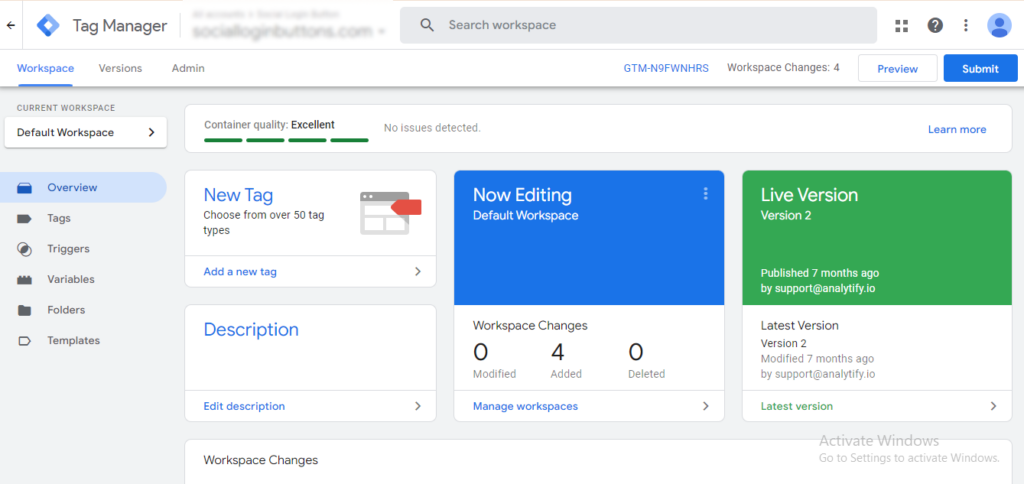
The impression is the number of times an ad or content is displayed to users, whether or not they click it. This metric helps measure the reach and visibility of your content or advertisements.
Interests:
Interests are categories that reflect your visitors’ preferences and affinities, such as topics they follow or products they might like. Understanding visitor interests helps tailor content and marketing strategies to better engage your audience.
Internal Search:
Internal Search refers to the search function within your website that allows users to find content or products. Analyzing internal search data shows what visitors look for. It helps you improve navigation, content, and user experience.
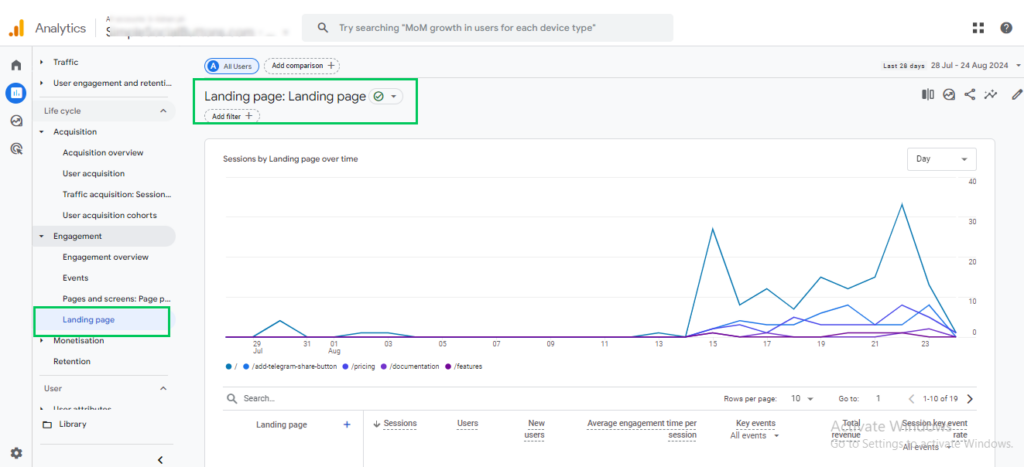
Landing Page:
A Landing Page is the first page visitors see when they arrive at your website. It is designed to capture attention and encourage a specific action, such as signing up for a newsletter or purchasing. Effective landing pages are crucial for driving conversions and achieving marketing goals.
Last Click Attribution:
Last Click Attribution is an attribution model that gives 100% of the conversion credit to the last touchpoint before the action. This model helps identify which channels or campaigns are most effective at closing conversions.
Lifetime Value (LTV):
Lifetime Value (LTV) is the total revenue a business can expect from one customer over the whole relationship. Understanding lifetime value helps companies optimize customer acquisition strategies and focus on retaining high-value customers.
Lookalike Audiences:
Lookalike Audiences are groups of potential customers who resemble your existing customers based on specific characteristics or behaviors. These audiences are built from data on platforms like Facebook or Google Ads. They expand your reach to similar users likely to want your products or services.
Looker Studio:
Looker Studio (formerly Google Data Studio) is a tool for building custom, interactive reports and dashboards from many data sources. It helps track and analyze metrics clearly and understandably.
Lower Funnel:
This customer journey stage brings prospects closer to a purchase or conversion. At this stage, marketing focuses on converting prospects into customers. Tactics include personalized offers, detailed product information, and direct calls to action.
Medium:
Medium is the general category of the source that drives traffic, such as organic search, paid search, email, social, or referral. It helps you understand the effectiveness of different marketing channels in attracting visitors.
Metric:
The metric is a quantifiable measurement used to track performance, such as page views, bounce rate, conversion rate, and session duration. Metrics provide essential data for analyzing and optimizing performance.
Measurement ID:
This is a unique identifier that GA4 uses to collect data from a specific website or app. It helps ensure the right data is collected and sent to the correct analytics account.
Multi-Channel Funnels:
Multi-channel funnels in analytics show how different marketing channels drive conversions. They illustrate the paths users take before completing a goal. They show the combined impact of multiple touchpoints on conversion.
Organic Search:
Organic Search refers to traffic that comes to your website from unpaid search engine results. It indicates how effective your search engine optimization (SEO) is at driving visitors from search queries.
Pageviews:
Pageviews are the total number of times a page on your website is viewed. This metric helps you understand your content’s popularity and engagement level, indicating how often users visit specific pages.
Paid Search:
Paid search refers to traffic generated from paid advertising on search engines, typically through pay-per-click (PPC) campaigns. This channel helps you reach users actively searching for keywords related to your products or services.
Path:
In web analytics, a path is the sequence of pages a user visits during a session on your website. Analyzing user paths helps you understand navigation behavior and identify potential barriers to achieving desired actions.
Performance Overview:
Performance Overview is a high-level summary of key metrics. It shows the overall performance of your website or marketing campaigns. It helps you quickly assess the health and effectiveness of your efforts.
Primary Dimension:
Primary Dimension is the main attribute that organizes data in a report, such as landing page, source, or campaign. It is the basis for analyzing metrics and comparing performance across different segments.
Property:
In Google Analytics, a property refers to a website, mobile app, or device you want to track. Each property has its own tracking ID and configuration settings, so you can collect and analyze data for that asset.
Page Load Time:
Page Load Time measures how long a web page can fully load in a user’s browser. Faster load times improve user experience and can help SEO rankings. Slower load times can raise bounce rates and reduce conversions.
Pages/Session:
Pages/Session refers to the average number of pages viewed by a user during a single session on your website. This metric helps assess user engagement and the depth of interaction with your content.
Path Analysis:
Path Analysis visualizes the sequence of pages or events users follow on your website. It helps identify common user journeys, entry and exit points, and obstacles. Use it to optimize navigation and improve user experience.
Parameter:
In analytics, a parameter is information that adds extra details to an event or action. For example, if a user clicks a button, a parameter might record the button’s name or location on the page.
Referrals:
Referrals are visitors who come to your website from other websites or sources, excluding search engines and direct traffic. Analyzing referrals helps you understand which external sites drive traffic and how they contribute to your overall website performance.
Remarketing:
Remarketing is a strategy that targets past visitors with tailored ads. The ads encourage them to return and convert. It helps re-engage potential customers and increase the likelihood of conversions.
Reporting:
Reporting involves generating and analyzing data summaries to assess performance metrics and trends. Effective reporting provides insights into various aspects of your website or marketing campaigns, enabling informed decision-making and strategy optimization.
Return on Investment (ROI):
Return on Investment (ROI) measures the profitability of an investment by comparing gain or loss to cost. It is calculated as (Net Profit / Cost of Investment) × 100. It helps you evaluate how efficient your investments are.
Revenue:
Revenue represents the total income generated from sales or transactions on your website. Tracking revenue helps assess your business’s financial performance and the effectiveness of your marketing strategies in driving sales.
Sampling:
Sampling is a method used in analytics to analyze a subset of data rather than the entire dataset. It helps manage large volumes of data and can provide insights while reducing processing time. It may affect the precision of results.
Secondary Dimensions:
Secondary Dimensions are additional attributes added to primary dimensions. They give deeper insights and more detailed analysis in reports. For example, combining “Source” as a primary dimension with “Device” as a secondary dimension shows how devices perform across traffic sources.
Session:
The session is a period during which a user interacts with your website. It is defined by a series of pageviews, events, and interactions. Sessions typically end after 30 minutes of inactivity or at midnight. They help measure user engagement and site activity.
Site Search:
Site Search tracks the internal search queries users enter on your website. Analyzing site search data shows user intent. It helps you understand what content or products visitors seek and improve navigation and content strategy.
Secondary Conversions:
Secondary Conversions are additional valuable actions users take beyond the primary goal, such as signing up for a newsletter or downloading a whitepaper. Tracking these helps assess the broader impact of your marketing efforts and user engagement.
Segment:
Segment is a subset of your data defined by specific criteria, such as user behavior, demographics, or traffic source. Segmentation allows more detailed analysis of audience groups. It helps you understand and target various user segments more effectively.
Session Duration:
Session Duration measures the total time a user spends interacting with your website during a single session. Longer session durations typically indicate higher engagement and interest in your content.
Social Media:
Social Media refers to platforms like Facebook, Twitter, Instagram, and LinkedIn. Users engage with content and connect with others there. Tracking social media traffic shows how effective your social media marketing is. It also shows its impact on visits to your site.
Standard Reports:
Standard Reports are predefined reports that show critical metrics, such as audience demographics, traffic sources, and behavior. These reports simplify the analysis of overall website performance.
Subdomains:
Subdomains are distinct sections of a website that operate under the main domain, such as blog.example.com or shop.example.com. Tracking subdomains separately can provide awareness of the performance of different site sections and their contribution to overall traffic.
Tracking Code:
Tracking Code is a snippet of code added to your website’s pages to collect data for analytics platforms. It enables tracking user interactions, conversions, and other metrics essential for analyzing website performance.
Transaction:
Transaction refers to a completed purchase or sale on your website. Tracking transactions helps you measure revenue, analyze sales performance, and understand customer buying behavior.
Traffic Sources:
Traffic Sources are the origins of your visitors: search engines, direct visits, social media, and referral sites. Analyzing traffic sources helps you understand where your visitors are coming from and which channels are most effective.
Unique Visitors:
Unique Visitors are distinct individuals who visit your website in a given period. Each is counted once, however many times they visit. This metric helps gauge the size of your audience and track user reach.
User Flow:
User Flow visualizes the path users take through your website, from entry to exit. Analyzing user flow helps identify common navigation patterns, bottlenecks, and areas where users drop off, guiding site optimization efforts.
User ID:
User ID is a unique identifier assigned to individual users to track their interactions across multiple sessions and devices. User ID helps understand user behavior more comprehensively and provides a unified view of interactions.
User:
A user is an individual who interacts with your website or application. Understanding user behavior and demographics helps tailor content, improve user experience, and optimize marketing strategies.
User Engagement:
User Engagement measures how users interact with your website or content. It includes clicks, time on pages, and social shares. High engagement indicates strong interest and interaction, crucial for retaining users and driving conversions.
UTM Tag:
UTM (Urchin Tracking Module) tags are small pieces of text added to a URL. They help track where website traffic comes from. Marketers use them to see which ads, emails, or social posts drive the most traffic and conversions.
Value Proposition:
Value Proposition is the unique benefit your product or service offers customers. It distinguishes you from competitors. A strong value proposition communicates why users should choose your offering and how it meets their needs.
View:
View typically refers to a user loading a page or content on your website. Measuring views shows the popularity and reach of specific pages or content. It also shows user interest and engagement.
Website Analytics:
Website Analytics involves collecting, measuring, and analyzing data related to website performance, user behavior, and traffic sources. It shows how users interact with your site. It helps you make data-driven decisions to improve user experience and reach business goals.
Website Speed:
Website Speed measures how quickly your website loads and responds to user requests. Faster website speed improves user experience, reduces bounce rates, and can positively impact search engine rankings and conversion rates.
WordPress Analytics
WordPress Analytics is the tracking and analysis of WordPress website data, including visitor behavior, traffic sources, and content performance. Analytify integrates Google Analytics into WordPress. You view and manage detailed analytics from the WordPress dashboard. Compare every Google Analytics plugin for WordPress to choose one.
Year-over-Year (YoY):
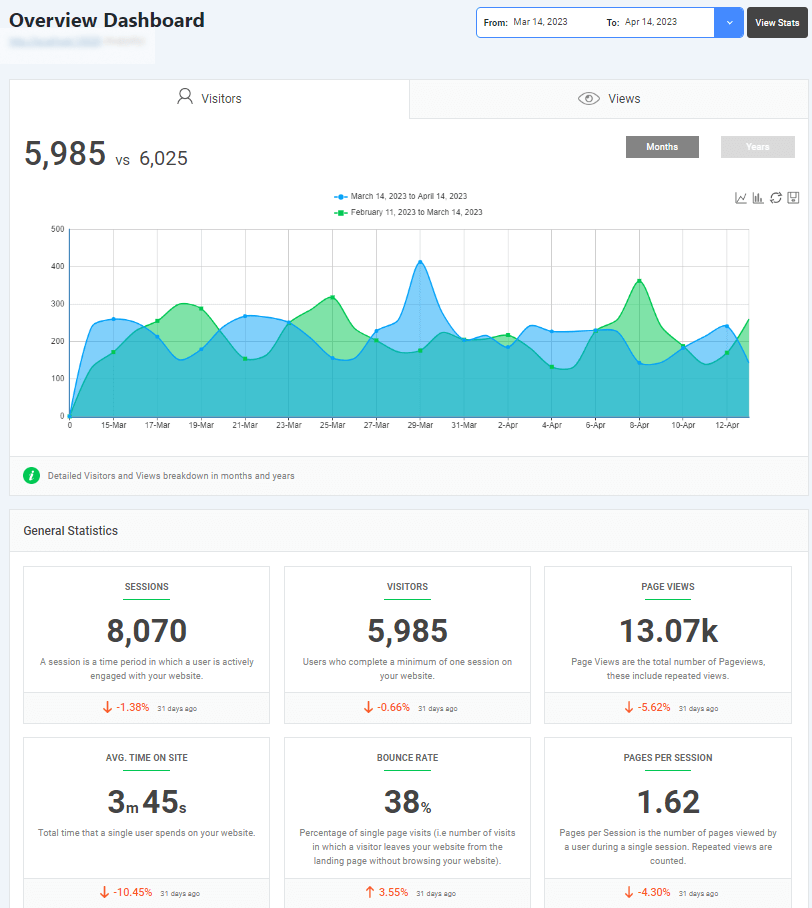
Year-over-year (YoY) comparisons compare metrics from one year to the same period the year before. They show growth trends and performance changes over time. YoY analysis helps assess long-term progress and the impact of seasonal or annual factors.
Zero-Click Searches:
Zero-click searches occur when users get the information they need directly on the search results page (SERP). They do not click through to a website. These searches often feature snippets, knowledge panels, or other information the search engine provides.
GA4 Glossary FAQs
1. What is a Google Analytics Glossary?
A Google Analytics Glossary is a comprehensive resource that provides definitions and explanations of the key terms used within Google Analytics. This glossary is essential for understanding the various metrics, dimensions, and reports in Google Analytics, helping users to navigate the platform more effectively.
2. Why is the Google Analytics 4 Glossary important?
The GA4 Glossary is crucial because it offers definitions specific to Google Analytics 4 (GA4), the latest version of Google Analytics. As GA4 introduces new concepts and metrics, this glossary ensures users are familiar with the updated Google Analytics terminology, enabling them to utilize GA4 to its full potential.
3. What are some essential Google Analytics definitions I should know?
Essential Google Analytics definitions include terms like “sessions,” “bounce rate,” “conversion rate,” “events,” and “user engagement.” Each of these terms plays a vital role in analyzing website performance and user behavior.
4. Where can I find an analytics glossary for GA4?
You can find an analytics glossary for GA4 on Google’s official documentation or on Analytify website that focus on GA4 definitions. These glossaries provide detailed explanations of the new terms and concepts introduced in GA4, helping users transition smoothly from previous versions of Google Analytics.
5. What is the difference between GA4 terms and Universal Analytics terms?
GA4 terms often differ from those used in Universal Analytics due to changes in how data is collected and reported. For example, GA4 focuses more on event-based data, while Universal Analytics is more session-based. Understanding these differences is crucial for accurately analyzing data in GA4.
6. How frequently should I refer to a Google Analytics glossary?
You should refer to a Google Analytics glossary whenever you encounter unfamiliar terms or need clarification on specific metrics. Regularly consulting the glossary will enhance your understanding and ensure you’re using the platform effectively.
Wrapping Up: Google Analytics Terms
Whether you use GA4 or an earlier version, this glossary helps you interpret data. The GA4 Glossary and its Google Analytics terminology matter most for following the latest Google Analytics updates. With the evolving nature of digital analytics, having a comprehensive understanding of analytics terms ensures you stay ahead.
In short, the importance of a well-rounded analytics glossary cannot be overstated. It helps you interpret data accurately and apply the right metrics. This leads to more successful digital marketing.
Want to learn more? Read other articles on our blog to keep exploring Google Analytics.
If you found this guide helpful, don’t forget to share it! We’d love to hear your thoughts, leave a comment below with any questions you might have.